Matplotlib绘制虚线图:全面掌握虚线样式和技巧
Matplotlib是Python中最流行的数据可视化库之一,它提供了丰富的绘图功能,其中包括绘制各种类型的线条。在本文中,我们将深入探讨如何使用Matplotlib绘制虚线图,这是一种在数据可视化中常用的线型。虚线图不仅能够区分不同的数据系列,还能够在某些情况下增强图表的可读性。我们将从基础知识开始,逐步深入到更高级的技巧,帮助你全面掌握Matplotlib中虚线的绘制方法。
1. Matplotlib虚线基础
在Matplotlib中,绘制虚线主要通过设置线条的linestyle参数来实现。最简单的方法是使用预定义的字符串来指定虚线样式。
1.1 基本虚线样式
以下是一个简单的示例,展示了如何绘制基本的虚线:
import matplotlib.pyplot as plt
import numpy as np

x = np.linspace(0, 10, 100)
y = np.sin(x)

plt.figure(figsize=(10, 6))
plt.plot(x, y, linestyle='--', label='Dashed line')
plt.title('How to plot dashed line with Matplotlib - how2matplotlib.com')
plt.xlabel('X-axis')
plt.ylabel('Y-axis')
plt.legend()
plt.grid(True)
plt.show()
Output:
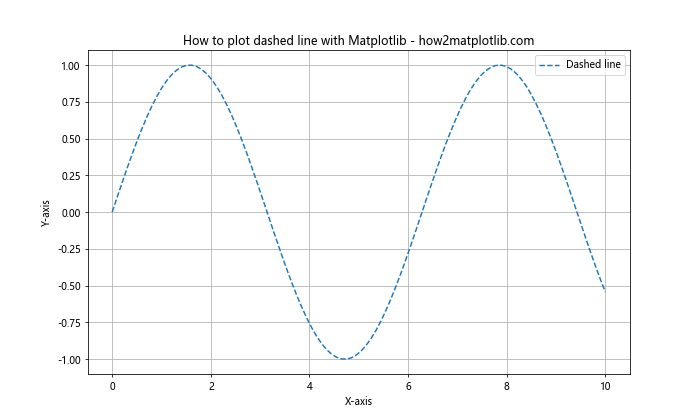
在这个示例中,我们使用linestyle='--'来指定虚线样式。Matplotlib提供了几种预定义的虚线样式:
'--': 虚线'-.': 点划线':': 点线'-': 实线(默认)
1.2 自定义虚线样式
除了使用预定义的样式,我们还可以通过提供一个包含on/off序列的元组来自定义虚线样式。
import matplotlib.pyplot as plt
import numpy as np

x = np.linspace(0, 10, 100)
y1 = np.sin(x)
y2 = np.cos(x)

plt.figure(figsize=(10, 6))
plt.plot(x, y1, linestyle=(0, (5, 5)), label='Custom dashed')
plt.plot(x, y2, linestyle=(0, (5, 1)), label='Custom dotted')
plt.title('Custom dashed lines - how2matplotlib.com')
plt.xlabel('X-axis')
plt.ylabel('Y-axis')
plt.legend()
plt.grid(True)
plt.show()
Output:
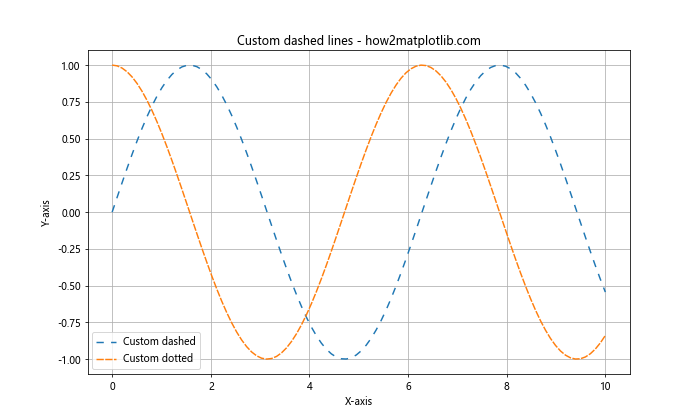
在这个例子中,(0, (5, 5))表示一个虚线样式,其中线段长度为5个点,间隔也为5个点。(0, (5, 1))表示线段长度为5个点,间隔为1个点,形成一种点线样式。
2. 虚线颜色和宽度
虚线的视觉效果不仅取决于其样式,还受到颜色和宽度的影响。我们可以轻松地调整这些属性来增强图表的表现力。
2.1 设置虚线颜色
import matplotlib.pyplot as plt
import numpy as np

x = np.linspace(0, 10, 100)
y1 = np.sin(x)
y2 = np.cos(x)

plt.figure(figsize=(10, 6))
plt.plot(x, y1, linestyle='--', color='red', label='Red dashed')
plt.plot(x, y2, linestyle='-.', color='blue', label='Blue dash-dot')
plt.title('Colored dashed lines - how2matplotlib.com')
plt.xlabel('X-axis')
plt.ylabel('Y-axis')
plt.legend()
plt.grid(True)
plt.show()
Output:
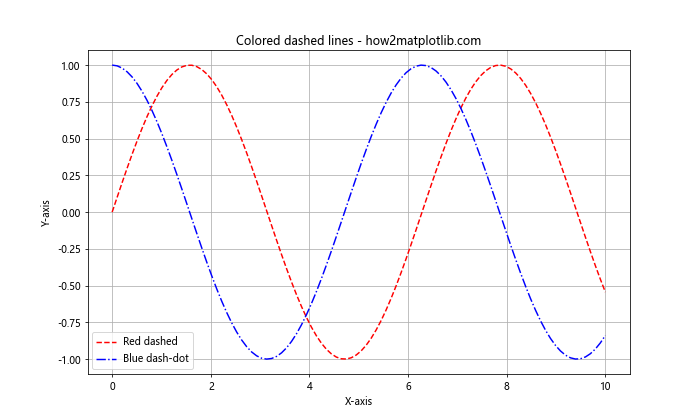
在这个例子中,我们使用color参数来设置虚线的颜色。你可以使用颜色名称、RGB元组或十六进制颜色代码来指定颜色。
2.2 调整虚线宽度
import matplotlib.pyplot as plt
import numpy as np

x = np.linspace(0, 10, 100)
y1 = np.sin(x)
y2 = np.cos(x)

plt.figure(figsize=(10, 6))
plt.plot(x, y1, linestyle='--', linewidth=1, label='Thin dashed')
plt.plot(x, y2, linestyle='--', linewidth=3, label='Thick dashed')
plt.title('Dashed lines with different widths - how2matplotlib.com')
plt.xlabel('X-axis')
plt.ylabel('Y-axis')
plt.legend()
plt.grid(True)
plt.show()
Output:
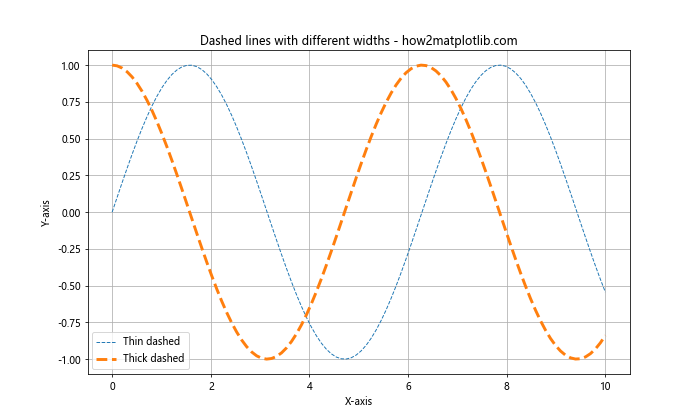
使用linewidth参数可以调整线条的宽度。较粗的线条可以用来强调重要的数据系列。
3. 虚线在多数据系列图表中的应用
在绘制多个数据系列的图表时,使用不同的虚线样式可以有效地区分各个系列,提高图表的可读性。
3.1 组合使用不同虚线样式
import matplotlib.pyplot as plt
import numpy as np

x = np.linspace(0, 10, 100)
y1 = np.sin(x)
y2 = np.cos(x)
y3 = np.tan(x)

plt.figure(figsize=(12, 6))
plt.plot(x, y1, linestyle='--', label='Dashed')
plt.plot(x, y2, linestyle='-.', label='Dash-dot')
plt.plot(x, y3, linestyle=':', label='Dotted')
plt.title('Multiple data series with different dashed styles - how2matplotlib.com')
plt.xlabel('X-axis')
plt.ylabel('Y-axis')
plt.legend()
plt.grid(True)
plt.ylim(-2, 2)  # 限制y轴范围以便更好地显示
plt.show()
Output:
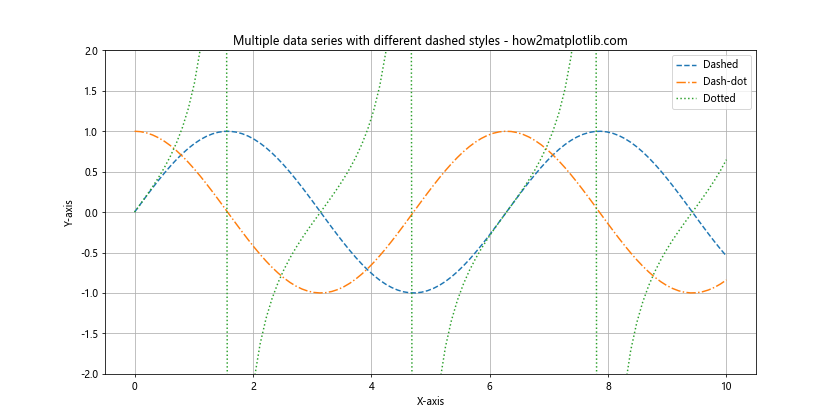
这个例子展示了如何在一个图表中使用不同的虚线样式来区分多个数据系列。
3.2 结合颜色和虚线样式
import matplotlib.pyplot as plt
import numpy as np

x = np.linspace(0, 10, 100)
y1 = np.sin(x)
y2 = np.cos(x)
y3 = x / 5

plt.figure(figsize=(12, 6))
plt.plot(x, y1, linestyle='--', color='red', label='Red dashed')
plt.plot(x, y2, linestyle='-.', color='blue', label='Blue dash-dot')
plt.plot(x, y3, linestyle=':', color='green', label='Green dotted')
plt.title('Combining colors and dashed styles - how2matplotlib.com')
plt.xlabel('X-axis')
plt.ylabel('Y-axis')
plt.legend()
plt.grid(True)
plt.show()
Output:
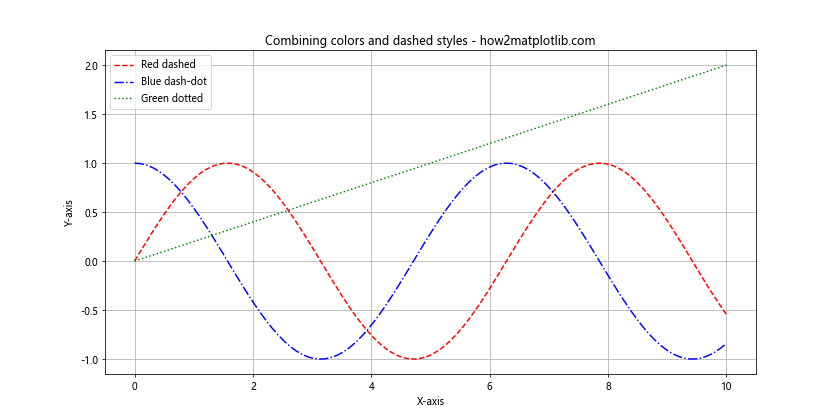
通过结合不同的颜色和虚线样式,我们可以创建更加丰富和易于区分的多数据系列图表。
4. 虚线在特殊图表类型中的应用
虚线不仅可以用于普通的线图,还可以应用于其他类型的图表,如散点图、误差线等。
4.1 散点图中的虚线连接
import matplotlib.pyplot as plt
import numpy as np

x = np.array([1, 2, 3, 4, 5])
y = np.array([1, 4, 2, 3, 5])

plt.figure(figsize=(10, 6))
plt.scatter(x, y, s=50, label='Data points')
plt.plot(x, y, linestyle='--', color='red', label='Dashed connection')
plt.title('Scatter plot with dashed line connection - how2matplotlib.com')
plt.xlabel('X-axis')
plt.ylabel('Y-axis')
plt.legend()
plt.grid(True)
plt.show()
Output:
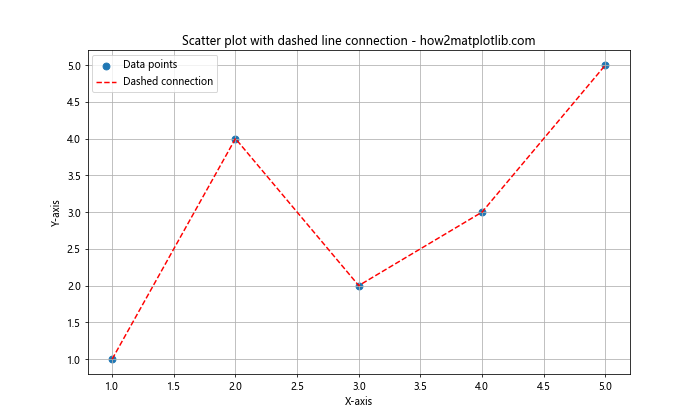
这个例子展示了如何在散点图中使用虚线连接数据点,这种方法可以帮助观察数据点之间的趋势。
4.2 误差线中的虚线
import matplotlib.pyplot as plt
import numpy as np

x = np.array([1, 2, 3, 4, 5])
y = np.array([1, 4, 2, 3, 5])
yerr = np.array([0.1, 0.2, 0.3, 0.2, 0.1])

plt.figure(figsize=(10, 6))
plt.errorbar(x, y, yerr=yerr, fmt='o', capsize=5,
             ecolor='red', elinewidth=2, capthick=2,
             linestyle='--', label='Data with error')
plt.title('Error bars with dashed lines - how2matplotlib.com')
plt.xlabel('X-axis')
plt.ylabel('Y-axis')
plt.legend()
plt.grid(True)
plt.show()
Output:
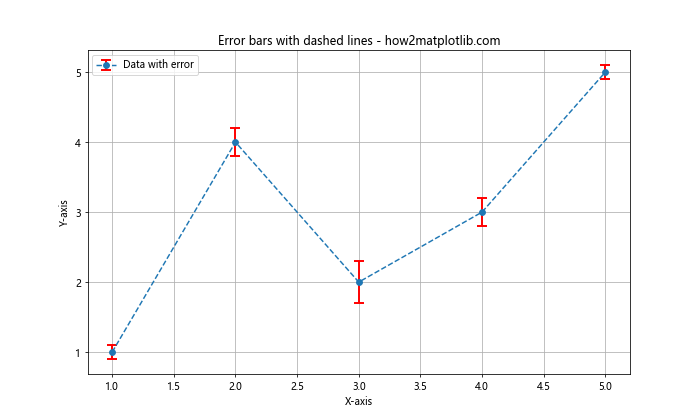
在这个例子中,我们使用虚线来绘制误差线,这可以帮助区分误差线和主数据点。
5. 高级虚线技巧
除了基本的虚线绘制,Matplotlib还提供了一些高级技巧,可以让你的虚线图表更加精美和专业。
5.1 虚线动画效果
虽然静态的虚线图已经很有用,但有时我们可能想要创建动态效果,比如移动的虚线。以下是一个简单的动画示例:
import matplotlib.pyplot as plt
import numpy as np
from matplotlib.animation import FuncAnimation

fig, ax = plt.subplots(figsize=(10, 6))
x = np.linspace(0, 10, 100)
line, = ax.plot(x, np.sin(x), linestyle='--', animated=True)

def update(frame):
    line.set_ydata(np.sin(x + frame / 10))
    return line,

ani = FuncAnimation(fig, update, frames=100, interval=50, blit=True)
plt.title('Animated dashed line - how2matplotlib.com')
plt.xlabel('X-axis')
plt.ylabel('Y-axis')
plt.show()
Output:
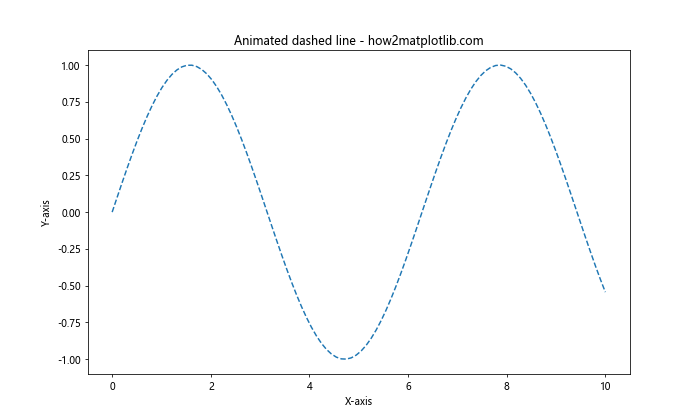
这个例子创建了一个移动的正弦波虚线动画。虽然在静态文档中无法显示动画效果,但运行这段代码会产生一个动态的虚线图。
5.2 虚线填充
有时,我们可能想要在两条虚线之间填充颜色。这在表示数据范围或不确定性时特别有用:
import matplotlib.pyplot as plt
import numpy as np

x = np.linspace(0, 10, 100)
y1 = np.sin(x)
y2 = np.sin(x) + 0.5

plt.figure(figsize=(10, 6))
plt.plot(x, y1, linestyle='--', color='blue', label='Lower bound')
plt.plot(x, y2, linestyle='--', color='red', label='Upper bound')
plt.fill_between(x, y1, y2, alpha=0.2, label='Filled area')
plt.title('Filled area between dashed lines - how2matplotlib.com')
plt.xlabel('X-axis')
plt.ylabel('Y-axis')
plt.legend()
plt.grid(True)
plt.show()
Output:
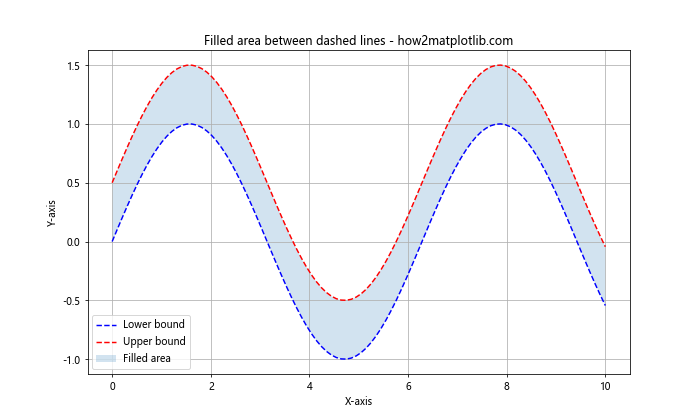
这个例子展示了如何在两条虚线之间填充颜色,创建一个视觉上吸引人的数据范围表示。
5.3 虚线与标记的结合
将虚线与数据点标记结合使用可以提供更多的数据细节:
import matplotlib.pyplot as plt
import numpy as np

x = np.linspace(0, 10, 20)
y = np.sin(x)

plt.figure(figsize=(10, 6))
plt.plot(x, y, linestyle='--', marker='o', markersize=8,
         markerfacecolor='red', markeredgecolor='blue',
         label='Dashed line with markers')
plt.title('Dashed line with markers - how2matplotlib.com')
plt.xlabel('X-axis')
plt.ylabel('Y-axis')
plt.legend()
plt.grid(True)
plt.show()
Output:
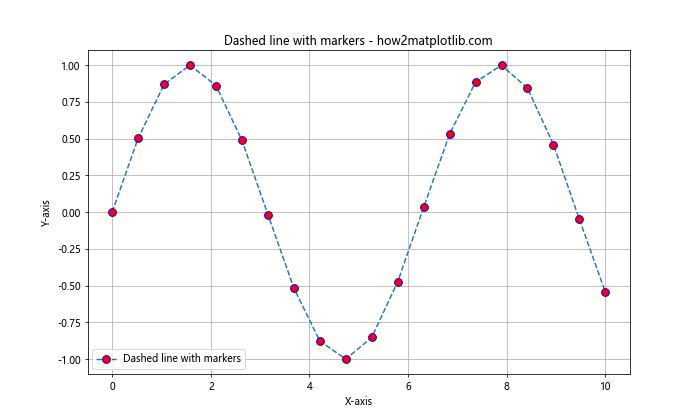
这个例子展示了如何将虚线与数据点标记结合,既显示了整体趋势,又突出了具体的数据点。
6. 虚线在多子图中的应用
在复杂的数据分析中,我们经常需要在一个图形中展示多个相关但独立的图表。Matplotlib的子图功能允许我们轻松地创建这样的复合图表,而虚线可以在这些子图中发挥重要作用。
6.1 创建包含虚线的多子图
import matplotlib.pyplot as plt
import numpy as np

x = np.linspace(0, 10, 100)
y1 = np.sin(x)
y2 = np.cos(x)
y3 = np.tan(x)
y4 = x**2

fig, ((ax1, ax2), (ax3, ax4)) = plt.subplots(2, 2, figsize=(12, 10))

ax1.plot(x, y1, linestyle='--', color='red')
ax1.set_title('Sine - how2matplotlib.com')

ax2.plot(x, y2, linestyle='-.', color='blue')
ax2.set_title('Cosine - how2matplotlib.com')

ax3.plot(x, y3, linestyle=':', color='green')
ax3.set_title('Tangent - how2matplotlib.com')

ax4.plot(x, y4, linestyle=(0, (3, 1, 1, 1)), color='purple')
ax4.set_title('Quadratic - how2matplotlib.com')

for ax in (ax1, ax2, ax3, ax4):
    ax.set_xlabel('X-axis')
    ax.set_ylabel('Y-axis')
    ax.grid(True)

plt.tight_layout()
plt.show()
Output:
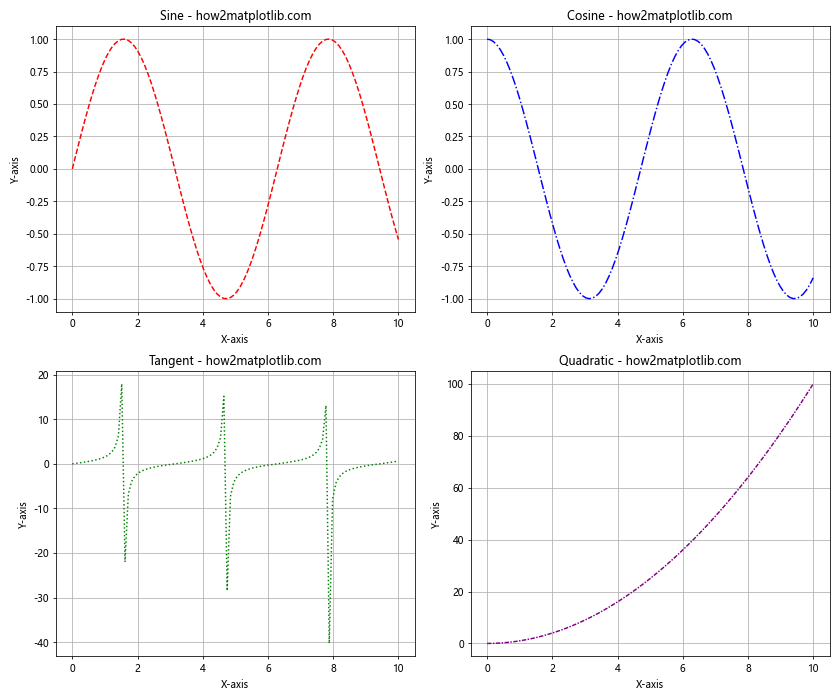
这个例子创建了一个2×2的子图网格,每个子图都使用不同的虚线样式。这种方法允许我们在一个图形中比较多个相关但不同的数据集。
6.2 子图中的虚线对比
有时,我们可能想在同一个子图中比较不同的虚线样式:
import matplotlib.pyplot as plt
import numpy as np

x = np.linspace(0, 10, 100)
y1 = np.sin(x)
y2 = np.cos(x)

fig, (ax1, ax2) = plt.subplots(1, 2, figsize=(12, 5))

ax1.plot(x, y1, linestyle='--', label='Dashed')
ax1.plot(x, y2, linestyle='-.', label='Dash-dot')
ax1.set_title('Sine vs Cosine (Different styles) - how2matplotlib.com')
ax1.legend()

ax2.plot(x, y1, linestyle='--', color='red', label='Sine')
ax2.plot(x, y2, linestyle='--', color='blue', label='Cosine')
ax2.set_title('Sine vs Cosine (Same style) - how2matplotlib.com')
ax2.legend()

for ax in (ax1, ax2):
    ax.set_xlabel('X-axis')
    ax.set_ylabel('Y-axis')
    ax.grid(True)

plt.tight_layout()
plt.show()
Output:
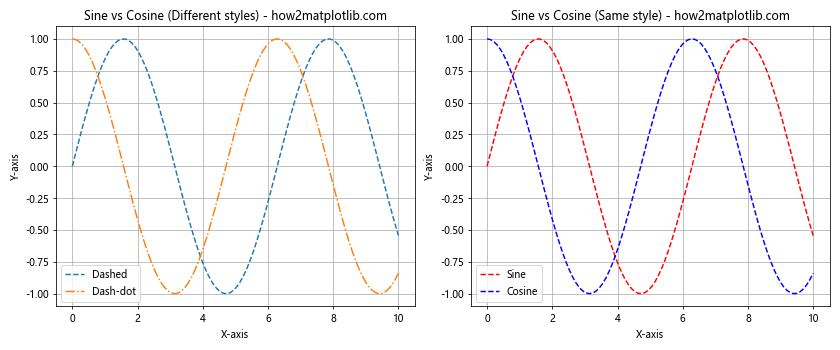
这个例子展示了如何在一个子图中使用不同的虚线样式来区分数据系列,而在另一个子图中使用相同的虚线样式但不同的颜色来区分数据系列。
7. 虚线在数据分析中的应用
虚线在数据分析中有许多实际应用,特别是在表示趋势线、预测或阈值时。
7.1 趋势线和预测
import matplotlib.pyplot as plt
import numpy as np
from sklearn.linear_model import LinearRegression

# 生成一些随机数据
np.random.seed(0)
x = np.linspace(0, 10, 50)
y = 2 * x + 1 + np.random.normal(0, 1, 50)

# 拟合线性回归模型
model = LinearRegression()
model.fit(x.reshape(-1, 1), y)

# 预测未来值
x_future = np.linspace(10, 15, 20)
y_pred = model.predict(x_future.reshape(-1, 1))

plt.figure(figsize=(12, 6))
plt.scatter(x, y, label='Actual data')
plt.plot(x, model.predict(x.reshape(-1, 1)), color='red', label='Trend line')
plt.plot(x_future, y_pred, linestyle='--', color='green', label='Prediction')
plt.title('Trend line and prediction with dashed line - how2matplotlib.com')
plt.xlabel('X-axis')
plt.ylabel('Y-axis')
plt.legend()
plt.grid(True)
plt.show()
Output:
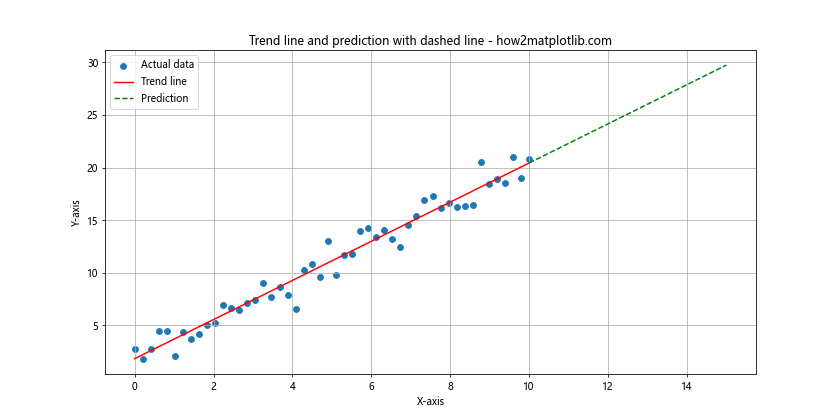
在这个例子中,我们使用实线表示当前数据的趋势线,而使用虚线表示未来的预测。这种视觉区分可以帮助读者轻松识别实际数据和预测数据。
7.2 阈值和参考线
import matplotlib.pyplot as plt
import numpy as np

np.random.seed(0)
x = np.linspace(0, 10, 100)
y = np.sin(x) + np.random.normal(0, 0.1, 100)

plt.figure(figsize=(12, 6))
plt.plot(x, y, label='Data')
plt.axhline(y=0.5, color='r', linestyle='--', label='Upper threshold')
plt.axhline(y=-0.5, color='g', linestyle='--', label='Lower threshold')
plt.title('Data with threshold lines - how2matplotlib.com')
plt.xlabel('X-axis')
plt.ylabel('Y-axis')
plt.legend()
plt.grid(True)
plt.show()
Output:
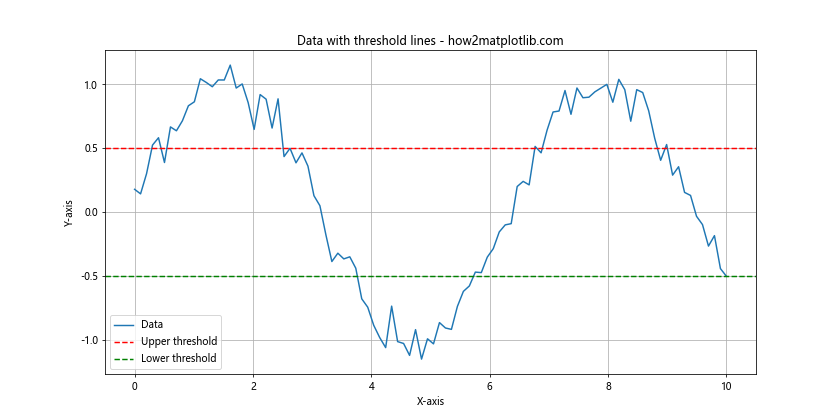
这个例子展示了如何使用虚线来表示阈值或参考线。这在分析数据是否超过某个特定值时非常有用。
8. 自定义虚线样式
虽然Matplotlib提供了一些预定义的虚线样式,但有时我们可能需要更加独特或复杂的样式。
8.1 使用破折号序列
import matplotlib.pyplot as plt
import numpy as np

x = np.linspace(0, 10, 100)
y = np.sin(x)

plt.figure(figsize=(12, 6))
plt.plot(x, y, linestyle=(0, (5, 1, 1, 1)), label='Custom dash')
plt.plot(x, np.cos(x), linestyle=(0, (3, 1, 1, 1, 1, 1)), label='More complex dash')
plt.title('Custom dashed lines - how2matplotlib.com')
plt.xlabel('X-axis')
plt.ylabel('Y-axis')
plt.legend()
plt.grid(True)
plt.show()
Output:
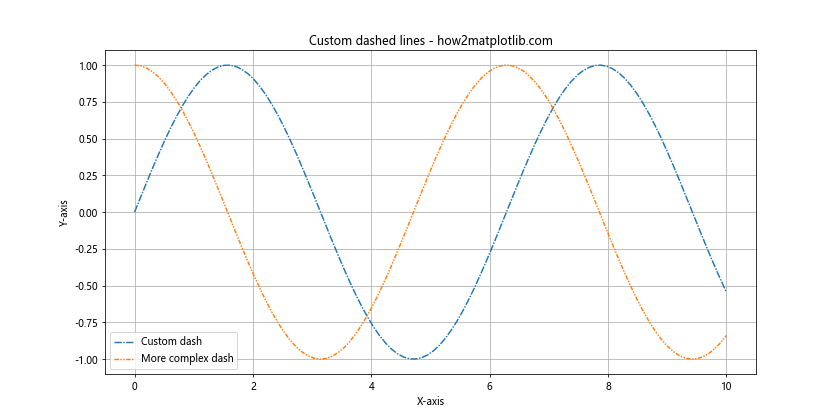
在这个例子中,我们使用元组来定义自定义的虚线样式。元组中的数字定义了线段和间隔的长度。
8.2 使用LineCollection
对于更复杂的虚线需求,我们可以使用LineCollection:
import matplotlib.pyplot as plt
import numpy as np
from matplotlib.collections import LineCollection

x = np.linspace(0, 10, 100)
y = np.sin(x)

points = np.array([x, y]).T.reshape(-1, 1, 2)
segments = np.concatenate([points[:-1], points[1:]], axis=1)

fig, ax = plt.subplots(figsize=(12, 6))
lc = LineCollection(segments, linestyles=[(0, (2, 1))], colors='blue')
ax.add_collection(lc)
ax.set_xlim(x.min(), x.max())
ax.set_ylim(y.min(), y.max())
plt.title('Complex dashed line using LineCollection - how2matplotlib.com')
plt.xlabel('X-axis')
plt.ylabel('Y-axis')
plt.grid(True)
plt.show()
Output:
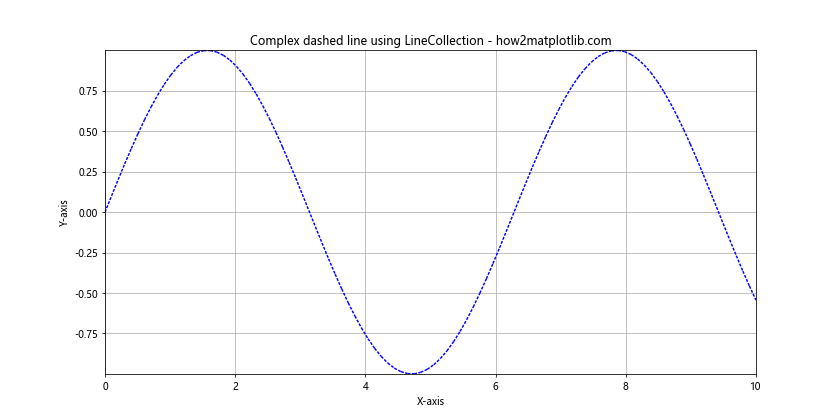
这个方法允许我们对线条的每个部分应用不同的样式,虽然在这个例子中我们使用了统一的样式。
9. 虚线在3D图表中的应用
Matplotlib不仅支持2D图表,还支持3D图表。虚线同样可以在3D环境中使用,为3D可视化添加更多细节。
9.1 3D线图中的虚线
import matplotlib.pyplot as plt
import numpy as np

fig = plt.figure(figsize=(12, 8))
ax = fig.add_subplot(111, projection='3d')

t = np.linspace(0, 10, 100)
x = np.sin(t)
y = np.cos(t)
z = t

ax.plot(x, y, z, linestyle='--', label='3D dashed line')
ax.set_xlabel('X-axis')
ax.set_ylabel('Y-axis')
ax.set_zlabel('Z-axis')
ax.legend()
plt.title('3D dashed line - how2matplotlib.com')
plt.show()
Output:
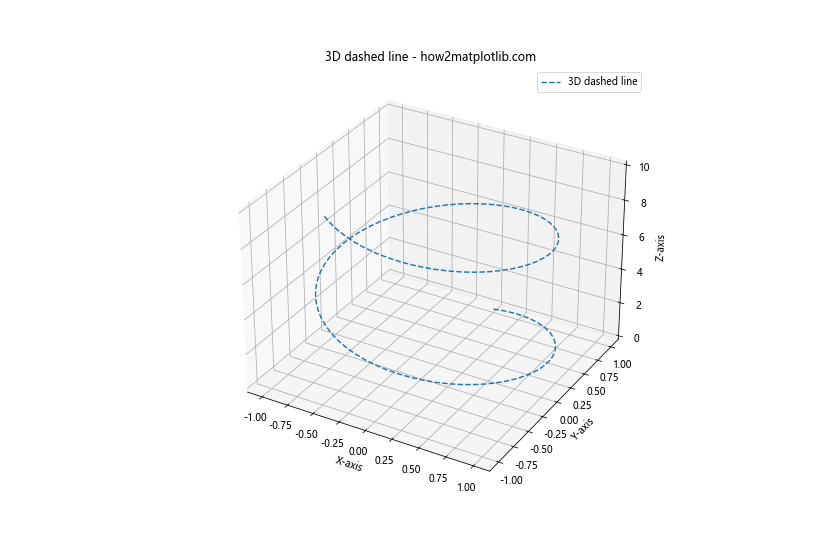
这个例子展示了如何在3D空间中绘制虚线。这种技术可以用来表示复杂的3D轨迹或路径。
9.2 3D平面中的虚线边界
import matplotlib.pyplot as plt
import numpy as np

fig = plt.figure(figsize=(12, 8))
ax = fig.add_subplot(111, projection='3d')

x = np.linspace(-5, 5, 100)
y = np.linspace(-5, 5, 100)
X, Y = np.meshgrid(x, y)
Z = np.sin(np.sqrt(X**2 + Y**2))

surf = ax.plot_surface(X, Y, Z, cmap='viridis')

# 添加虚线边界
for i in range(4):
    ax.plot3D([x[0], x[-1], x[-1], x[0], x[0]],
              [y[0], y[0], y[-1], y[-1], y[0]],
              [Z[0,0], Z[0,-1], Z[-1,-1], Z[-1,0], Z[0,0]],
              color='red', linestyle='--')

ax.set_xlabel('X-axis')
ax.set_ylabel('Y-axis')
ax.set_zlabel('Z-axis')
plt.title('3D surface with dashed boundary - how2matplotlib.com')
plt.show()
Output:
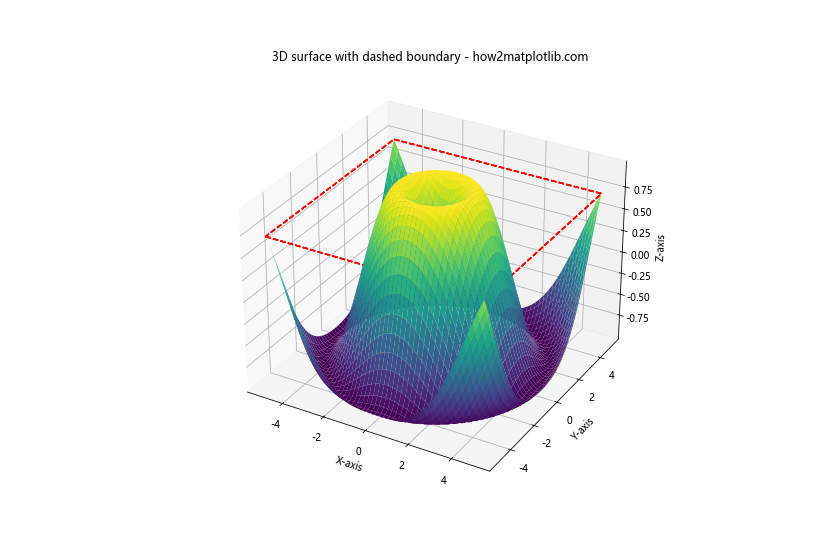
这个例子展示了如何在3D表面图中添加虚线边界。这种技术可以用来强调3D表面的边界或特定区域。
10. 虚线在时间序列数据中的应用
虚线在时间序列数据的可视化中特别有用,尤其是在表示不连续的数据或预测时。
10.1 不连续时间序列数据
import matplotlib.pyplot as plt
import pandas as pd
import numpy as np

# 创建一个带有缺失值的时间序列
dates = pd.date_range(start='2023-01-01', end='2023-12-31', freq='D')
values = np.random.randn(len(dates))
ts = pd.Series(values, index=dates)
ts[ts < -0.5] = np.nan  # 将一些值设为NaN

plt.figure(figsize=(12, 6))
plt.plot(ts.index, ts.values, linestyle='--', marker='o')
plt.title('Discontinuous time series with dashed lines - how2matplotlib.com')
plt.xlabel('Date')
plt.ylabel('Value')
plt.grid(True)
plt.show()
Output:
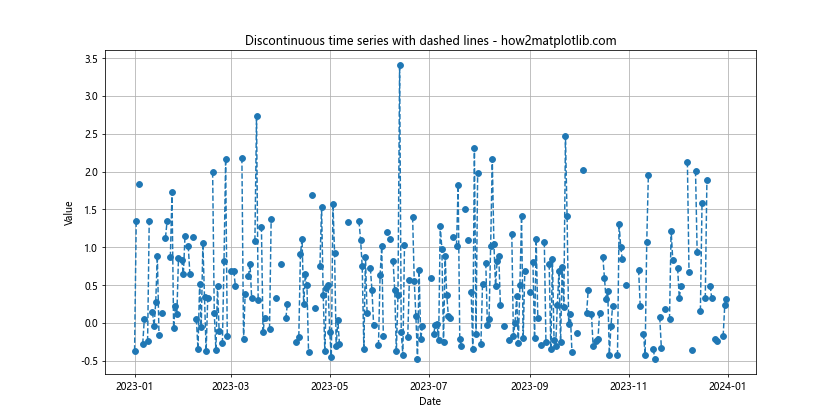
在这个例子中,虚线用于连接不连续的数据点,清晰地表示数据中的缺失部分。
10.2 时间序列预测
import matplotlib.pyplot as plt
import pandas as pd
import numpy as np

# 创建一个简单的时间序列
dates = pd.date_range(start='2023-01-01', end='2023-12-31', freq='D')
values = np.cumsum(np.random.randn(len(dates)))
ts = pd.Series(values, index=dates)

# 模拟预测
future_dates = pd.date_range(start='2024-01-01', end='2024-03-31', freq='D')
future_values = np.cumsum(np.random.randn(len(future_dates))) + values[-1]

plt.figure(figsize=(12, 6))
plt.plot(ts.index, ts.values, label='Actual data')
plt.plot(future_dates, future_values, linestyle='--', label='Prediction')
plt.title('Time series with prediction using dashed line - how2matplotlib.com')
plt.xlabel('Date')
plt.ylabel('Value')
plt.legend()
plt.grid(True)
plt.show()
Output:
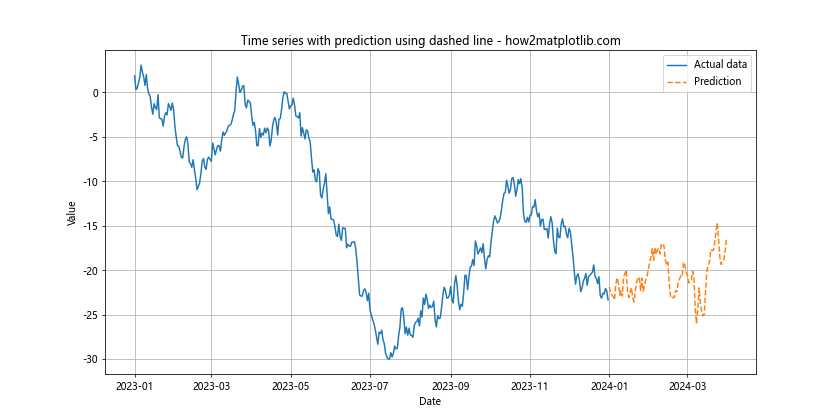
这个例子展示了如何使用虚线来表示时间序列数据的预测部分,清晰地区分实际数据和预测数据。
结论
通过本文,我们深入探讨了Matplotlib中虚线的各种应用和技巧。从基本的虚线样式到高级的自定义技巧,从2D图表到3D可视化,我们看到了虚线在数据可视化中的多样性和重要性。虚线不仅可以用来区分不同的数据系列,还可以表示预测、阈值、不确定性等重要信息。
掌握这些技巧将使你能够创建更加丰富、专业和信息量大的图表。记住,虚线的选择应该始终服务于你的数据和你想传达的信息。适当使用虚线可以大大提高图表的可读性和吸引力,帮助你更有效地展示和分析数据。
无论你是在进行科学研究、数据分析还是商业报告,熟练运用Matplotlib中的虚线技巧都将成为你数据可视化工具箱中的一个强大武器。继续实践和探索,你会发现更多创造性的方式来使用虚线,使你的数据故事更加生动和引人入胜。
 极客教程
极客教程