Matplotlib中绘制虚线及其间距控制详解
参考:matplotlib dashed line spacing
Matplotlib是Python中最流行的数据可视化库之一,它提供了丰富的绘图功能,包括绘制各种类型的线条。在数据可视化中,虚线是一种常用的线型,可以用来区分不同的数据系列或强调特定的信息。本文将详细介绍如何在Matplotlib中绘制虚线,以及如何控制虚线的间距,以满足各种可视化需求。
1. Matplotlib中的基本虚线绘制
在Matplotlib中,我们可以通过设置线型参数来绘制虚线。最常用的方法是在plot()函数中使用linestyle参数或其简写形式ls。
1.1 使用预定义的虚线样式
Matplotlib提供了几种预定义的虚线样式,如'--'(虚线)、':'(点线)和'-.'(点划线)。
import matplotlib.pyplot as plt

x = [1, 2, 3, 4, 5]
y = [2, 4, 6, 8, 10]

plt.figure(figsize=(10, 6))
plt.plot(x, y, linestyle='--', label='Dashed')
plt.plot(x, [y_val+1 for y_val in y], linestyle=':', label='Dotted')
plt.plot(x, [y_val+2 for y_val in y], linestyle='-.', label='Dash-dot')

plt.title('Different Dashed Line Styles in how2matplotlib.com')
plt.xlabel('X-axis')
plt.ylabel('Y-axis')
plt.legend()
plt.grid(True)
plt.show()
Output:
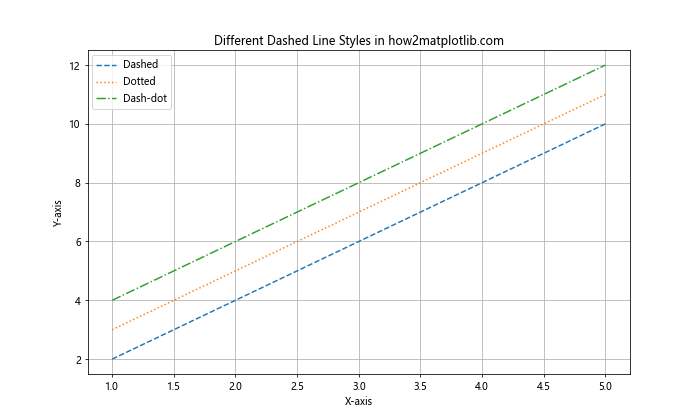
在这个例子中,我们绘制了三条不同样式的虚线。'--'表示常规虚线,':'表示点线,'-.'表示点划线。这些预定义的样式可以满足大多数基本需求。
1.2 使用元组定义自定义虚线样式
对于更精细的控制,我们可以使用元组来定义虚线的样式。元组中的数字表示线段和间隔的长度(以点为单位)。
import matplotlib.pyplot as plt

x = [1, 2, 3, 4, 5]
y = [2, 4, 6, 8, 10]

plt.figure(figsize=(10, 6))
plt.plot(x, y, linestyle=(0, (5, 5)), label='Equal dash and space')
plt.plot(x, [y_val+1 for y_val in y], linestyle=(0, (5, 2, 1, 2)), label='Dash-dot-dash')
plt.plot(x, [y_val+2 for y_val in y], linestyle=(0, (3, 1, 1, 1, 1, 1)), label='Custom pattern')

plt.title('Custom Dashed Line Styles in how2matplotlib.com')
plt.xlabel('X-axis')
plt.ylabel('Y-axis')
plt.legend()
plt.grid(True)
plt.show()
Output:
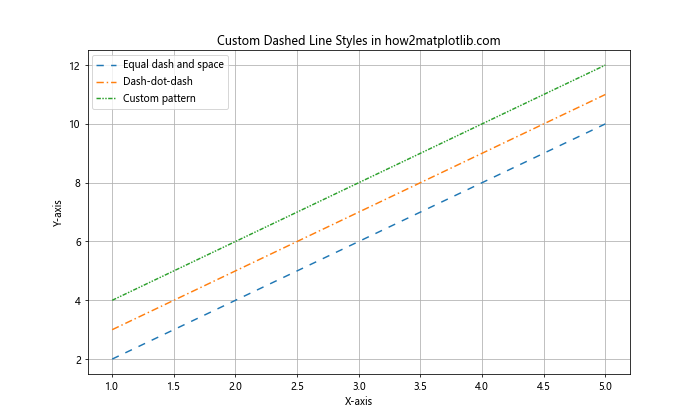
在这个例子中,我们使用元组定义了三种不同的虚线样式:
– (0, (5, 5)): 表示线段和间隔都是5个点长。
– (0, (5, 2, 1, 2)): 表示一个5点长的线段,2点间隔,1点长的点,再2点间隔。
– (0, (3, 1, 1, 1, 1, 1)): 表示一个更复杂的模式,3点线段后跟随多个1点长的线段和间隔。
2. 控制虚线间距
虚线的间距控制是实现各种视觉效果的关键。我们可以通过调整线段和间隔的长度来实现不同的间距效果。
2.1 调整虚线的密度
通过改变线段和间隔的长度,我们可以调整虚线的密度。
import matplotlib.pyplot as plt

x = [1, 2, 3, 4, 5]
y = [2, 4, 6, 8, 10]

plt.figure(figsize=(10, 6))
plt.plot(x, y, linestyle=(0, (1, 1)), label='Dense')
plt.plot(x, [y_val+1 for y_val in y], linestyle=(0, (5, 5)), label='Medium')
plt.plot(x, [y_val+2 for y_val in y], linestyle=(0, (10, 10)), label='Sparse')

plt.title('Dashed Lines with Different Densities in how2matplotlib.com')
plt.xlabel('X-axis')
plt.ylabel('Y-axis')
plt.legend()
plt.grid(True)
plt.show()
Output:
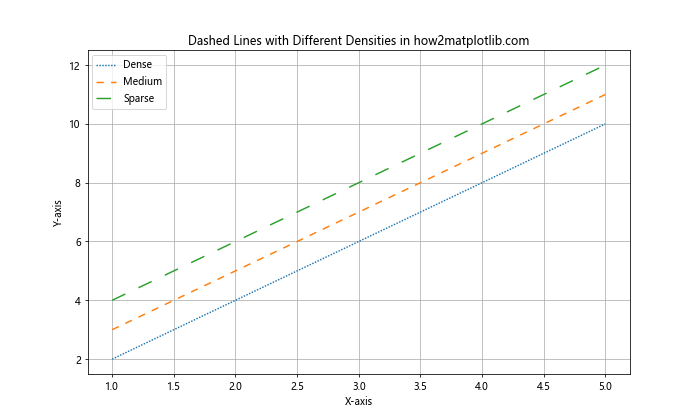
在这个例子中,我们展示了三种不同密度的虚线:
– (0, (1, 1)): 非常密集的虚线。
– (0, (5, 5)): 中等密度的虚线。
– (0, (10, 10)): 稀疏的虚线。
2.2 创建不对称的虚线模式
我们还可以创建不对称的虚线模式,通过设置不同的线段和间隔长度。
import matplotlib.pyplot as plt

x = [1, 2, 3, 4, 5]
y = [2, 4, 6, 8, 10]

plt.figure(figsize=(10, 6))
plt.plot(x, y, linestyle=(0, (5, 2)), label='Long dash, short space')
plt.plot(x, [y_val+1 for y_val in y], linestyle=(0, (2, 5)), label='Short dash, long space')
plt.plot(x, [y_val+2 for y_val in y], linestyle=(0, (10, 2, 2, 2)), label='Long dash, multiple short spaces')

plt.title('Asymmetric Dashed Line Patterns in how2matplotlib.com')
plt.xlabel('X-axis')
plt.ylabel('Y-axis')
plt.legend()
plt.grid(True)
plt.show()
Output:
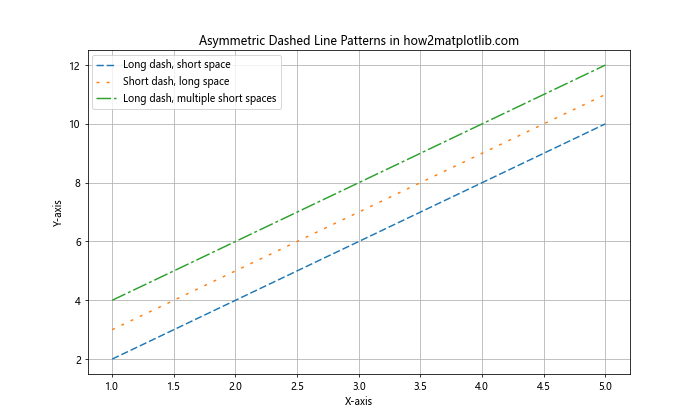
这个例子展示了三种不对称的虚线模式:
– (0, (5, 2)): 长线段,短间隔。
– (0, (2, 5)): 短线段,长间隔。
– (0, (10, 2, 2, 2)): 长线段后跟随多个短间隔。
3. 结合其他线条属性
虚线样式可以与其他线条属性结合使用,如颜色、线宽等,以创建更丰富的视觉效果。
3.1 结合颜色和线宽
import matplotlib.pyplot as plt

x = [1, 2, 3, 4, 5]
y = [2, 4, 6, 8, 10]

plt.figure(figsize=(10, 6))
plt.plot(x, y, linestyle=(0, (5, 5)), color='red', linewidth=2, label='Red, medium width')
plt.plot(x, [y_val+1 for y_val in y], linestyle=(0, (1, 1)), color='blue', linewidth=1, label='Blue, thin')
plt.plot(x, [y_val+2 for y_val in y], linestyle=(0, (10, 2, 2, 2)), color='green', linewidth=3, label='Green, thick')

plt.title('Dashed Lines with Different Colors and Widths in how2matplotlib.com')
plt.xlabel('X-axis')
plt.ylabel('Y-axis')
plt.legend()
plt.grid(True)
plt.show()
Output:
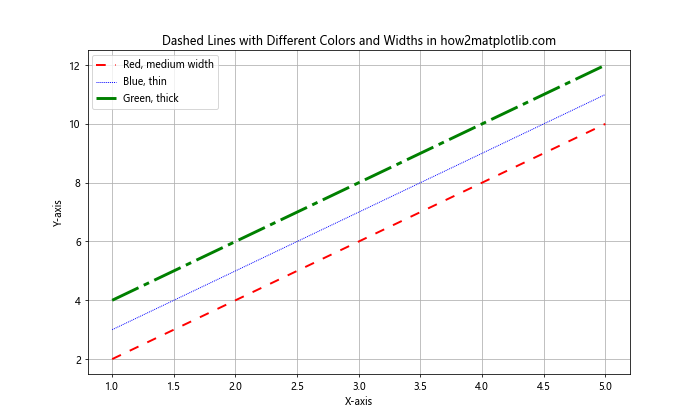
在这个例子中,我们结合了不同的虚线样式、颜色和线宽:
– 红色中等宽度的常规虚线。
– 蓝色细密虚线。
– 绿色粗线的复杂虚线模式。
3.2 使用透明度
透明度可以用来创建更微妙的视觉效果,特别是当多条线重叠时。
import matplotlib.pyplot as plt

x = [1, 2, 3, 4, 5]
y = [2, 4, 6, 8, 10]

plt.figure(figsize=(10, 6))
plt.plot(x, y, linestyle=(0, (5, 5)), color='red', alpha=0.7, label='Semi-transparent red')
plt.plot(x, y, linestyle=(0, (5, 2)), color='blue', alpha=0.5, label='More transparent blue')
plt.plot(x, y, linestyle=(0, (10, 2, 2, 2)), color='green', alpha=0.3, label='Very transparent green')

plt.title('Dashed Lines with Different Transparencies in how2matplotlib.com')
plt.xlabel('X-axis')
plt.ylabel('Y-axis')
plt.legend()
plt.grid(True)
plt.show()
Output:
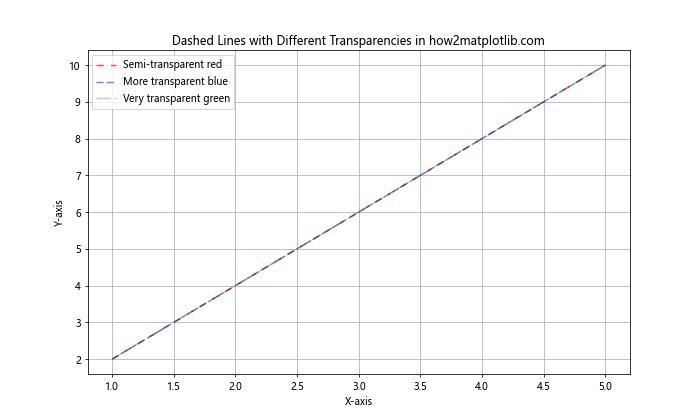
这个例子展示了如何使用alpha参数来设置线条的透明度:
– 红色线条有70%的不透明度。
– 蓝色线条有50%的不透明度。
– 绿色线条有30%的不透明度。
4. 在不同类型的图表中使用虚线
虚线不仅可以用于简单的线图,还可以应用于其他类型的图表,如散点图、条形图等。
4.1 在散点图中使用虚线连接点
import matplotlib.pyplot as plt
import numpy as np

x = np.linspace(0, 10, 10)
y1 = np.sin(x)
y2 = np.cos(x)

plt.figure(figsize=(10, 6))
plt.scatter(x, y1, color='red', label='Sin points')
plt.scatter(x, y2, color='blue', label='Cos points')
plt.plot(x, y1, linestyle=(0, (5, 5)), color='red', alpha=0.5)
plt.plot(x, y2, linestyle=(0, (1, 1)), color='blue', alpha=0.5)

plt.title('Scatter Plot with Dashed Lines in how2matplotlib.com')
plt.xlabel('X-axis')
plt.ylabel('Y-axis')
plt.legend()
plt.grid(True)
plt.show()
Output:
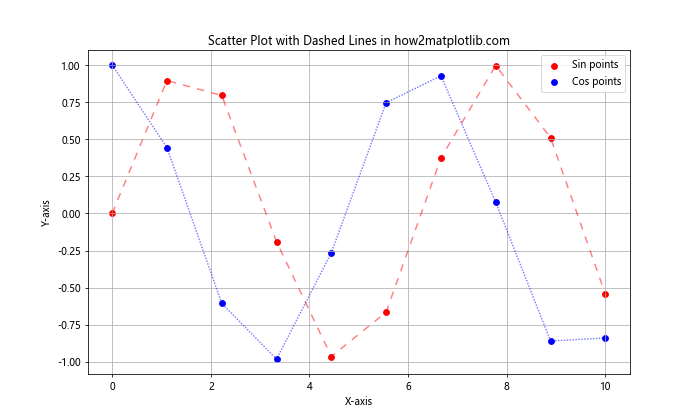
在这个例子中,我们创建了一个散点图,并使用虚线连接点:
– 红色点表示正弦函数,用中等密度的虚线连接。
– 蓝色点表示余弦函数,用密集的虚线连接。
4.2 在条形图中使用虚线标记
import matplotlib.pyplot as plt
import numpy as np

categories = ['A', 'B', 'C', 'D', 'E']
values = [3, 7, 2, 5, 8]

plt.figure(figsize=(10, 6))
bars = plt.bar(categories, values)

# 添加平均值线
mean_value = np.mean(values)
plt.axhline(y=mean_value, linestyle=(0, (5, 5)), color='red', label='Mean')

# 添加最大值和最小值线
max_value = max(values)
min_value = min(values)
plt.axhline(y=max_value, linestyle=(0, (1, 1)), color='green', label='Max')
plt.axhline(y=min_value, linestyle=(0, (10, 2, 2, 2)), color='blue', label='Min')

plt.title('Bar Chart with Dashed Lines in how2matplotlib.com')
plt.xlabel('Categories')
plt.ylabel('Values')
plt.legend()
plt.show()
Output:
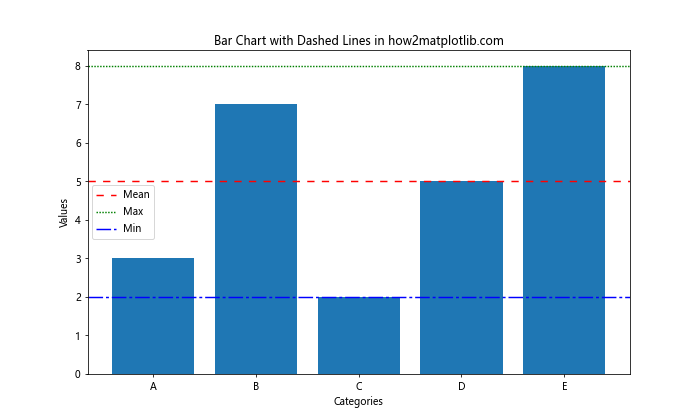
这个例子展示了如何在条形图中使用虚线来标记重要的统计信息:
– 红色虚线表示平均值。
– 绿色密集虚线表示最大值。
– 蓝色复杂虚线表示最小值。
5. 动态调整虚线样式
在某些情况下,我们可能需要根据数据动态调整虚线的样式。这可以通过编程方式实现。
5.1 基于数据值调整虚线密度
import matplotlib.pyplot as plt
import numpy as np

x = np.linspace(0, 10, 100)
y = np.sin(x)

plt.figure(figsize=(10, 6))

for i in range(len(x)-1):
    # 根据y值动态调整虚线密度
    dash_density = int(5 * (1 + y[i]))
    plt.plot(x[i:i+2], y[i:i+2], linestyle=(0, (dash_density, dash_density)), color='blue')

plt.title('Dynamic Dashed Line Density in how2matplotlib.com')
plt.xlabel('X-axis')
plt.ylabel('Y-axis')
plt.grid(True)
plt.show()
在这个例子中,我们根据y值动态调整虚线的密度:
– y值越大,虚线越稀疏。
– y值越小,虚线越密集。
5.2 使用不同虚线样式表示数据范围
import matplotlib.pyplot as plt
import numpy as np

x = np.linspace(0, 10, 100)
y = np.sin(x)

plt.figure(figsize=(10, 6))

for i in range(len(x)-1):
    if y[i] > 0.5:
        linestyle = (0, (5, 2))  # 长虚线
    elif y[i] < -0.5:
        linestyle = (0, (1, 1))  # 短虚线
    else:
        linestyle = '-'  # 实线

    plt.plot(x[i:i+2], y[i:i+2], linestyle=linestyle, color='blue')

plt.title('Different Line Styles Based on Y-value in how2matplotlib.com')
plt.xlabel('X-axis')
plt.ylabel('Y-axis')
plt.grid(True)
plt.show()
Output:
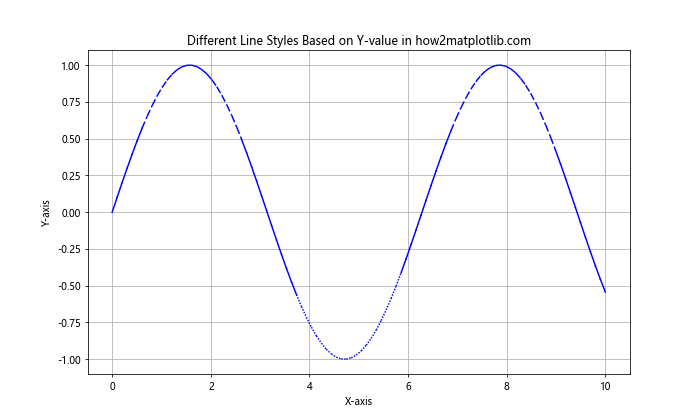
这个例子展示了如何根据y值的范围使用不同的线型:
– y > 0.5 时使用长虚线。
– y < -0.5 时使用短虚线。
– -0.5 ≤ y ≤ 0.5 时使用实线。
6. 在多子图中使用虚线
当我们需要在一个图形中展示多个相关但独立的数据集时,使用子图是一个很好的选择。我们可以在每个子图中使用不同的虚线样式来区分数据。
6.1 创建具有不同虚线样式的子图
import matplotlib.pyplot as plt
import numpy as np

x = np.linspace(0, 10, 100)
y1 = np.sin(x)
y2 = np.cos(x)
y3 = np.tan(x)

fig, (ax1, ax2, ax3) = plt.subplots(3, 1, figsize=(10, 12))

ax1.plot(x, y1, linestyle=(0, (5, 5)), label='Sin')
ax1.set_title('Sine Wave in how2matplotlib.com')
ax1.legend()

ax2.plot(x, y2, linestyle=(0, (1, 1)), label='Cos')
ax2.set_title('Cosine Wave in how2matplotlib.com')
ax2.legend()

ax3.plot(x, y3, linestyle=(0, (3, 1, 1, 1)), label='Tan')
ax3.set_title('Tangent Wave in how2matplotlib.com')
ax3.legend()

plt.tight_layout()
plt.show()
Output:
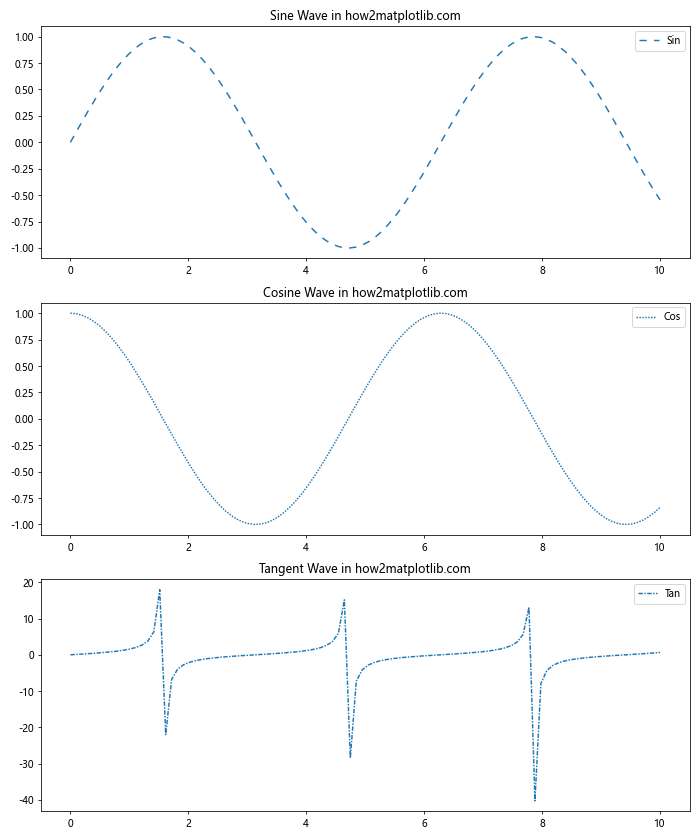
在这个例子中,我们创建了三个子图,每个子图使用不同的虚线样式:
– 正弦波使用中等密度的虚线。
– 余弦波使用密集的虚线。
– 正切波使用点划线样式。
6.2 在同一子图中比较不同虚线样式
import matplotlib.pyplot as plt
import numpy as np

x = np.linspace(0, 10, 100)
y1 = np.sin(x)
y2 = np.sin(x + np.pi/4)
y3 = np.sin(x + np.pi/2)

fig, (ax1, ax2) = plt.subplots(2, 1, figsize=(10, 10))

ax1.plot(x, y1, linestyle=(0, (5, 5)), label='Sin(x)')
ax1.plot(x, y2, linestyle=(0, (1, 1)), label='Sin(x + π/4)')
ax1.plot(x, y3, linestyle=(0, (3, 1, 1, 1)), label='Sin(x + π/2)')
ax1.set_title('Comparison of Sine Waves in how2matplotlib.com')
ax1.legend()

ax2.plot(x, y1, linestyle=(0, (5, 2)), label='Sin(x)')
ax2.plot(x, y2, linestyle=(0, (3, 1, 1, 1)), label='Sin(x + π/4)')
ax2.plot(x, y3, linestyle=(0, (1, 1)), label='Sin(x + π/2)')
ax2.set_title('Alternative Dashed Styles in how2matplotlib.com')
ax2.legend()

plt.tight_layout()
plt.show()
Output:
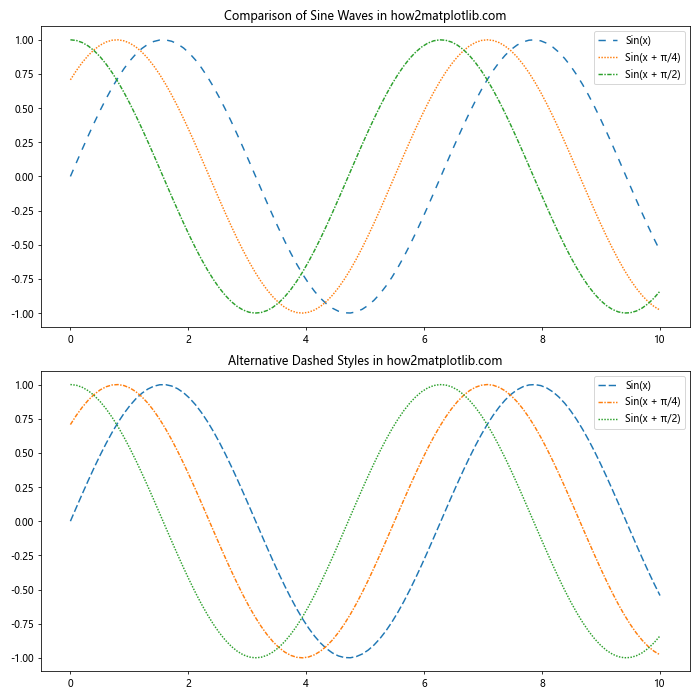
这个例子展示了如何在同一子图中使用不同的虚线样式来比较多个相关的数据集:
– 第一个子图使用三种不同的虚线样式来区分三个正弦波。
– 第二个子图使用不同的虚线样式组合来展示同样的数据。
7. 自定义虚线样式的高级技巧
除了基本的虚线样式设置,Matplotlib还提供了一些高级技巧来创建更复杂和独特的虚线效果。
7.1 使用破折号序列创建复杂模式
import matplotlib.pyplot as plt
import numpy as np

x = np.linspace(0, 10, 100)
y = np.sin(x)

plt.figure(figsize=(10, 6))
plt.plot(x, y, linestyle=(0, (5, 2, 1, 2, 1, 2)), label='Complex pattern')
plt.plot(x, y + 1, linestyle=(0, (3, 1, 1, 1, 1, 1)), label='Dot-dash pattern')
plt.plot(x, y - 1, linestyle=(0, (1, 10)), label='Sparse dots')

plt.title('Advanced Dashed Line Patterns in how2matplotlib.com')
plt.xlabel('X-axis')
plt.ylabel('Y-axis')
plt.legend()
plt.grid(True)
plt.show()
Output:
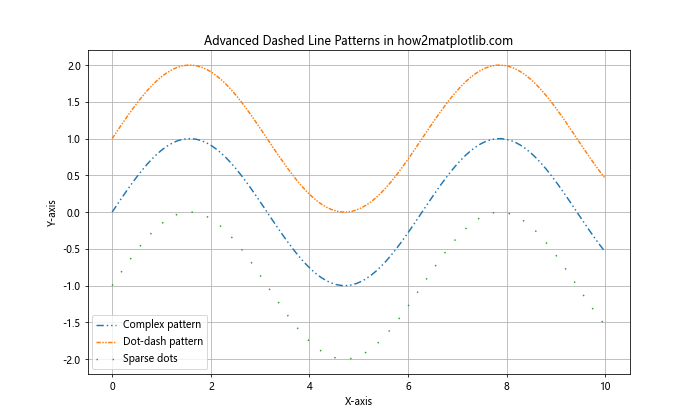
这个例子展示了如何创建更复杂的虚线模式:
– 第一条线使用了一个复杂的重复模式。
– 第二条线创建了一个点划线模式。
– 第三条线创建了一个稀疏的点线模式。
7.2 使用自定义破折号样式函数
import matplotlib.pyplot as plt
import numpy as np

def custom_dash_style(i):
    return (0, (i, i, 1, i))

x = np.linspace(0, 10, 100)
y = np.sin(x)

plt.figure(figsize=(10, 6))

for i in range(1, 6):
    plt.plot(x, y + i*0.2, linestyle=custom_dash_style(i), label=f'Style {i}')

plt.title('Custom Dash Styles Using Function in how2matplotlib.com')
plt.xlabel('X-axis')
plt.ylabel('Y-axis')
plt.legend()
plt.grid(True)
plt.show()
Output:
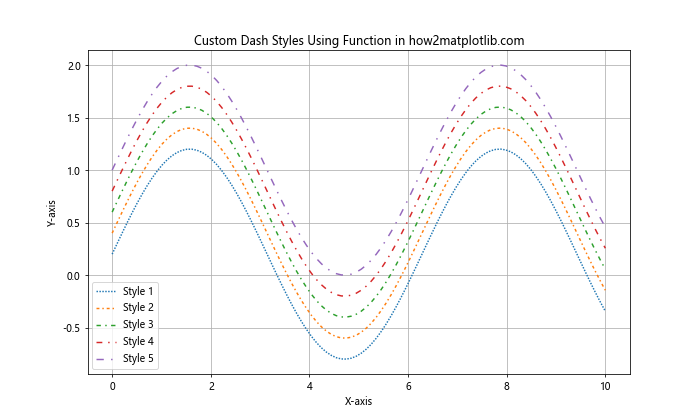
在这个例子中,我们定义了一个自定义函数来生成虚线样式:
– 函数custom_dash_style根据输入参数生成不同的虚线样式。
– 我们使用循环创建了5条不同样式的线,每条线的样式都是由函数动态生成的。
8. 在实际应用中使用虚线
虚线在许多实际应用中都有重要作用,例如在金融图表、科学数据可视化和工程图表中。让我们看几个实际应用的例子。
8.1 金融数据中的趋势线和支撑/阻力线
import matplotlib.pyplot as plt
import numpy as np

# 模拟股票价格数据
dates = np.arange('2023-01-01', '2023-12-31', dtype='datetime64[D]')
prices = 100 + np.cumsum(np.random.randn(len(dates)) * 2)

plt.figure(figsize=(12, 6))
plt.plot(dates, prices, label='Stock Price')

# 添加趋势线
trend_start = prices[0]
trend_end = prices[-1]
plt.plot([dates[0], dates[-1]], [trend_start, trend_end], linestyle=(0, (5, 5)), color='red', label='Trend Line')

# 添加支撑线和阻力线
support = np.percentile(prices, 10)
resistance = np.percentile(prices, 90)
plt.axhline(y=support, linestyle=(0, (1, 1)), color='green', label='Support')
plt.axhline(y=resistance, linestyle=(0, (3, 1, 1, 1)), color='orange', label='Resistance')

plt.title('Stock Price with Trend, Support and Resistance Lines in how2matplotlib.com')
plt.xlabel('Date')
plt.ylabel('Price')
plt.legend()
plt.grid(True)
plt.show()
Output:
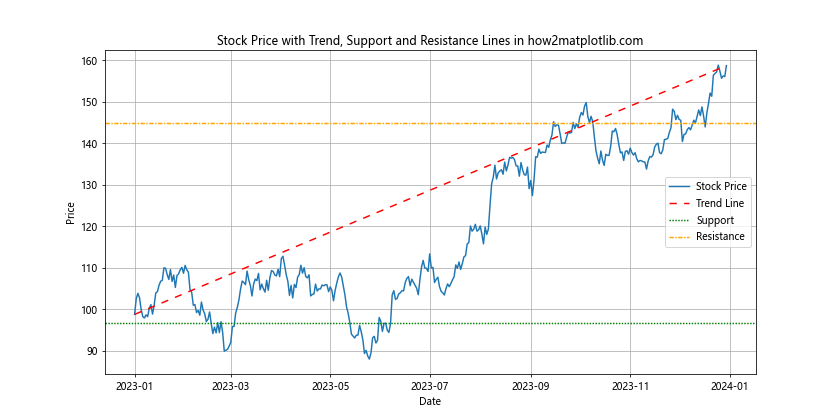
这个例子展示了如何在金融图表中使用虚线:
– 实线表示股票价格。
– 红色虚线表示整体趋势。
– 绿色点线表示支撑线。
– 橙色点划线表示阻力线。
8.2 科学数据中的误差范围
import matplotlib.pyplot as plt
import numpy as np

x = np.linspace(0, 10, 50)
y = np.sin(x) + np.random.normal(0, 0.1, 50)
y_error = np.random.uniform(0.1, 0.2, 50)

plt.figure(figsize=(12, 6))
plt.errorbar(x, y, yerr=y_error, fmt='o', capsize=5, label='Data points')

# 添加拟合曲线
fit = np.polyfit(x, y, 2)
fit_fn = np.poly1d(fit)
plt.plot(x, fit_fn(x), 'r-', label='Fit curve')

# 添加置信区间
plt.fill_between(x, fit_fn(x) - y_error, fit_fn(x) + y_error,
                 alpha=0.2, linestyle=(0, (5, 5)), edgecolor='b', facecolor='b',
                 label='Confidence interval')

plt.title('Scientific Data with Error Ranges in how2matplotlib.com')
plt.xlabel('X-axis')
plt.ylabel('Y-axis')
plt.legend()
plt.grid(True)
plt.show()
Output:
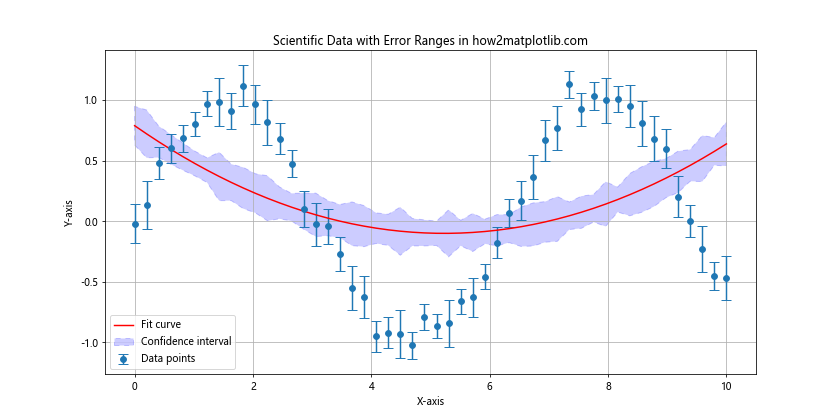
这个例子展示了如何在科学数据可视化中使用虚线:
– 实心圆点和误差棒表示数据点及其误差范围。
– 红色实线表示拟合曲线。
– 蓝色半透明区域with虚线边界表示置信区间。
9. 虚线在动画中的应用
虚线不仅可以用于静态图表,还可以在动画中创造有趣的视觉效果。
9.1 创建移动的虚线动画
import matplotlib.pyplot as plt
import matplotlib.animation as animation
import numpy as np

fig, ax = plt.subplots(figsize=(10, 6))

x = np.linspace(0, 10, 1000)
line, = ax.plot(x, np.sin(x), linestyle=(0, (5, 5)))

def animate(i):
    line.set_ydata(np.sin(x + i/10))
    line.set_linestyle((0, (5, 5, i % 5, 5)))  # 动态改变虚线样式
    return line,

ani = animation.FuncAnimation(fig, animate, frames=200, interval=50, blit=True)

plt.title('Animated Dashed Line in how2matplotlib.com')
plt.xlabel('X-axis')
plt.ylabel('Y-axis')
plt.show()
Output:
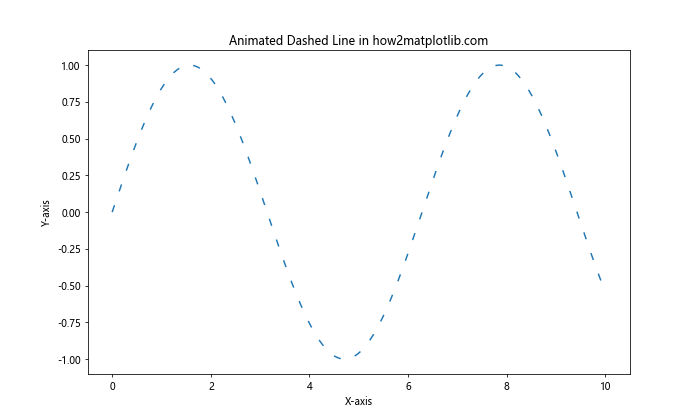
这个例子创建了一个动画,其中:
– 正弦波随时间移动。
– 虚线的样式也随时间动态变化。
注意:由于这是一个动画示例,你需要在支持动画显示的环境中运行它才能看到效果。
10. 总结
通过本文的详细介绍,我们深入探讨了Matplotlib中虚线的绘制方法和间距控制技巧。从基本的虚线样式到复杂的自定义模式,从静态图表到动态动画,我们涵盖了广泛的应用场景和技术。
虚线作为一种重要的视觉元素,在数据可视化中扮演着关键角色。它们可以用来:
– 区分不同的数据系列
– 强调特定的信息或趋势
– 表示预测或不确定的数据
– 创建视觉上吸引人的图表设计
通过灵活运用虚线样式、颜色、透明度等属性,我们可以创建出既信息丰富又美观的图表。在实际应用中,选择合适的虚线样式可以大大提高数据的可读性和图表的整体效果。
最后,记住虚线的使用应该服务于数据的清晰表达。过度复杂的虚线样式可能会分散读者对核心信息的注意力。因此,在设计图表时,应始终保持简洁和目的性,使用虚线来增强而不是混淆你想要传达的信息。
通过掌握本文介绍的技巧,你将能够在Matplotlib中创建出更加专业和富有表现力的数据可视化作品。
 极客教程
极客教程