matplotlib barplot
Matplotlib 是一个用于创建数据可视化的 Python 库。在数据分析和科学研究中,绘制柱状图(barplot)是一种常用的方式来展示数据分布情况和比较不同类别的数据。本文将介绍如何使用 Matplotlib 创建柱状图,并提供详细的示例代码。
基本柱状图
首先,我们来看一个简单的柱状图示例。在这个示例中,我们将绘制两组数据的柱状图,分别代表不同类别的数据。
import matplotlib.pyplot as plt

# 数据
categories = ['A', 'B', 'C', 'D', 'E']
values1 = [10, 20, 15, 25, 30]
values2 = [15, 25, 20, 30, 35]

# 创建柱状图
plt.bar(categories, values1, label='Group 1')
plt.bar(categories, values2, label='Group 2', alpha=0.5)

# 添加标签
plt.xlabel('Categories')
plt.ylabel('Values')
plt.title('Barplot Example')
plt.legend()

# 显示图形
plt.show()
Output:
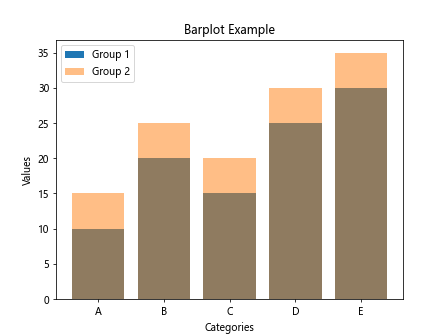
在上面的示例代码中,我们使用 plt.bar() 函数创建柱状图,分别绘制两组数据的柱状图,并使用 plt.legend() 添加图例。运行以上代码,可以得到如下图所示的柱状图:
堆叠柱状图
堆叠柱状图是一种将多组数据叠加在一起展示的柱状图类型。下面是一个堆叠柱状图的示例代码:
import matplotlib.pyplot as plt

# 数据
categories = ['A', 'B', 'C', 'D', 'E']
values1 = [10, 20, 15, 25, 30]
values2 = [15, 25, 20, 30, 35]

# 创建堆叠柱状图
plt.bar(categories, values1, label='Group 1')
plt.bar(categories, values2, bottom=values1, label='Group 2')

# 添加标签
plt.xlabel('Categories')
plt.ylabel('Values')
plt.title('Stacked Barplot Example')
plt.legend()

# 显示图形
plt.show()
Output:
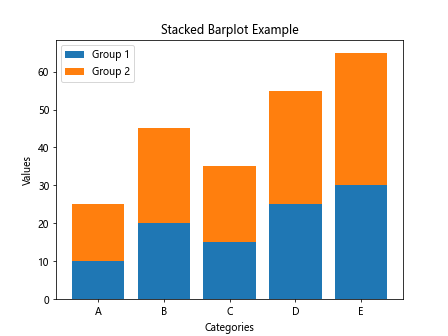
上面的示例代码中,我们使用 plt.bar() 函数创建堆叠柱状图,通过 bottom 参数指定第二组数据相对于第一组数据的位置。运行以上代码,可以得到堆叠柱状图。
横向柱状图
除了垂直柱状图外,Matplotlib 还支持绘制横向柱状图。下面是一个横向柱状图的示例代码:
import matplotlib.pyplot as plt

# 数据
categories = ['A', 'B', 'C', 'D', 'E']
values = [10, 20, 15, 25, 30]

# 创建横向柱状图
plt.barh(categories, values)

# 添加标签
plt.xlabel('Values')
plt.ylabel('Categories')
plt.title('Horizontal Barplot Example')

# 显示图形
plt.show()
Output:
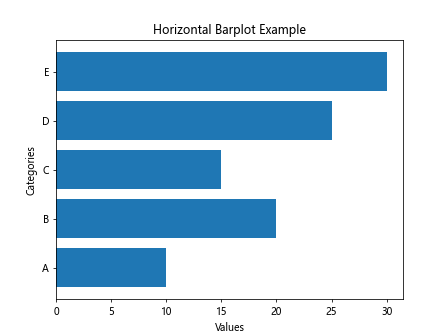
在上面的示例代码中,我们使用 plt.barh() 函数创建横向柱状图,横向柱状图更加适合展示长标签或者需要比较的数据。运行以上代码,可以得到横向柱状图。
柱状图属性设置
通过设置柱状图的属性,可以自定义柱状图的外观和样式。下面是一个示例代码,展示如何设置柱状图的颜色、宽度和透明度:
import matplotlib.pyplot as plt

# 数据
categories = ['A', 'B', 'C', 'D', 'E']
values = [10, 20, 15, 25, 30]

# 创建柱状图
plt.bar(categories, values, color='skyblue', width=0.5, alpha=0.7)

# 添加标签
plt.xlabel('Categories')
plt.ylabel('Values')
plt.title('Customized Barplot Example')

# 显示图形
plt.show()
Output:
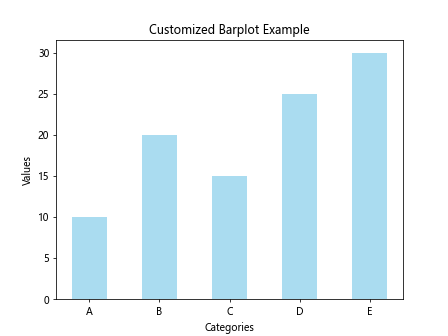
在上面的示例代码中,我们使用了 color 参数设置柱状图的颜色,width 参数设置柱状图的宽度,alpha 参数设置柱状图的透明度。通过设置这些属性,可以让柱状图更加美观。
柱状图标签
有时候,在柱状图上显示数据值可以更加直观地展示数据的情况。下面是一个示例代码,展示如何在柱状图上添加数据标签:
import matplotlib.pyplot as plt

# 数据
categories = ['A', 'B', 'C', 'D', 'E']
values = [10, 20, 15, 25, 30]

# 创建柱状图
bars = plt.bar(categories, values)

# 添加数据标签
for bar in bars:
    plt.text(bar.get_x() + bar.get_width()/2, bar.get_height(), bar.get_height(), ha='center', va='bottom')

# 添加标签
plt.xlabel('Categories')
plt.ylabel('Values')
plt.title('Barplot with Data Labels')

# 显示图形
plt.show()
Output:
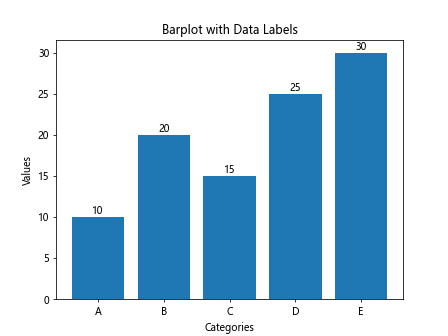
在上面的示例代码中,我们首先创建柱状图,然后使用 plt.text() 函数在柱状图上添加数据标签。通过 bar.get_x() 和 bar.get_width() 获取柱状图的位置和宽度,然后将数据值添加到柱状图上。运行以上代码,可以看到带有数据标签的柱状图。
多组柱状图
有时候需要在同一个图中展示多组柱状图,以进行比较。下面是一个示例代码,展示如何在同一个图中绘制多组柱状图:
import matplotlib.pyplot as plt

# 数据
categories = ['A', 'B', 'C', 'D', 'E']
values1 = [10, 20, 15, 25, 30]
values2 = [15, 25, 20, 30, 35]

# 创建多组柱状图
bar_width = 0.35
plt.bar([x - bar_width/2 for x in range(len(categories))], values1, width=bar_width, label='Group 1')
plt.bar([x + bar_width/2 for x in range(len(categories))], values2, width=bar_width, label='Group 2')

# 添加标签
plt.xlabel('Categories')
plt.ylabel('Values')
plt.title('Multiple Barplot Example')
plt.legend()

# 显示图形
plt.show()
Output:
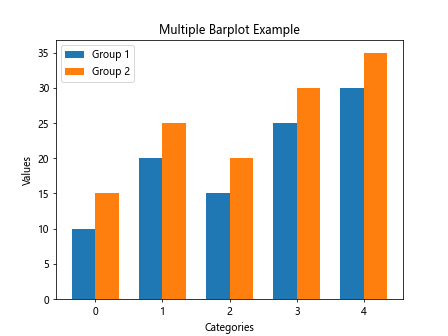
在上面的示例代码中,我们通过调整柱状图的位置和宽度,实现在同一个图中绘制多组柱状图。运行以上代码,可以看到多组柱状图的效果。
柱状图颜色映射
利用颜色映射(colormap),可以根据数据值的大小对柱状图进行着色,更直观地展示数据分布。下面是一个示例代码,展示如何使用颜色映射创建柱状图:
import matplotlib.pyplot as plt
import numpy as np

# 数据
categories = ['A', 'B', 'C', 'D', 'E']
values = [10, 20, 15, 25, 30]
colors = np.array(values)

# 创建柱状图
bars = plt.bar(categories, values, color=plt.cm.viridis(colors/30))

# 添加标签
plt.xlabel('Categories')
plt.ylabel('Values')
plt.title('Barplot with Color Mapping')

# 显示图例
plt.colorbar(bars)

# 显示图形
plt.show()
在上面的示例代码中,我们使用 plt.cm.viridis 颜色映射和数据值的大小来着色柱状图。通过调整颜色映射和数据值的范围,可以展示出数据的分布情况。运行以上代码,可以看到颜色映射的柱状图。
水平堆叠柱状图
除了垂直堆叠柱状图外,Matplotlib 也支持绘制水平堆叠柱状图。下面是一个示例代码,展示如何创建水平堆叠柱状图:
import matplotlib.pyplot as plt

# 数据
categories = ['A', 'B', 'C', 'D', 'E']
values1 = [10, 20, 15, 25, 30]
values2 = [15, 25, 20, 30, 35]

# 创建水平堆叠柱状图
plt.barh(categories, values1, label='Group 1')
plt.barh(categories, values2, left=values1, label='Group 2')

# 添加标签
plt.xlabel('Values')
plt.ylabel('Categories')
plt.title('Horizontal Stacked Barplot Example')
plt.legend()

# 显示图形
plt.show()
Output:
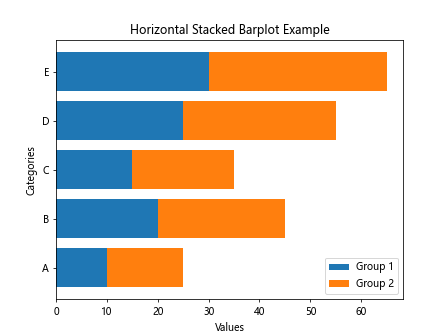
在上面的示例代码中,我们使用了 plt.barh() 函数创建水平堆叠柱状图,通过 left 参数指定第二组数据相对于第一组数据的位置。运行以上代码,可以得到水平堆叠柱状图。
分组柱状图
在某些情况下,需要将多组柱状图分组展示,以便更清晰地比较数据。下面是一个示例代码,展示如何创建分组柱状图:
import matplotlib.pyplot as plt

# 数据
categories = ['A', 'B', 'C', 'D', 'E']
values1 = [10, 20, 15, 25, 30]
values2 = [15, 25, 20, 30, 35]

# 创建分组柱状图
group_width = 0.4
plt.bar([x - group_width/2 for x in range(len(categories))], values1, width=group_width, label='Group 1')
plt.bar([x + group_width/2 for x in range(len(categories))], values2, width=group_width, label='Group 2')

# 添加标签
plt.xlabel('Categories')
plt.ylabel('Values')
plt.title('Grouped Barplot Example')
plt.legend()

# 显示图形
plt.show()
Output:
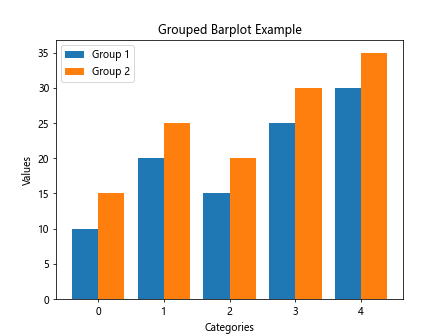
在上面的示例代码中,我们通过调整柱状图的位置和宽度,实现分组柱状图的展示。运行以上代码,可以看到分组柱状图的效果。
自定义柱状图风格
除了默认的风格外,Matplotlib 还支持自定义柱状图的风格,包括边框样式、填充样式等。下面是一个示例代码,展示如何自定义柱状图的风格:
import matplotlib.pyplot as plt

# 数据
categories = ['A', 'B', 'C', 'D', 'E']
values = [10, 20, 15, 25, 30]

# 创建柱状图
bars = plt.bar(categories, values)

# 自定义柱状图边框
for bar in bars:
    bar.set_linewidth(2)
    bar.set_edgecolor('red')

# 自定义填充样式
patterns = ['/', 'O', '*', 'x', '.']
for bar, pattern in zip(bars, patterns):
    bar.set_hatch(pattern)

# 添加标签
plt.xlabel('Categories')
plt.ylabel('Values')
plt.title('Customized Barplot Style')

# 显示图形
plt.show()
Output:
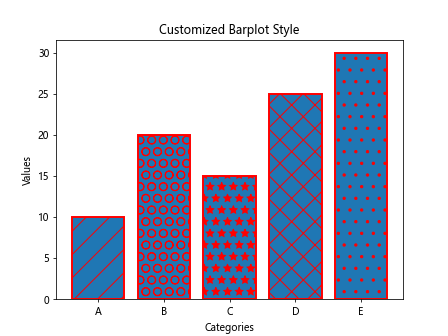
在上面的示例代码中,我们通过设置 bar.set_linewidth() 和 bar.set_edgecolor() 自定义柱状图的边框,通过设置 bar.set_hatch() 自定义填充样式。通过调整这些属性,可以实现自定义柱状图的风格。
 极客教程
极客教程