Matplotlib柱状图
Matplotlib是一个开源的Python绘图库,可用于创建各种类型的图表,包括柱状图。柱状图是一种用矩形条表示数据的图表,通常用于比较不同组数据的大小或显示数据的趋势。在本文中,我们将探讨如何使用Matplotlib创建和定制柱状图。
1. 安装Matplotlib
首先,确保你已经安装了Matplotlib库。如果没有安装,可以使用以下命令来安装:
pip install matplotlib
2. 创建简单的柱状图
我们先来看一个简单的例子,创建一个表示不同水果销量的柱状图。
import matplotlib.pyplot as plt

# 水果种类
fruits = ['Apple', 'Banana', 'Orange', 'Grape', 'Mango']

# 水果销量
sales = [50, 30, 40, 60, 70]

plt.bar(fruits, sales)
plt.xlabel('Fruits')
plt.ylabel('Sales')
plt.title('Fruit Sales Bar Graph')
plt.show()
Output:
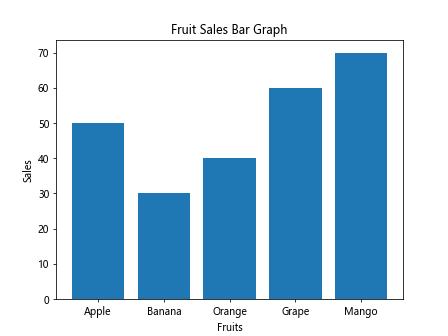
运行以上代码,你会得到一个简单的柱状图,显示了不同水果的销量。
3. 设置柱状图颜色和样式
你可以通过color参数设置柱状图的颜色,通过linestyle参数设置柱状图的线条样式。下面是一个例子:
import matplotlib.pyplot as plt

# 水果种类
fruits = ['Apple', 'Banana', 'Orange', 'Grape', 'Mango']

# 水果销量
sales = [50, 30, 40, 60, 70]

plt.bar(fruits, sales, color='skyblue', linestyle='--')
plt.xlabel('Fruits')
plt.ylabel('Sales')
plt.title('Fruit Sales Bar Graph')
plt.show()
Output:
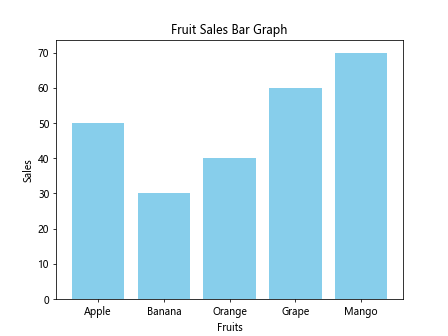
运行以上代码,你会看到柱状图的颜色变为天蓝色,并且线条样式为虚线。
4. 添加图例
如果柱状图包含多个数据组,你可以添加图例来区分不同数据组。下面是一个例子:
import matplotlib.pyplot as plt

# 水果种类
fruits = ['Apple', 'Banana', 'Orange', 'Grape', 'Mango']

# 月份
months = ['Jan', 'Feb', 'Mar', 'Apr', 'May']

# 不同水果每月销量
apple_sales = [30, 40, 50, 60, 70]
banana_sales = [20, 35, 45, 55, 65]

plt.bar(months, apple_sales, label='Apple')
plt.bar(months, banana_sales, label='Banana', bottom=apple_sales)

plt.xlabel('Months')
plt.ylabel('Sales')
plt.title('Fruit Sales Bar Graph')
plt.legend()
plt.show()
Output:
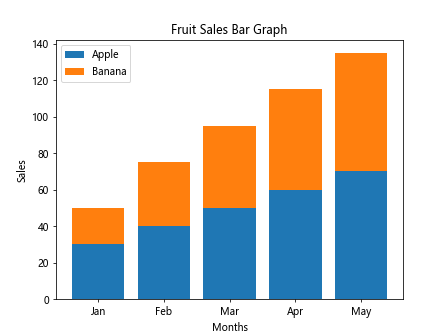
运行以上代码,你会看到柱状图中添加了图例,区分了苹果和香蕉的销量。
5. 定制坐标轴
你可以通过plt.xticks()方法和plt.yticks()方法来定制柱状图的坐标轴。下面是一个例子:
import matplotlib.pyplot as plt

# 水果种类
fruits = ['Apple', 'Banana', 'Orange', 'Grape', 'Mango']

# 水果销量
sales = [50, 30, 40, 60, 70]

plt.bar(fruits, sales)
plt.xlabel('Fruits')
plt.ylabel('Sales')
plt.title('Fruit Sales Bar Graph')
plt.xticks(rotation=45)
plt.yticks([0, 20, 40, 60, 80], ['0', '20', '40', '60', '80'])
plt.show()
Output:
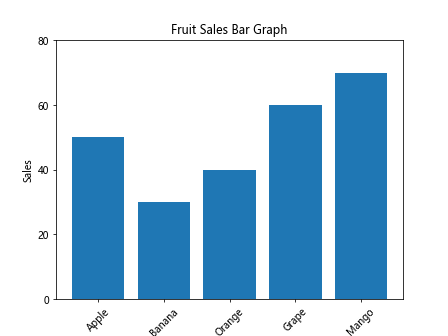
运行以上代码,你会看到柱状图的横坐标标签被旋转了45度,并且纵坐标只显示了特定的刻度值。
6. 改变柱状图宽度
你可以通过width参数来改变柱状图的宽度。下面是一个例子:
import matplotlib.pyplot as plt

# 水果种类
fruits = ['Apple', 'Banana', 'Orange', 'Grape', 'Mango']

# 水果销量
sales = [50, 30, 40, 60, 70]

plt.bar(fruits, sales, width=0.5)
plt.xlabel('Fruits')
plt.ylabel('Sales')
plt.title('Fruit Sales Bar Graph')
plt.show()
Output:
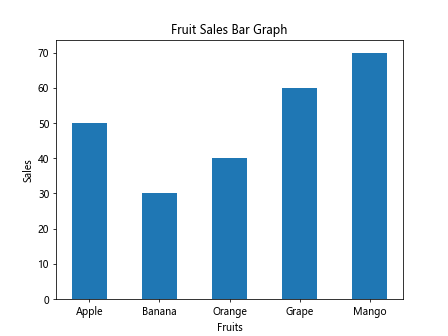
运行以上代码,你会看到柱状图的宽度被改变为0.5。
7. 堆叠柱状图
你可以通过bottom参数使柱状图堆叠显示。下面是一个例子:
import matplotlib.pyplot as plt

# 水果种类
fruits = ['Apple', 'Banana', 'Orange', 'Grape', 'Mango']

# 月份
months = ['Jan', 'Feb', 'Mar', 'Apr', 'May']

# 不同水果每月销量
apple_sales = [30, 40, 50, 60, 70]
banana_sales = [20, 35, 45, 55, 65]

plt.bar(months, apple_sales, label='Apple')
plt.bar(months, banana_sales, label='Banana', bottom=apple_sales)

plt.xlabel('Months')
plt.ylabel('Sales')
plt.title('Fruit Sales Bar Graph')
plt.legend()
plt.show()
Output:
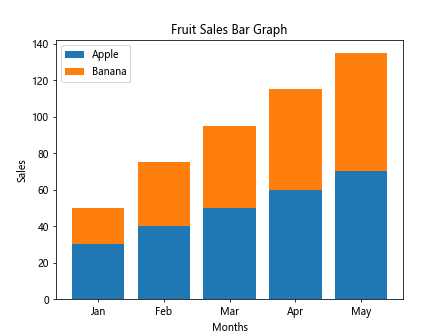
运行以上代码,你会看到柱状图中苹果和香蕉销量被堆叠显示。
8. 横向柱状图
你可以通过barh()方法创建横向柱状图。下面是一个例子:
import matplotlib.pyplot as plt

# 水果种类
fruits = ['Apple', 'Banana', 'Orange', 'Grape', 'Mango']

# 水果销量
sales = [50, 30, 40, 60, 70]

plt.barh(fruits, sales)
plt.xlabel('Sales')
plt.ylabel('Fruits')
plt.title('Fruit Sales Bar Graph')
plt.show()
Output:
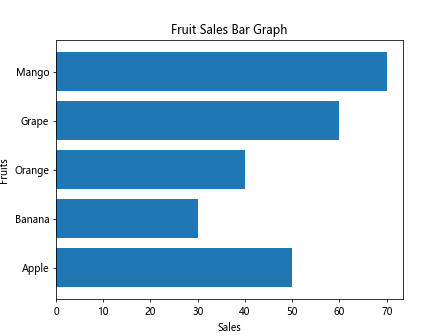
运行以上代码,你会看到一个横向柱状图,横轴为销量,纵轴为水果种类。
9. 带误差条的柱状图
你可以通过errorbar()方法创建带有误差条的柱状图。下面是一个例子:
import matplotlib.pyplot as plt

# 水果种类
fruits = ['Apple', 'Banana', 'Orange', 'Grape', 'Mango']

# 水果销量
sales = [50, 30, 40, 60, 70]

# 销量误差
errors = [5, 3, 4, 6, 7]

plt.bar(fruits, sales, yerr=errors, capsize=5)
plt.xlabel('Fruits')
plt.ylabel('Sales')
plt.title('Fruit Sales Bar Graph with Error Bars')
plt.show()
Output:
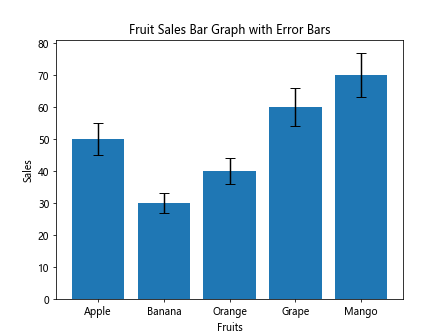
运行以上代码,你会看到柱状图中每根柱子都有误差条显示。
10. 渐变柱状图
你可以通过设置color参数为渐变色,创建渐变的柱状图。下面是一个例子:
import matplotlib.pyplot as plt

# 水果种类
fruits = ['Apple', 'Banana', 'Orange', 'Grape', 'Mango']

# 水果销量
sales = [50, 30, 40, 60, 70]

colors = ['red', 'green', 'blue', 'orange', 'purple']

plt.bar(fruits, sales, color=colors)
plt.xlabel('Fruits')
plt.ylabel('Sales')
plt.title('Gradient Color Bar Graph')
plt.show()
Output:
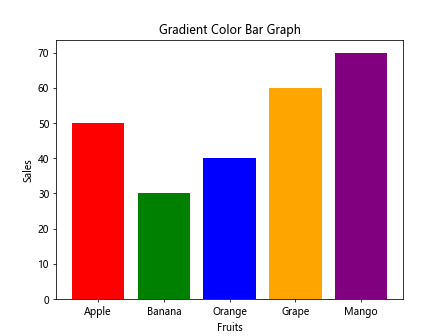
运行以上代码,你会看到柱状图中柱子的颜色为渐变色。
11. 堆叠带误差条的柱状图
你可以结合堆叠和带误差条的功能,创建堆叠的柱状图,并且每根柱子都有误差条。下面是一个例子:
import matplotlib.pyplot as plt

# 水果种类
fruits = ['Apple', 'Banana', 'Orange', 'Grape', 'Mango']

# 月份
months = ['Jan', 'Feb', 'Mar', 'Apr', 'May']

# 不同水果每月销量
apple_sales = [30, 40, 50, 60, 70]
banana_sales = [20, 35, 45, 55, 65]

apple_errors = [3, 4, 5, 6, 7]
banana_errors = [2, 3, 4, 5, 6]

plt.bar(months, apple_sales, yerr=apple_errors, label='Apple')
plt.bar(months, banana_sales, yerr=banana_errors, label='Banana', bottom=apple_sales)

plt.xlabel('Months')
plt.ylabel('Sales')
plt.title('Stacked Bar Graph with Error Bars')
plt.legend()
plt.show()
Output:
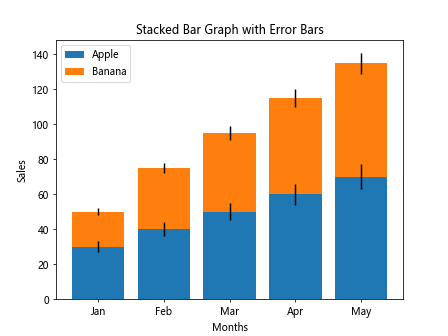
运行以上代码,你会看到堆叠的柱状图中每根柱子都有误差条。
12. 指定柱状图颜色
你可以为每个柱子指定不同的颜色,实现更多样化的柱状图。下面是一个例子:
import matplotlib.pyplot as plt

# 水果种类
fruits = ['Apple', 'Banana', 'Orange', 'Grape', 'Mango']

# 水果销量
sales = [50, 30, 40, 60, 70]

colors = ['red', 'green', 'blue', 'orange', 'purple']

plt.bar(fruits, sales, color=colors)
plt.xlabel('Fruits')
plt.ylabel('Sales')
plt.title('Custom Color Bar Graph')
plt.show()
Output:
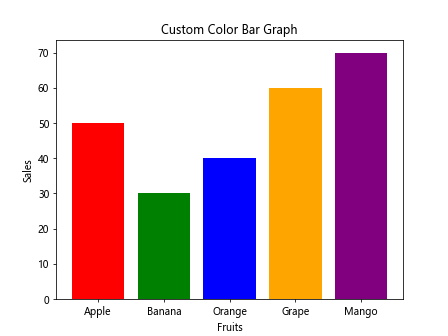
运行以上代码,你会看到柱状图中每个柱子的颜色都不相同。
13. 柱状图加标签
你可以在柱状图上方添加文本标签,显示柱子所代表的数值。下面是一个例子:
import matplotlib.pyplot as plt

# 水果种类
fruits = ['Apple', 'Banana', 'Orange', 'Grape', 'Mango']

# 水果销量
sales = [50, 30, 40, 60, 70]

for i in range(len(fruits)):
    plt.text(i, sales[i]+1, str(sales[i]), ha='center')

plt.bar(fruits, sales)
plt.xlabel('Fruits')
plt.ylabel('Sales')
plt.title('Bar Graph with Data Labels')
plt.show()
Output:
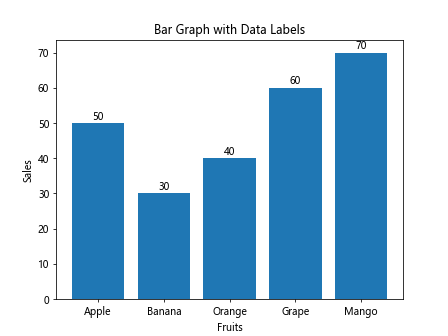
运行以上代码,你会看到柱状图上方显示了每个柱子所代表的数值。
14. 柱状图加注释
你可以使用annotate()方法在柱状图上添加注释。下面是一个例子:
import matplotlib.pyplot as plt

# 水果种类
fruits = ['Apple', 'Banana', 'Orange', 'Grape', 'Mango']

# 水果销量
sales = [50, 30, 40, 60, 70]

for i in range(len(fruits)):
    plt.annotate(str(sales[i]), (i, sales[i]), textcoords="offset points", xytext=(0,5), ha='center')

plt.bar(fruits, sales)
plt.xlabel('Fruits')
plt.ylabel('Sales')
plt.title('Bar Graph with Annotations')
plt.show()
Output:
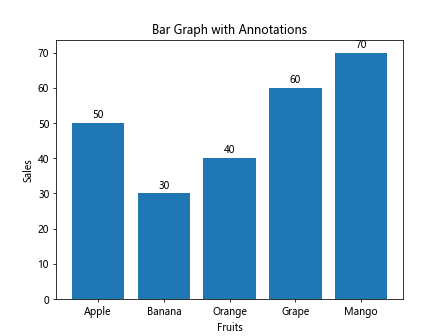
运行以上代码,你会看到柱状图中每个柱子上方显示了销量的注释。
15. 柱状图添加阴影
你可以使用shadow参数为柱状图添加阴影效果。下面是一个例子:
import matplotlib.pyplot as plt

# 水果种类
fruits = ['Apple', 'Banana', 'Orange', 'Grape', 'Mango']

# 水果销量
sales = [50, 30, 40, 60, 70]

plt.bar(fruits, sales, shadow=True)
plt.xlabel('Fruits')
plt.ylabel('Sales')
plt.title('Bar Graph with Shadow Effect')
plt.show()
运行以上代码,你会看到柱状图中每个柱子下方都带有阴影效果。
16. 透明度设置
你可以通过alpha参数设置柱状图的透明度。下面是一个例子:
import matplotlib.pyplot as plt

# 水果种类
fruits = ['Apple', 'Banana', 'Orange', 'Grape', 'Mango']

# 水果销量
sales = [50, 30, 40, 60, 70]

plt.bar(fruits, sales, alpha=0.5)
plt.xlabel('Fruits')
plt.ylabel('Sales')
plt.title('Bar Graph with Transparency')
plt.show()
Output:
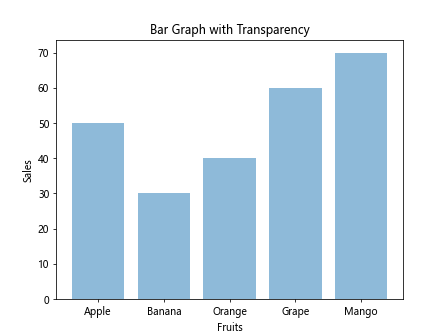
运行以上代码,你会看到柱状图中的柱子具有一定的透明度。
17. 改变柱状图边框颜色和粗细
你可以通过edgecolor参数设置柱状图的边框颜色,通过linewidth参数设置边框的粗细。下面是一个例子:
import matplotlib.pyplot as plt

# 水果种类
fruits = ['Apple', 'Banana', 'Orange', 'Grape', 'Mango']

# 水果销量
sales = [50, 30, 40, 60, 70]

plt.bar(fruits, sales, edgecolor='black', linewidth=2)
plt.xlabel('Fruits')
plt.ylabel('Sales')
plt.title('Bar Graph with Custom Border Color and Width')
plt.show()
Output:
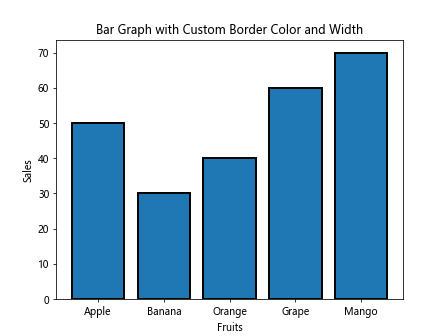
运行以上代码,你会看到柱状图中的柱子边框颜色为黑色,且边框粗细为2。
18. 设置柱状图宽度
你可以通过width参数设置柱状图的宽度。下面是一个例子:
import matplotlib.pyplot as plt

# 水果种类
fruits = ['Apple', 'Banana', 'Orange', 'Grape', 'Mango']

# 水果销量
sales = [50, 30, 40, 60, 70]

plt.bar(fruits, sales, width=0.6)
plt.xlabel('Fruits')
plt.ylabel('Sales')
plt.title('Bar Graph with Custom Width')
plt.show()
Output:
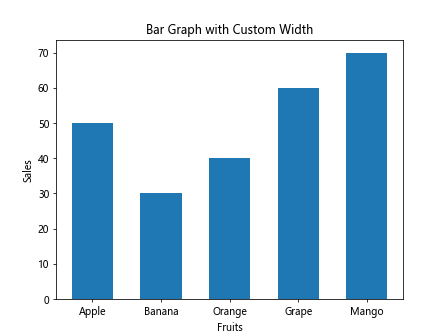
运行以上代码,你会看到柱状图中每个柱子的宽度被设置为0.6。
 极客教程
极客教程