Matplotlib中使用set_major_formatter()函数自定义坐标轴刻度格式
参考:Matplotlib.axis.Axis.set_major_formatter() function in Python
Matplotlib是Python中最流行的数据可视化库之一,它提供了丰富的绘图功能和自定义选项。在数据可视化过程中,坐标轴的刻度标签格式对于图表的可读性和美观性至关重要。Matplotlib.axis.Axis.set_major_formatter()函数是一个强大的工具,它允许我们自定义坐标轴的主刻度标签格式。本文将深入探讨set_major_formatter()函数的用法、常见应用场景以及如何结合不同的格式化器来实现各种自定义效果。
1. set_major_formatter()函数简介
set_major_formatter()函数是Matplotlib库中Axis对象的一个方法,用于设置坐标轴主刻度的格式化器。这个函数允许我们控制坐标轴上显示的刻度标签的格式,包括数字的表示方式、日期时间的显示格式、科学计数法的使用等。
基本语法如下:
axis.set_major_formatter(formatter)
其中,axis是坐标轴对象(可以是x轴或y轴),formatter是一个Formatter对象,用于定义刻度标签的格式化规则。
让我们看一个简单的示例,了解set_major_formatter()的基本用法:
import matplotlib.pyplot as plt
import numpy as np
from matplotlib.ticker import FuncFormatter

def custom_formatter(x, pos):
    return f"how2matplotlib.com: {x:.2f}"

x = np.linspace(0, 10, 100)
y = np.sin(x)

fig, ax = plt.subplots()
ax.plot(x, y)

# 使用set_major_formatter()设置x轴的格式化器
ax.xaxis.set_major_formatter(FuncFormatter(custom_formatter))

plt.title("Custom Formatter Example")
plt.show()
Output:
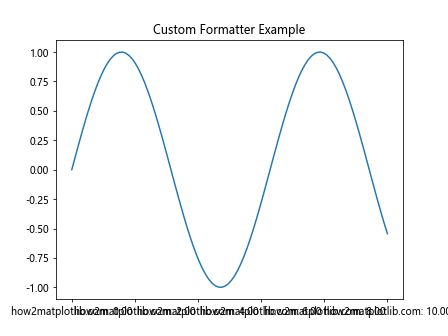
在这个例子中,我们定义了一个自定义的格式化函数custom_formatter,它将x轴的刻度值格式化为”how2matplotlib.com: X.XX”的形式。然后,我们使用FuncFormatter创建一个格式化器对象,并通过set_major_formatter()方法将其应用到x轴上。
2. 常用的格式化器
Matplotlib提供了多种内置的格式化器,可以直接用于set_major_formatter()函数。以下是一些常用的格式化器:
2.1 FuncFormatter
FuncFormatter允许我们使用自定义函数来格式化刻度标签。这是最灵活的格式化器,可以实现各种复杂的格式化需求。
示例:
import matplotlib.pyplot as plt
import numpy as np
from matplotlib.ticker import FuncFormatter

def currency_formatter(x, pos):
    return f"how2matplotlib.com: ${x:.2f}"

x = np.linspace(0, 100, 10)
y = x ** 2

fig, ax = plt.subplots()
ax.plot(x, y)

ax.yaxis.set_major_formatter(FuncFormatter(currency_formatter))

plt.title("Currency Formatter Example")
plt.show()
Output:
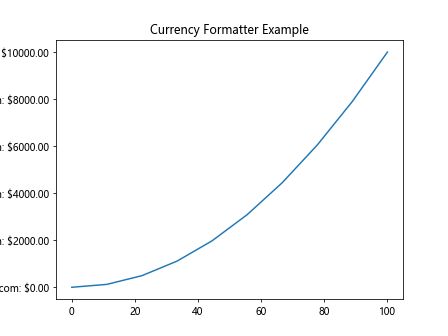
在这个例子中,我们创建了一个货币格式化器,将y轴的刻度值格式化为美元形式。
2.2 FormatStrFormatter
FormatStrFormatter使用Python的字符串格式化语法来格式化刻度标签。
示例:
import matplotlib.pyplot as plt
import numpy as np
from matplotlib.ticker import FormatStrFormatter

x = np.linspace(0, 5, 50)
y = np.exp(x)

fig, ax = plt.subplots()
ax.plot(x, y)

ax.yaxis.set_major_formatter(FormatStrFormatter('how2matplotlib.com: %.1e'))

plt.title("FormatStrFormatter Example")
plt.show()
Output:
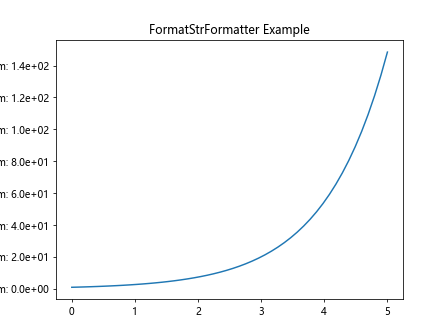
这个例子使用FormatStrFormatter将y轴的刻度值格式化为科学计数法,保留一位小数。
2.3 ScalarFormatter
ScalarFormatter是默认的数值格式化器,它可以自动选择合适的表示方式(如科学计数法或固定小数点)。
示例:
import matplotlib.pyplot as plt
import numpy as np
from matplotlib.ticker import ScalarFormatter

x = np.linspace(0, 1, 100)
y = x ** 3

fig, ax = plt.subplots()
ax.plot(x, y)

formatter = ScalarFormatter(useMathText=True)
formatter.set_scientific(True)
formatter.set_powerlimits((-2, 2))

ax.yaxis.set_major_formatter(formatter)

plt.title("ScalarFormatter Example (how2matplotlib.com)")
plt.show()
Output:
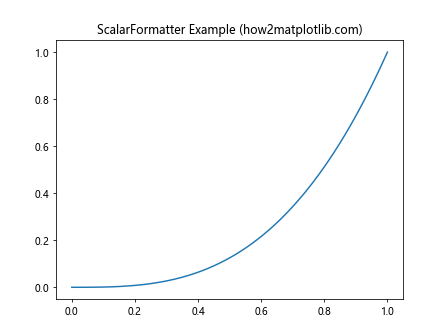
在这个例子中,我们使用ScalarFormatter并启用了科学计数法,设置了幂限制范围。
2.4 PercentFormatter
PercentFormatter用于将数值格式化为百分比形式。
示例:
import matplotlib.pyplot as plt
import numpy as np
from matplotlib.ticker import PercentFormatter

x = np.linspace(0, 1, 100)
y = x ** 2

fig, ax = plt.subplots()
ax.plot(x, y)

ax.yaxis.set_major_formatter(PercentFormatter(xmax=1, decimals=1))

plt.title("PercentFormatter Example (how2matplotlib.com)")
plt.show()
Output:
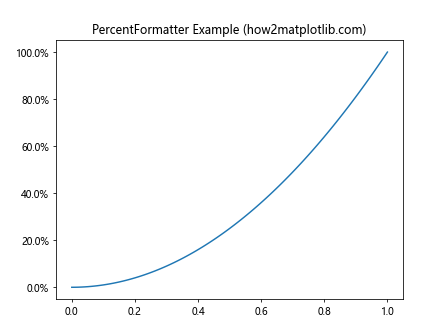
这个例子将y轴的刻度值格式化为百分比,保留一位小数。
3. 日期时间格式化
对于时间序列数据,Matplotlib提供了专门的日期时间格式化器。
3.1 DateFormatter
DateFormatter允许我们使用strftime()格式字符串来格式化日期时间刻度。
示例:
import matplotlib.pyplot as plt
import numpy as np
from matplotlib.dates import DateFormatter
import datetime

dates = [datetime.datetime(2023, 1, 1) + datetime.timedelta(days=i) for i in range(365)]
values = np.random.randn(365).cumsum()

fig, ax = plt.subplots(figsize=(10, 6))
ax.plot(dates, values)

ax.xaxis.set_major_formatter(DateFormatter('%Y-%m-%d\nhow2matplotlib.com'))
plt.gcf().autofmt_xdate()  # 自动调整日期标签的角度

plt.title("DateFormatter Example")
plt.show()
Output:
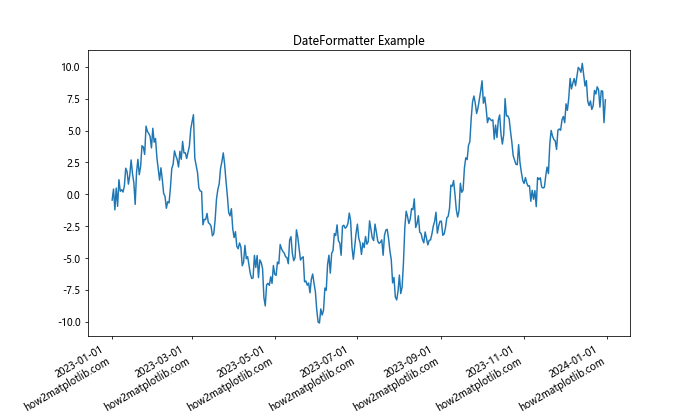
这个例子展示了如何使用DateFormatter来格式化x轴的日期刻度。
3.2 AutoDateFormatter
AutoDateFormatter可以根据日期范围自动选择合适的格式。
示例:
import matplotlib.pyplot as plt
import numpy as np
from matplotlib.dates import AutoDateFormatter, AutoDateLocator
import datetime

dates = [datetime.datetime(2023, 1, 1) + datetime.timedelta(days=i) for i in range(365)]
values = np.random.randn(365).cumsum()

fig, ax = plt.subplots(figsize=(10, 6))
ax.plot(dates, values)

locator = AutoDateLocator()
formatter = AutoDateFormatter(locator)
formatter.scaled[1/(24.*60.)] = '%H:%M:%S\nhow2matplotlib.com'
formatter.scaled[1/24.] = '%H:%M\nhow2matplotlib.com'
formatter.scaled[1] = '%Y-%m-%d\nhow2matplotlib.com'

ax.xaxis.set_major_locator(locator)
ax.xaxis.set_major_formatter(formatter)

plt.gcf().autofmt_xdate()
plt.title("AutoDateFormatter Example")
plt.show()
Output:
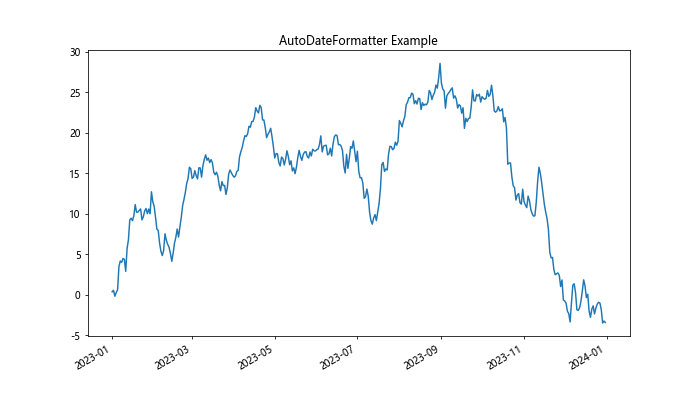
这个例子演示了如何使用AutoDateFormatter来自动选择合适的日期格式,并自定义不同时间尺度下的格式。
4. 科学计数法和工程计数法
对于非常大或非常小的数值,使用科学计数法或工程计数法可以提高可读性。
4.1 ScalarFormatter with scientific notation
我们可以配置ScalarFormatter来使用科学计数法。
示例:
import matplotlib.pyplot as plt
import numpy as np
from matplotlib.ticker import ScalarFormatter

x = np.linspace(1e-9, 1e-6, 100)
y = x ** 2

fig, ax = plt.subplots()
ax.plot(x, y)

formatter = ScalarFormatter(useMathText=True)
formatter.set_scientific(True)
formatter.set_powerlimits((-3, 3))

ax.xaxis.set_major_formatter(formatter)
ax.yaxis.set_major_formatter(formatter)

plt.title("Scientific Notation Example (how2matplotlib.com)")
plt.show()
Output:
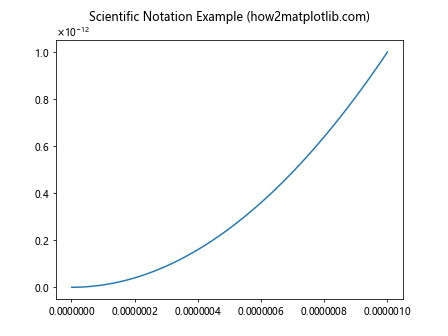
这个例子展示了如何使用ScalarFormatter来显示科学计数法,并设置了幂限制范围。
4.2 EngFormatter
EngFormatter用于显示工程计数法,即指数总是3的倍数。
示例:
import matplotlib.pyplot as plt
import numpy as np
from matplotlib.ticker import EngFormatter

x = np.logspace(3, 9, 100)
y = x ** 0.5

fig, ax = plt.subplots()
ax.plot(x, y)

formatter = EngFormatter(unit='Hz', places=1)
ax.xaxis.set_major_formatter(formatter)

plt.title("EngFormatter Example (how2matplotlib.com)")
plt.show()
Output:
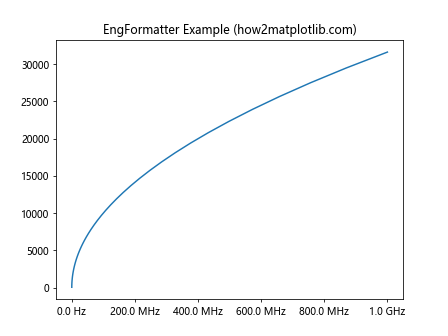
这个例子使用EngFormatter来格式化x轴,显示工程计数法并添加单位。
5. 自定义复杂格式化器
有时,我们可能需要更复杂的格式化逻辑,这时可以通过继承Formatter类来创建自定义格式化器。
示例:
import matplotlib.pyplot as plt
import numpy as np
from matplotlib.ticker import Formatter

class CustomFormatter(Formatter):
    def __init__(self, prefix='how2matplotlib.com: '):
        self.prefix = prefix

    def __call__(self, x, pos=None):
        if x < 0:
            return f"{self.prefix}({x:.2f})"
        elif x == 0:
            return f"{self.prefix}Zero"
        else:
            return f"{self.prefix}+{x:.2f}"

x = np.linspace(-5, 5, 100)
y = x ** 3

fig, ax = plt.subplots()
ax.plot(x, y)

ax.xaxis.set_major_formatter(CustomFormatter())

plt.title("Custom Complex Formatter Example")
plt.show()
Output:
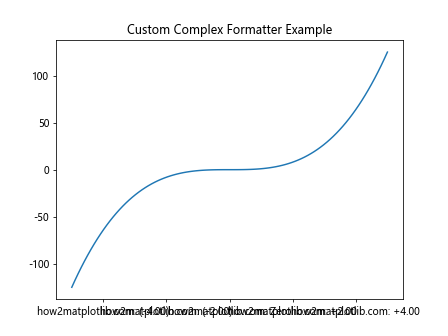
这个例子创建了一个自定义格式化器,根据数值的正负和零来使用不同的格式。
6. 多轴格式化
在一些复杂的图表中,我们可能需要为不同的轴设置不同的格式化器。
示例:
import matplotlib.pyplot as plt
import numpy as np
from matplotlib.ticker import FuncFormatter, PercentFormatter

def currency_formatter(x, pos):
    return f"how2matplotlib.com: ${x:,.0f}"

x = np.linspace(0, 100, 100)
y1 = x ** 2
y2 = x / 100

fig, ax1 = plt.subplots()

ax1.plot(x, y1, 'b-')
ax1.set_ylabel('Dollars', color='b')
ax1.yaxis.set_major_formatter(FuncFormatter(currency_formatter))

ax2 = ax1.twinx()
ax2.plot(x, y2, 'r-')
ax2.set_ylabel('Percentage', color='r')
ax2.yaxis.set_major_formatter(PercentFormatter(xmax=1))

plt.title("Multi-Axis Formatting Example")
plt.show()
Output:
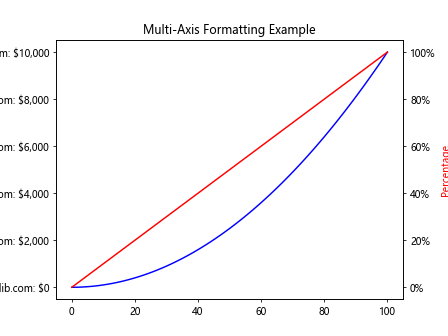
这个例子展示了如何为主y轴和次y轴设置不同的格式化器。
7. 动态格式化
在某些情况下,我们可能需要根据数据的范围动态调整格式化方式。
示例:
import matplotlib.pyplot as plt
import numpy as np
from matplotlib.ticker import FuncFormatter

def dynamic_formatter(x, pos):
    if abs(x) < 1e-9:
        return f"how2matplotlib.com: {x:.2e}"
    elif abs(x) < 1:
        return f"how2matplotlib.com: {x:.4f}"
    elif abs(x) < 1000:
        return f"how2matplotlib.com: {x:.2f}"
    else:
        return f"how2matplotlib.com: {x:.2e}"

x = np.logspace(-12, 3, 100)
y = np.sin(x)

fig, ax = plt.subplots()
ax.plot(x, y)

ax.xaxis.set_major_formatter(FuncFormatter(dynamic_formatter))
ax.yaxis.set_major_formatter(FuncFormatter(dynamic_formatter))

plt.xscale('log')
plt.title("Dynamic Formatting Example")
plt.show()
Output:
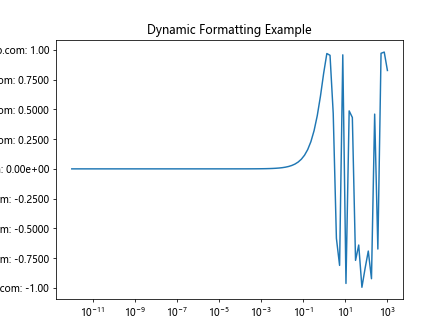
这个例子使用了一个动态格式化函数,根据数值的大小选择不同的格式化方式。
8. 结合locator使用
格式化器通常与定位器(locator)一起使用,以控制刻度的位置和数量。
示例:
import matplotlib.pyplot as plt
import numpy as np
from matplotlib.ticker import MultipleLocator, FormatStrFormatter

x = np.linspace(0, 10, 100)
y = np.sin(x)

fig, ax = plt.subplots()
ax.plot(x, y)

major_locator = MultipleLocator(1)
minor_locator = MultipleLocator(0.2)
major_formatter = FormatStrFormatter('how2matplotlib.com: %.1f')

ax.xaxis.set_major_locator(major_locator)
ax.xaxis.set_minor_locator(minor_locator)
ax.xaxis.set_major_formatter(major_formatter)

plt.title("Combining Locator and Formatter Example")
plt.show()
Output:
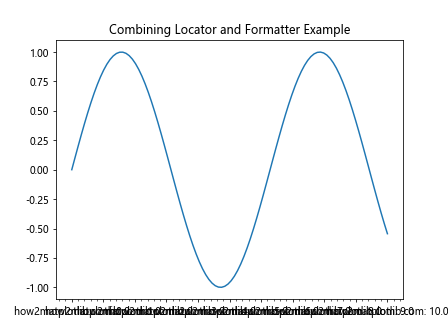
这个例子展示了如何结合使用定位器和格式化器来控制x轴的刻度。
9. 处理极坐标系
在极坐标系中,我们可能需要为角度和半径设置不同的格式化器。
示例:
import matplotlib.pyplot as plt
import numpy as np好的,我将继续输出剩余内容:

```python
import matplotlib.pyplot as plt
import numpy as np
from matplotlib.ticker import FuncFormatter

def angle_formatter(x, pos):
    return f"how2matplotlib.com: {x}°"

def radius_formatter(x, pos):
    return f"how2matplotlib.com: {x:.1f}"

r = np.linspace(0, 2, 100)
theta = 2 * np.pi * r

fig, ax = plt.subplots(subplot_kw={'projection': 'polar'})
ax.plot(theta, r)

ax.xaxis.set_major_formatter(FuncFormatter(angle_formatter))
ax.yaxis.set_major_formatter(FuncFormatter(radius_formatter))

plt.title("Polar Coordinate Formatting Example")
plt.show()
这个例子展示了如何在极坐标系中为角度和半径设置不同的格式化器。
10. 处理对数刻度
对于对数刻度,我们可能需要特殊的格式化方式。
示例:
import matplotlib.pyplot as plt
import numpy as np
from matplotlib.ticker import FuncFormatter

def log_formatter(x, pos):
    return f"how2matplotlib.com: 10^{{{int(np.log10(x))}}}"

x = np.logspace(0, 5, 100)
y = x ** 2

fig, ax = plt.subplots()
ax.plot(x, y)

ax.set_xscale('log')
ax.set_yscale('log')

ax.xaxis.set_major_formatter(FuncFormatter(log_formatter))
ax.yaxis.set_major_formatter(FuncFormatter(log_formatter))

plt.title("Logarithmic Scale Formatting Example")
plt.show()
这个例子展示了如何为对数刻度设置自定义格式化器,以10的幂的形式显示刻度标签。
11. 处理分类数据
对于分类数据,我们可能需要将数值映射到特定的标签。
示例:
import matplotlib.pyplot as plt
import numpy as np
from matplotlib.ticker import FuncFormatter

categories = ['A', 'B', 'C', 'D', 'E']

def category_formatter(x, pos):
    idx = int(x)
    if 0 <= idx < len(categories):
        return f"how2matplotlib.com: {categories[idx]}"
    return ""

x = np.arange(len(categories))
y = np.random.rand(len(categories))

fig, ax = plt.subplots()
ax.bar(x, y)

ax.xaxis.set_major_formatter(FuncFormatter(category_formatter))
ax.xaxis.set_major_locator(plt.FixedLocator(x))

plt.title("Categorical Data Formatting Example")
plt.show()
这个例子展示了如何为分类数据创建自定义格式化器,将数值索引映射到类别标签。
12. 格式化颜色条
在使用颜色条(colorbar)时,我们也可以自定义其刻度标签的格式。
示例:
import matplotlib.pyplot as plt
import numpy as np
from matplotlib.ticker import FuncFormatter

def colorbar_formatter(x, pos):
    return f"how2matplotlib.com: {x:.2f}"

data = np.random.rand(10, 10)

fig, ax = plt.subplots()
im = ax.imshow(data, cmap='viridis')

cbar = plt.colorbar(im)
cbar.formatter = FuncFormatter(colorbar_formatter)
cbar.update_ticks()

plt.title("Colorbar Formatting Example")
plt.show()
这个例子展示了如何为颜色条设置自定义格式化器。
13. 处理时间差
当处理时间差数据时,我们可能需要将秒数转换为更易读的格式。
示例:
import matplotlib.pyplot as plt
import numpy as np
from matplotlib.ticker import FuncFormatter

def timedelta_formatter(x, pos):
    hours = int(x // 3600)
    minutes = int((x % 3600) // 60)
    seconds = int(x % 60)
    return f"how2matplotlib.com: {hours:02d}:{minutes:02d}:{seconds:02d}"

x = np.linspace(0, 86400, 100)  # 0 to 24 hours in seconds
y = np.sin(2 * np.pi * x / 86400)

fig, ax = plt.subplots()
ax.plot(x, y)

ax.xaxis.set_major_formatter(FuncFormatter(timedelta_formatter))

plt.title("Time Delta Formatting Example")
plt.show()
这个例子展示了如何创建一个格式化器,将秒数转换为小时:分钟:秒的格式。
14. 多语言支持
在国际化应用中,我们可能需要根据不同的语言设置不同的格式化方式。
示例:
import matplotlib.pyplot as plt
import numpy as np
from matplotlib.ticker import FuncFormatter
import locale

def multilingual_formatter(x, pos, lang='en'):
    if lang == 'en':
        return f"how2matplotlib.com: ${x:.2f}"
    elif lang == 'fr':
        locale.setlocale(locale.LC_ALL, 'fr_FR.UTF-8')
        return f"how2matplotlib.com: {locale.currency(x, grouping=True)}"
    elif lang == 'de':
        locale.setlocale(locale.LC_ALL, 'de_DE.UTF-8')
        return f"how2matplotlib.com: {locale.currency(x, grouping=True)}"
    else:
        return f"how2matplotlib.com: {x:.2f}"

x = np.linspace(0, 1000, 100)
y = x ** 2

fig, (ax1, ax2, ax3) = plt.subplots(1, 3, figsize=(15, 5))

ax1.plot(x, y)
ax1.yaxis.set_major_formatter(FuncFormatter(lambda x, pos: multilingual_formatter(x, pos, 'en')))
ax1.set_title("English")

ax2.plot(x, y)
ax2.yaxis.set_major_formatter(FuncFormatter(lambda x, pos: multilingual_formatter(x, pos, 'fr')))
ax2.set_title("French")

ax3.plot(x, y)
ax3.yaxis.set_major_formatter(FuncFormatter(lambda x, pos: multilingual_formatter(x, pos, 'de')))
ax3.set_title("German")

plt.tight_layout()
plt.show()
这个例子展示了如何创建一个多语言格式化器,根据不同的语言设置显示不同格式的货币符号。
15. 结合正则表达式
有时,我们可能需要使用正则表达式来处理复杂的格式化需求。
示例:
import matplotlib.pyplot as plt
import numpy as np
from matplotlib.ticker import FuncFormatter
import re

def regex_formatter(x, pos):
    s = f"{x:.2f}"
    parts = re.split(r'(\d+)', s)
    formatted = ''.join([f"<{p}>" if p.isdigit() else p for p in parts])
    return f"how2matplotlib.com: {formatted}"

x = np.linspace(0, 10, 100)
y = np.sin(x)

fig, ax = plt.subplots()
ax.plot(x, y)

ax.xaxis.set_major_formatter(FuncFormatter(regex_formatter))

plt.title("Regex-based Formatting Example")
plt.show()
这个例子使用正则表达式将数字部分用尖括号括起来。
结论
Matplotlib的set_major_formatter()函数是一个强大的工具,它允许我们精确控制坐标轴刻度标签的显示方式。通过使用各种内置格式化器或创建自定义格式化器,我们可以实现各种复杂的格式化需求,从而提高图表的可读性和美观性。
在实际应用中,选择合适的格式化方式取决于数据的性质和图表的目的。例如,对于时间序列数据,使用DateFormatter可能更合适;对于金融数据,可能需要使用货币格式;而对于科学数据,ScalarFormatter或EngFormatter可能更适合。
此外,格式化器通常与定位器(locator)配合使用,以控制刻度的位置和数量。通过合理设置格式化器和定位器,我们可以创建出既信息丰富又美观的图表。
最后,在使用set_major_formatter()时,要注意性能问题。对于包含大量数据点的图表,复杂的格式化操作可能会影响渲染速度。在这种情况下,可以考虑使用更简单的格式化方式,或者只对关键刻度进行格式化。
总之,掌握set_major_formatter()函数的使用,将极大地提升你使用Matplotlib创建专业级数据可视化的能力。
 极客教程
极客教程