Matplotlib中Axis.get_url()函数的全面指南与应用
参考:Matplotlib.axis.Axis.get_url() in function Python
Matplotlib是Python中最流行的数据可视化库之一,它提供了丰富的绘图功能和自定义选项。在Matplotlib中,Axis.get_url()是一个重要的函数,用于获取轴对象的URL属性。本文将深入探讨这个函数的用法、应用场景以及相关的高级技巧。
1. Axis.get_url()函数简介
Axis.get_url()是Matplotlib库中axis.Axis类的一个方法。这个函数的主要作用是获取与轴对象相关联的URL。URL可以用于为图表元素添加超链接,使得图表具有交互性,可以跳转到相关的网页或资源。
1.1 基本语法
import matplotlib.pyplot as plt

fig, ax = plt.subplots()
x_axis = ax.xaxis
url = x_axis.get_url()
print(f"X轴的URL: {url}")

plt.title("how2matplotlib.com示例")
plt.show()
Output:
在这个简单的示例中,我们创建了一个图表,获取了x轴的对象,然后调用get_url()方法来获取URL。通常情况下,如果没有特别设置,URL默认为None。
2. 设置和获取轴的URL
要使get_url()函数返回有意义的值,我们首先需要为轴设置URL。这可以通过set_url()方法完成。
2.1 设置轴的URL
import matplotlib.pyplot as plt

fig, ax = plt.subplots()
ax.xaxis.set_url("https://how2matplotlib.com")
ax.yaxis.set_url("https://how2matplotlib.com/axis")

x_url = ax.xaxis.get_url()
y_url = ax.yaxis.get_url()

print(f"X轴URL: {x_url}")
print(f"Y轴URL: {y_url}")

plt.title("轴URL设置示例")
plt.show()
Output:
在这个例子中,我们为x轴和y轴分别设置了不同的URL,然后使用get_url()方法获取这些URL。
3. URL在图表交互中的应用
设置轴的URL可以为图表添加交互性,尤其是在web环境中使用Matplotlib时。
3.1 创建可点击的轴标签
import matplotlib.pyplot as plt
from matplotlib.backends.backend_svg import FigureCanvasSVG

fig, ax = plt.subplots()
ax.plot([1, 2, 3, 4], [1, 4, 2, 3])

ax.xaxis.set_url("https://how2matplotlib.com/x-axis")
ax.yaxis.set_url("https://how2matplotlib.com/y-axis")

plt.title("可点击轴标签示例")

# 保存为SVG以保留URL信息
plt.savefig("interactive_plot.svg", format="svg")
plt.close()
这个例子创建了一个简单的线图,并为x轴和y轴设置了URL。当保存为SVG格式时,这些URL信息会被保留,使得在支持SVG的环境中(如web浏览器)可以点击轴标签跳转到相应的URL。
4. 在子图中使用get_url()
Matplotlib支持创建包含多个子图的复杂图表。我们可以为每个子图的轴单独设置和获取URL。
4.1 多子图URL设置
import matplotlib.pyplot as plt

fig, (ax1, ax2) = plt.subplots(1, 2, figsize=(10, 4))

ax1.plot([1, 2, 3, 4], [1, 4, 2, 3])
ax1.set_title("子图1")
ax1.xaxis.set_url("https://how2matplotlib.com/subplot1/x")
ax1.yaxis.set_url("https://how2matplotlib.com/subplot1/y")

ax2.plot([1, 2, 3, 4], [3, 2, 4, 1])
ax2.set_title("子图2")
ax2.xaxis.set_url("https://how2matplotlib.com/subplot2/x")
ax2.yaxis.set_url("https://how2matplotlib.com/subplot2/y")

for ax in [ax1, ax2]:
    print(f"{ax.get_title()} X轴URL: {ax.xaxis.get_url()}")
    print(f"{ax.get_title()} Y轴URL: {ax.yaxis.get_url()}")

plt.tight_layout()
plt.show()
Output:
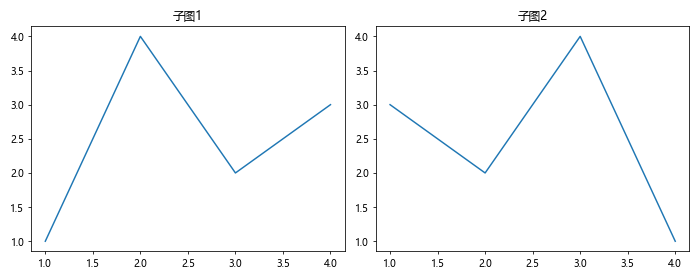
这个例子展示了如何在包含两个子图的图表中为每个轴设置不同的URL,并使用get_url()方法获取这些URL。
5. 动态更新轴URL
在某些情况下,我们可能需要根据数据或用户交互动态更新轴的URL。
5.1 基于数据更新URL
import matplotlib.pyplot as plt
import numpy as np

def update_url(ax, data):
    max_value = np.max(data)
    if max_value > 5:
        ax.xaxis.set_url("https://how2matplotlib.com/high-value")
    else:
        ax.xaxis.set_url("https://how2matplotlib.com/low-value")

fig, ax = plt.subplots()

data = np.random.rand(10) * 10
ax.plot(data)

update_url(ax, data)

print(f"X轴URL: {ax.xaxis.get_url()}")

plt.title("动态URL更新示例")
plt.show()
Output:
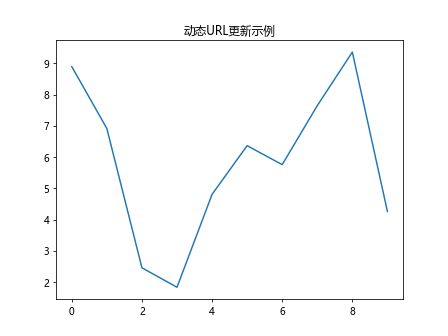
这个例子展示了如何根据绘制的数据动态设置轴的URL。当数据的最大值超过5时,设置一个URL;否则,设置另一个URL。
6. 结合事件处理使用get_url()
Matplotlib提供了丰富的事件处理机制,我们可以结合get_url()函数来创建更加交互式的图表。
6.1 鼠标悬停显示URL
import matplotlib.pyplot as plt
from matplotlib.backends.backend_tkagg import FigureCanvasTkAgg
import tkinter as tk

def on_hover(event):
    if event.inaxes:
        url = event.inaxes.xaxis.get_url()
        status_bar.config(text=f"URL: {url}" if url else "No URL set")

root = tk.Tk()
root.title("how2matplotlib.com URL示例")

fig, ax = plt.subplots()
ax.plot([1, 2, 3, 4], [1, 4, 2, 3])
ax.xaxis.set_url("https://how2matplotlib.com/interactive")

canvas = FigureCanvasTkAgg(fig, master=root)
canvas.draw()
canvas.get_tk_widget().pack()

status_bar = tk.Label(root, text="", bd=1, relief=tk.SUNKEN, anchor=tk.W)
status_bar.pack(side=tk.BOTTOM, fill=tk.X)

canvas.mpl_connect("motion_notify_event", on_hover)

root.mainloop()
这个高级示例创建了一个Tkinter窗口,其中包含一个Matplotlib图表。当鼠标悬停在图表上时,会显示x轴的URL(如果已设置)。
7. URL与图例的结合
我们可以为图例中的元素设置URL,并使用get_url()函数来获取这些URL。
7.1 图例元素URL
import matplotlib.pyplot as plt

fig, ax = plt.subplots()

line1, = ax.plot([1, 2, 3, 4], [1, 4, 2, 3], label="Line 1")
line2, = ax.plot([1, 2, 3, 4], [3, 2, 4, 1], label="Line 2")

line1.set_url("https://how2matplotlib.com/line1")
line2.set_url("https://how2matplotlib.com/line2")

legend = ax.legend()

for line in legend.get_lines():
    url = line.get_url()
    print(f"{line.get_label()} URL: {url}")

plt.title("图例URL示例")
plt.show()
Output:
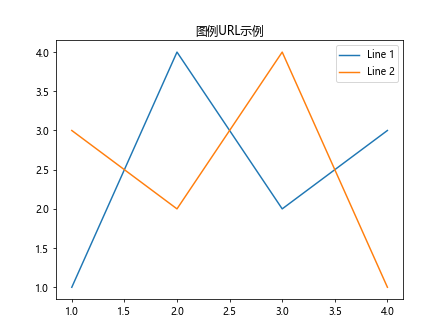
这个例子展示了如何为图例中的线条设置URL,并使用get_url()方法获取这些URL。
8. 在3D图表中使用get_url()
Matplotlib也支持创建3D图表,我们可以为3D图表的轴设置和获取URL。
8.1 3D图表轴URL
import matplotlib.pyplot as plt
from mpl_toolkits.mplot3d import Axes3D
import numpy as np

fig = plt.figure()
ax = fig.add_subplot(111, projection='3d')

x = np.arange(-5, 5, 0.25)
y = np.arange(-5, 5, 0.25)
X, Y = np.meshgrid(x, y)
R = np.sqrt(X**2 + Y**2)
Z = np.sin(R)

ax.plot_surface(X, Y, Z)

ax.xaxis.set_url("https://how2matplotlib.com/3d/x")
ax.yaxis.set_url("https://how2matplotlib.com/3d/y")
ax.zaxis.set_url("https://how2matplotlib.com/3d/z")

for axis in [ax.xaxis, ax.yaxis, ax.zaxis]:
    print(f"{axis.axis_name} URL: {axis.get_url()}")

plt.title("3D图表URL示例")
plt.show()
Output:
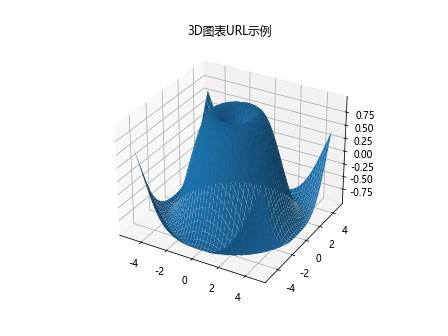
这个例子创建了一个3D表面图,并为x、y、z三个轴分别设置了URL。然后使用get_url()方法获取并打印这些URL。
9. 自定义URL处理函数
在某些情况下,我们可能需要自定义URL的处理方式。我们可以创建一个自定义函数来处理URL,并结合get_url()使用。
9.1 自定义URL处理
import matplotlib.pyplot as plt
import webbrowser

def handle_url(event):
    if event.artist.axes and event.artist.axes.xaxis:
        url = event.artist.axes.xaxis.get_url()
        if url:
            webbrowser.open(url)

fig, ax = plt.subplots()
ax.plot([1, 2, 3, 4], [1, 4, 2, 3])
ax.xaxis.set_url("https://how2matplotlib.com/custom")

plt.title("点击图表打开URL")

fig.canvas.mpl_connect('button_press_event', handle_url)

plt.show()
Output:
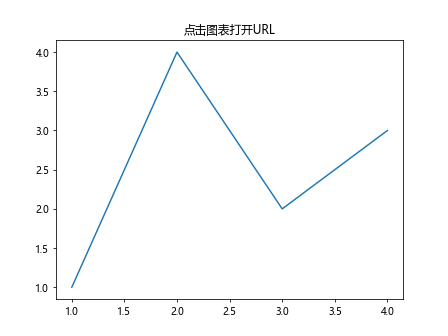
这个例子创建了一个自定义函数handle_url,当用户点击图表时,它会获取x轴的URL并在默认浏览器中打开。
10. URL与动画的结合
Matplotlib支持创建动画,我们可以在动画中动态更新轴的URL。
10.1 动画中的URL更新
import matplotlib.pyplot as plt
import matplotlib.animation as animation
import numpy as np

fig, ax = plt.subplots()
line, = ax.plot([], [])
ax.set_xlim(0, 2*np.pi)
ax.set_ylim(-1, 1)

def init():
    line.set_data([], [])
    return line,

def animate(i):
    x = np.linspace(0, 2*np.pi, 100)
    y = np.sin(x + i/10.0)
    line.set_data(x, y)

    # 更新URL
    new_url = f"https://how2matplotlib.com/animation/{i}"
    ax.xaxis.set_url(new_url)
    print(f"Frame {i}, URL: {ax.xaxis.get_url()}")

    return line,

anim = animation.FuncAnimation(fig, animate, init_func=init,
                               frames=200, interval=50, blit=True)

plt.title("动画URL更新示例")
plt.show()
Output:
这个高级示例创建了一个简单的正弦波动画,并在每一帧更新x轴的URL。使用get_url()方法,我们可以在每一帧打印当前的URL。
11. 在极坐标图中使用get_url()
Matplotlib也支持创建极坐标图,我们可以为极坐标图的轴设置和获取URL。
11.1 极坐标图轴URL
import matplotlib.pyplot as plt
import numpy as np

fig, ax = plt.subplots(subplot_kw=dict(projection='polar'))

r = np.arange(0, 2, 0.01)
theta = 2 * np.pi * r

ax.plot(theta, r)

ax.set_rmax(2)
ax.set_rticks([0.5, 1, 1.5, 2])

ax.xaxis.set_url("https://how2matplotlib.com/polar/theta")
ax.yaxis.set_url("https://how2matplotlib.com/polar/r")

print(f"Theta轴URL: {ax.xaxis.get_url()}")
print(f"R轴URL: {ax.yaxis.get_url()}")

plt.title("极坐标图URL示例")
plt.show()
Output:
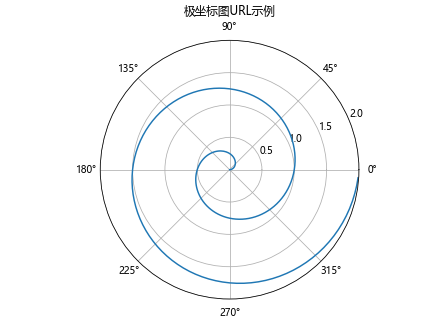
这个例子创建了一个极坐标图,并为θ轴(方位角)和r轴(半径)分别设置了URL。然后使用get_url()方法获取并打印这些URL。
12. URL与颜色映射的结合
我们可以根据颜色映射的不同值来动态设置轴的URL。
12.1 基于颜色映射的URL设置
import matplotlib.pyplot as plt
import numpy as np

def set_url_based_on_color(ax, cm):
    if cm.name == 'viridis':
        ax.xaxis.set_url("https://how2matplotlib.com/colormap/viridis")
    elif cm.name == 'plasma':
        ax.xaxis.set_url("https://how2matplotlib.com/colormap/plasma")
    else:
        ax.xaxis.set_url("https://how2matplotlib.com/colormap/other")

fig, (ax1, ax2) = plt.subplots(1, 2, figsize=(10, 4))

data = np.random.rand(10, 10)

im1 = ax1.imshow(data, cmap='viridis')
im2 = ax2.imshow(data, cmap='plasma')

set_url_based_on_color(ax1, im1.get_cmap())
set_url_based_on_color(ax2, im2.get_cmap())

print(f"左图X轴URL: {ax1.xaxis.get_url()}")
print(f"右图X轴URL: {ax2.xaxis.get_url()}")

plt.suptitle("颜色映射与URL示例")
plt.show()
Output:
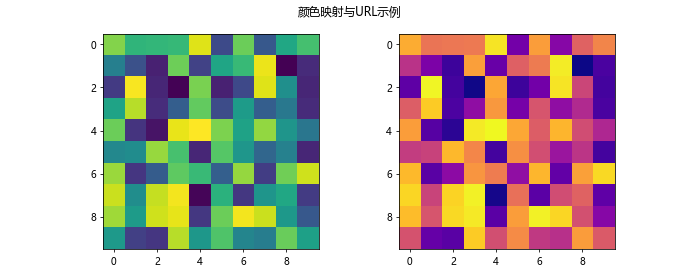
这个例子展示了如何根据使用的颜色映射为轴设置不同的URL。我们创建了两个子图,分别使用不同的颜色映射,然后根据颜色映射设置相应的URL。
13. URL与文本注释的结合
我们可以为图表中的文本注释设置URL,并使用get_url()方法获取这些URL。
13.1 文本注释URL
import matplotlib.pyplot as plt

fig, ax = plt.subplots()

ax.plot([1, 2, 3, 4], [1, 4, 2, 3])

text1 = ax.annotate("Point A", xy=(2, 4), xytext=(3, 4),
                    arrowprops=dict(arrowstyle="->"))
text2 = ax.annotate("Point B", xy=(4, 3), xytext=(3, 2),
                    arrowprops=dict(arrowstyle="->"))

text1.set_url("https://how2matplotlib.com/annotation/a")
text2.set_url("https://how2matplotlib.com/annotation/b")

for text in [text1, text2]:
    print(f"{text.get_text()} URL: {text.get_url()}")

plt.title("文本注释URL示例")
plt.show()
Output:
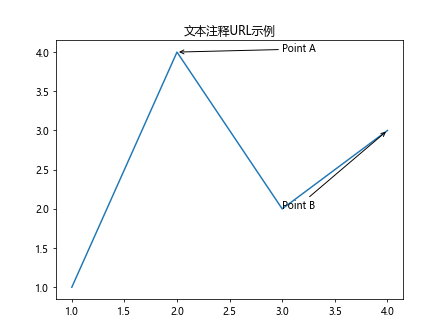
这个例子为图表添加了两个带箭头的文本注释,并为每个注释设置了不同的URL。然后使用get_url()方法获取并打印这些URL。
14. 在交互式环境中使用get_url()
在Jupyter Notebook或IPython等交互式环境中,我们可以结合get_url()方法创建交互式的图表探索体验。
14.1 交互式URL显示
import matplotlib.pyplot as plt
from IPython.display import display, HTML

fig, ax = plt.subplots()
ax.plot([1, 2, 3, 4], [1, 4, 2, 3])

ax.xaxis.set_url("https://how2matplotlib.com/interactive/x")
ax.yaxis.set_url("https://how2matplotlib.com/interactive/y")

plt.title("交互式URL显示示例")

def show_url(event):
    if event.inaxes:
        x_url = event.inaxes.xaxis.get_url()
        y_url = event.inaxes.yaxis.get_url()
        display(HTML(f"X轴URL: <a href='{x_url}'>{x_url}</a><br>"
                     f"Y轴URL: <a href='{y_url}'>{y_url}</a>"))

fig.canvas.mpl_connect('button_press_event', show_url)

plt.show()
这个例子创建了一个图表,当用户点击图表时,会显示x轴和y轴的URL作为可点击的链接。这在Jupyter Notebook环境中特别有用。
15. URL与自定义刻度的结合
我们可以为自定义的刻度标签设置URL,并使用get_url()方法获取这些URL。
15.1 自定义刻度URL
import matplotlib.pyplot as plt
from matplotlib.ticker import FuncFormatter

def custom_formatter(x, pos):
    label = f"Val{x:.1f}"
    url = f"https://how2matplotlib.com/tick/{x:.1f}"
    return label, url

fig, ax = plt.subplots()
ax.plot([1, 2, 3, 4], [1, 4, 2, 3])

formatter = FuncFormatter(custom_formatter)
ax.xaxis.set_major_formatter(formatter)

for tick in ax.get_xticklabels():
    print(f"刻度 {tick.get_text()} URL: {tick.get_url()}")

plt.title("自定义刻度URL示例")
plt.show()
Output:
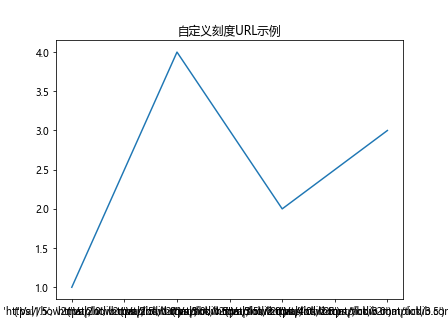
这个例子使用自定义的格式化函数为x轴的每个刻度设置不同的URL。然后我们遍历所有刻度标签,使用get_url()方法获取并打印这些URL。
16. URL与图表导出的结合
当导出图表为不同格式时,URL信息的保留方式可能会有所不同。我们可以探索如何在不同的导出格式中使用和保留URL信息。
16.1 SVG格式保留URL
import matplotlib.pyplot as plt
import xml.etree.ElementTree as ET

fig, ax = plt.subplots()
ax.plot([1, 2, 3, 4], [1, 4, 2, 3])

ax.xaxis.set_url("https://how2matplotlib.com/export/svg")

plt.title("SVG导出URL示例")

# 保存为SVG
plt.savefig("plot_with_url.svg")
plt.close()

# 解析SVG文件
tree = ET.parse("plot_with_url.svg")
root = tree.getroot()

# 查找包含URL的元素
for elem in root.iter():
    url = elem.get("xlink:href")
    if url:
        print(f"找到URL: {url}")
这个例子展示了如何将图表保存为SVG格式,并保留URL信息。然后我们解析SVG文件来验证URL是否被正确保存。
17. 使用get_url()进行数据分析
我们可以利用get_url()方法来增强数据分析过程,为不同的数据区域设置不同的URL,从而创建更具信息量的可视化。
17.1 数据区域URL映射
import matplotlib.pyplot as plt
import numpy as np

def set_url_for_region(ax, x, y):
    if np.mean(y) > 5:
        ax.xaxis.set_url("https://how2matplotlib.com/analysis/high")
    else:
        ax.xaxis.set_url("https://how2matplotlib.com/analysis/low")

fig, (ax1, ax2) = plt.subplots(1, 2, figsize=(10, 4))

x1 = np.linspace(0, 10, 100)
y1 = np.sin(x1) + 6
ax1.plot(x1, y1)
set_url_for_region(ax1, x1, y1)

x2 = np.linspace(0, 10, 100)
y2 = np.cos(x2) + 2
ax2.plot(x2, y2)
set_url_for_region(ax2, x2, y2)

print(f"左图URL: {ax1.xaxis.get_url()}")
print(f"右图URL: {ax2.xaxis.get_url()}")

plt.suptitle("数据分析URL映射示例")
plt.show()
Output:
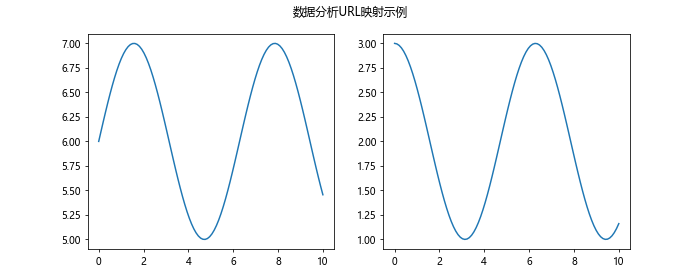
这个例子创建了两个子图,根据数据的平均值为每个子图的x轴设置不同的URL。这种方法可以用来快速识别和链接到不同特征的数据区域。
18. URL与图表主题的结合
Matplotlib支持不同的图表主题(样式),我们可以根据当前使用的主题来设置不同的URL。
18.1 主题相关URL
import matplotlib.pyplot as plt

def set_url_based_on_style(ax):
    style = plt.style.get_stylename()
    ax.xaxis.set_url(f"https://how2matplotlib.com/style/{style}")

fig, (ax1, ax2) = plt.subplots(1, 2, figsize=(10, 4))

with plt.style.context('seaborn'):
    ax1.plot([1, 2, 3, 4], [1, 4, 2, 3])
    set_url_based_on_style(ax1)

with plt.style.context('ggplot'):
    ax2.plot([1, 2, 3, 4], [3, 2, 4, 1])
    set_url_based_on_style(ax2)

print(f"左图URL: {ax1.xaxis.get_url()}")
print(f"右图URL: {ax2.xaxis.get_url()}")

plt.suptitle("主题相关URL示例")
plt.show()
这个例子使用了两种不同的图表样式,并根据样式为每个子图的x轴设置相应的URL。
19. 在网格图中使用get_url()
对于更复杂的网格图布局,我们可以为每个子图的轴设置不同的URL。
19.1 网格图URL设置
import matplotlib.pyplot as plt

fig = plt.figure(figsize=(12, 8))
gs = fig.add_gridspec(2, 3)

ax1 = fig.add_subplot(gs[0, 0])
ax2 = fig.add_subplot(gs[0, 1:])
ax3 = fig.add_subplot(gs[1, :2])
ax4 = fig.add_subplot(gs[1, 2])

axes = [ax1, ax2, ax3, ax4]
for i, ax in enumerate(axes, 1):
    ax.plot([1, 2, 3, 4], [1, 4, 2, 3])
    ax.set_title(f"子图 {i}")
    ax.xaxis.set_url(f"https://how2matplotlib.com/grid/subplot{i}")

for ax in axes:
    print(f"{ax.get_title()} URL: {ax.xaxis.get_url()}")

plt.tight_layout()
plt.suptitle("网格图URL示例")
plt.show()
Output:
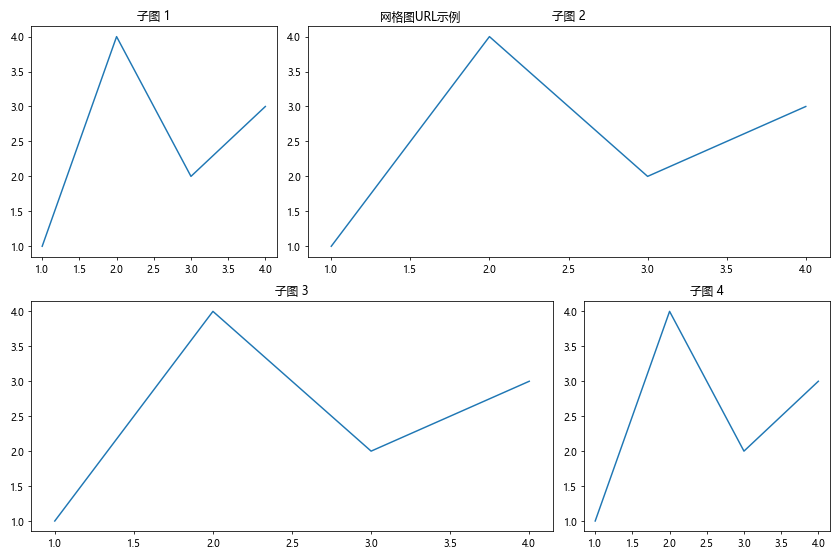
这个例子创建了一个2×3的网格图,包含4个不同大小的子图。我们为每个子图的x轴设置了不同的URL,并使用get_url()方法获取这些URL。
20. 结论
通过本文的详细探讨,我们深入了解了Matplotlib中Axis.get_url()函数的各种用法和应用场景。从基本的URL设置和获取,到与动画、交互式环境、数据分析等高级主题的结合,我们看到了这个函数在创建信息丰富、交互性强的数据可视化中的重要作用。
get_url()函数不仅可以用于简单地获取轴的URL属性,还可以与Matplotlib的其他功能结合,创建出更加复杂和有意义的可视化效果。通过为图表元素添加URL,我们可以增强数据可视化的交互性和信息量,使得图表不仅仅是静态的数据展示,还可以成为探索和分析数据的入口。
在实际应用中,get_url()函数可以用于创建可点击的图表元素,链接到相关的文档、数据源或分析报告。在Web应用或交互式文档中,这一功能尤其有用,可以为用户提供更丰富的数据探索体验。
总的来说,掌握Axis.get_url()函数及其相关应用,可以帮助我们创建更加丰富、交互性更强的数据可视化,从而更好地传达数据背后的故事和洞察。
 极客教程
极客教程