Matplotlib中的Axis.get_transform()函数:坐标变换的关键
参考:Matplotlib.axis.Axis.get_transform() function in Python
Matplotlib是Python中最流行的数据可视化库之一,它提供了丰富的绘图功能和灵活的自定义选项。在Matplotlib中,坐标变换是一个非常重要的概念,它允许我们在不同的坐标系统之间进行转换,从而实现更复杂的绘图效果。本文将深入探讨Matplotlib中的Axis.get_transform()函数,这是实现坐标变换的关键方法之一。
1. Axis.get_transform()函数简介
Axis.get_transform()是Matplotlib库中axis.Axis类的一个方法。这个函数的主要作用是获取与特定坐标轴相关联的坐标变换对象。这个变换对象描述了如何将数据坐标转换为显示坐标(通常是像素坐标)。
让我们看一个简单的例子来了解get_transform()的基本用法:
import matplotlib.pyplot as plt
import numpy as np

fig, ax = plt.subplots()
x = np.linspace(0, 10, 100)
y = np.sin(x)
ax.plot(x, y, label='sin(x)')

# 获取x轴的变换对象
x_transform = ax.xaxis.get_transform()
print("X-axis transform:", x_transform)

# 获取y轴的变换对象
y_transform = ax.yaxis.get_transform()
print("Y-axis transform:", y_transform)

plt.title('How2matplotlib.com: Axis.get_transform() Example')
plt.legend()
plt.show()
Output:
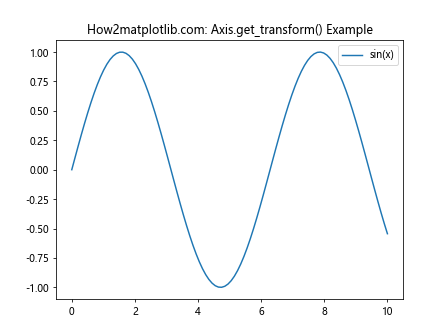
在这个例子中,我们首先创建了一个简单的正弦曲线图。然后,我们分别使用ax.xaxis.get_transform()和ax.yaxis.get_transform()获取了x轴和y轴的变换对象。这些变换对象包含了将数据坐标转换为显示坐标的所有必要信息。
2. 坐标变换的基本概念
在深入了解get_transform()函数之前,我们需要先理解Matplotlib中坐标变换的基本概念。
2.1 数据坐标系
数据坐标系是我们最常用的坐标系,它直接对应于我们绘图时使用的数据值。例如,当我们绘制一个点(3, 4)时,我们使用的就是数据坐标系。
import matplotlib.pyplot as plt

fig, ax = plt.subplots()
ax.plot(3, 4, 'ro')  # 在数据坐标(3, 4)处绘制一个红点
ax.set_xlim(0, 5)
ax.set_ylim(0, 5)
plt.title('How2matplotlib.com: Data Coordinates Example')
plt.show()
Output:
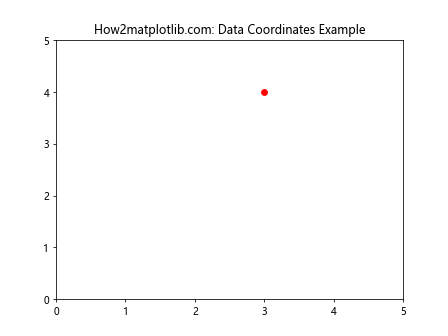
在这个例子中,我们在数据坐标(3, 4)处绘制了一个红点。数据坐标系是我们最直观的坐标系,但它并不是Matplotlib内部使用的唯一坐标系。
2.2 轴坐标系
轴坐标系是与特定轴相关的坐标系。在这个坐标系中,坐标值被归一化到0到1之间。轴的起点对应0,终点对应1。
import matplotlib.pyplot as plt
import matplotlib.transforms as transforms

fig, ax = plt.subplots()
ax.plot([0, 1], [0, 1], transform=ax.transAxes)
plt.title('How2matplotlib.com: Axes Coordinates Example')
plt.show()
Output:
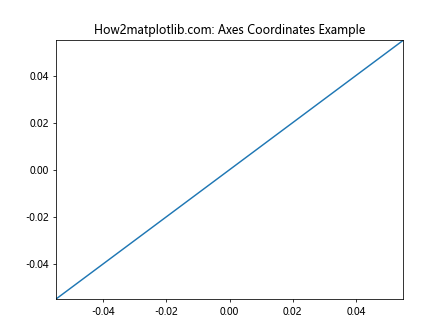
在这个例子中,我们使用ax.transAxes变换绘制了一条从轴坐标系的(0, 0)到(1, 1)的直线。这条线恰好是图形的对角线。
2.3 图形坐标系
图形坐标系是相对于整个图形的坐标系。在这个坐标系中,坐标值同样被归一化到0到1之间,但是是相对于整个图形而言的。
import matplotlib.pyplot as plt
import matplotlib.transforms as transforms

fig, ax = plt.subplots()
line = plt.Line2D([0, 1], [0, 1], transform=fig.transFigure, figure=fig)
fig.lines.append(line)
plt.title('How2matplotlib.com: Figure Coordinates Example')
plt.show()
Output:
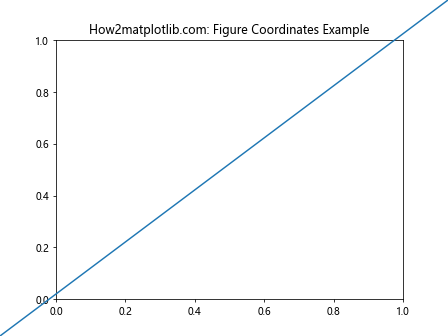
在这个例子中,我们使用fig.transFigure变换绘制了一条从图形坐标系的(0, 0)到(1, 1)的直线。这条线穿过了整个图形的对角线。
2.4 显示坐标系
显示坐标系是最底层的坐标系,它直接对应于屏幕上的像素。通常,我们不需要直接使用这个坐标系,但是了解它的存在有助于我们理解Matplotlib的工作原理。
import matplotlib.pyplot as plt
import matplotlib.transforms as transforms

fig, ax = plt.subplots()
ax.plot([100, 200], [100, 200], transform=None)
plt.title('How2matplotlib.com: Display Coordinates Example')
plt.show()
Output:
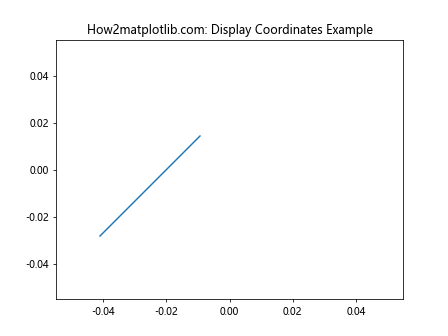
在这个例子中,我们通过设置transform=None来直接在显示坐标系中绘制。注意,这种方式通常不推荐使用,因为它会导致图形在不同大小的显示设备上看起来不一致。
3. get_transform()函数的工作原理
get_transform()函数返回一个变换对象,这个对象描述了如何将数据坐标转换为显示坐标。这个变换过程通常包含多个步骤:
- 数据坐标到轴坐标的变换
- 轴坐标到图形坐标的变换
- 图形坐标到显示坐标的变换
每个步骤都由一个变换对象来描述,这些变换对象可以组合在一起形成一个复合变换。
让我们通过一个例子来详细了解这个过程:
import matplotlib.pyplot as plt
import numpy as np

fig, ax = plt.subplots()
x = np.linspace(0, 10, 100)
y = np.sin(x)
ax.plot(x, y)

# 获取x轴的变换对象
x_transform = ax.xaxis.get_transform()

# 将数据坐标点(5, 0)转换为显示坐标
data_point = np.array([[5], [0]])
display_point = x_transform.transform(data_point)

print(f"Data point: {data_point.flatten()}")
print(f"Display point: {display_point.flatten()}")

plt.title('How2matplotlib.com: Coordinate Transform Example')
plt.show()
Output:
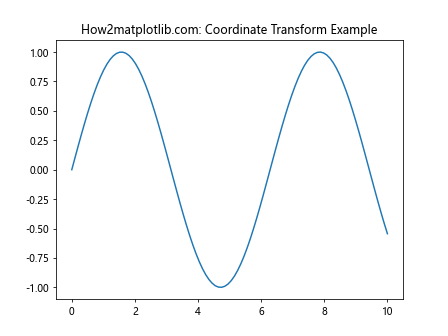
在这个例子中,我们首先绘制了一个简单的正弦曲线。然后,我们使用get_transform()获取了x轴的变换对象。接着,我们选择了数据坐标系中的点(5, 0),并使用变换对象将其转换为显示坐标。
这个过程展示了get_transform()返回的变换对象如何将数据坐标转换为显示坐标。理解这个过程对于进行更复杂的坐标变换操作非常重要。
4. get_transform()在自定义绘图中的应用
get_transform()函数在自定义绘图中有广泛的应用。它允许我们在不同的坐标系统中进行绘图,从而实现更复杂的可视化效果。
4.1 在数据坐标系中添加注释
最常见的应用之一是在数据坐标系中添加注释。例如:
import matplotlib.pyplot as plt
import numpy as np

fig, ax = plt.subplots()
x = np.linspace(0, 10, 100)
y = np.sin(x)
ax.plot(x, y)

# 在数据坐标(5, 0.5)处添加注释
ax.annotate('Peak', xy=(5, 0.5), xytext=(6, 0.8),
            arrowprops=dict(facecolor='black', shrink=0.05))

plt.title('How2matplotlib.com: Annotation in Data Coordinates')
plt.show()
Output:
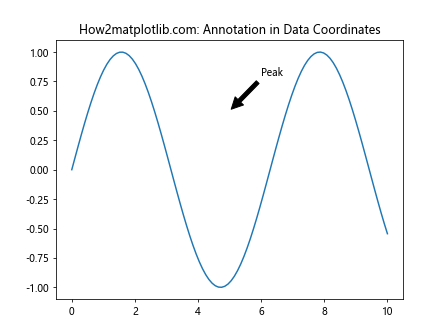
在这个例子中,我们在数据坐标(5, 0.5)处添加了一个注释。注释的位置和文本位置都是在数据坐标系中指定的。
4.2 在轴坐标系中添加文本
我们也可以使用get_transform()在轴坐标系中添加文本:
import matplotlib.pyplot as plt
import numpy as np

fig, ax = plt.subplots()
x = np.linspace(0, 10, 100)
y = np.sin(x)
ax.plot(x, y)

# 在轴坐标(0.5, 0.5)处添加文本
ax.text(0.5, 0.5, 'Center', transform=ax.transAxes, ha='center', va='center')

plt.title('How2matplotlib.com: Text in Axes Coordinates')
plt.show()
Output:
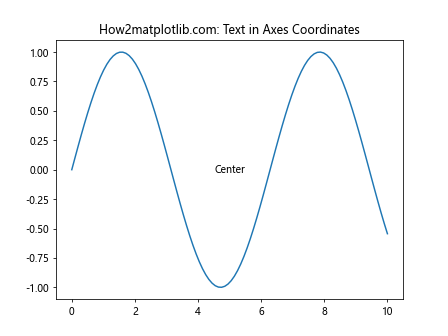
在这个例子中,我们使用ax.transAxes变换在轴坐标系的中心(0.5, 0.5)处添加了文本。
4.3 组合不同的坐标系
get_transform()还允许我们组合不同的坐标系,实现更复杂的效果:
import matplotlib.pyplot as plt
import matplotlib.transforms as transforms
import numpy as np

fig, ax = plt.subplots()
x = np.linspace(0, 10, 100)
y = np.sin(x)
ax.plot(x, y)

# 组合数据坐标系和轴坐标系
trans = transforms.blended_transform_factory(ax.transData, ax.transAxes)

# 在x轴数据坐标5处,y轴轴坐标0.5处添加文本
ax.text(5, 0.5, 'Blended', transform=trans, ha='center', va='center')

plt.title('How2matplotlib.com: Blended Coordinate System')
plt.show()
Output:
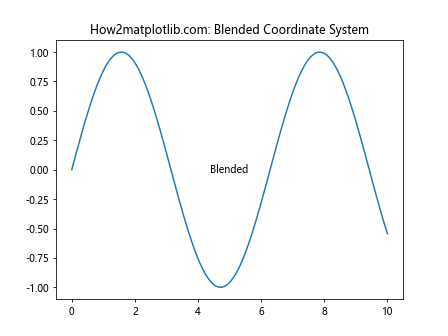
在这个例子中,我们使用blended_transform_factory创建了一个混合变换,它在x方向使用数据坐标,在y方向使用轴坐标。这允许我们在x轴的数据坐标5处,y轴的中间位置添加文本。
5. get_transform()与其他变换方法的比较
Matplotlib提供了多种变换方法,get_transform()是其中之一。让我们比较一下get_transform()与其他常用的变换方法。
5.1 get_transform() vs. transData
transData是Matplotlib中最常用的变换对象之一,它描述了从数据坐标到显示坐标的变换。实际上,get_transform()通常返回的就是transData或其变体。
import matplotlib.pyplot as plt
import numpy as np

fig, ax = plt.subplots()
x = np.linspace(0, 10, 100)
y = np.sin(x)
ax.plot(x, y)

# 使用get_transform()
transform1 = ax.xaxis.get_transform()

# 使用transData
transform2 = ax.transData

print("Are transforms equal?", transform1 == transform2)

plt.title('How2matplotlib.com: get_transform() vs. transData')
plt.show()
Output:
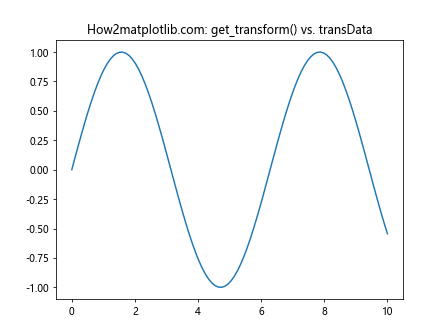
在这个例子中,我们比较了get_transform()返回的变换对象和transData。你会发现它们通常是相等的。
5.2 get_transform() vs. transAxes
transAxes描述了从轴坐标到显示坐标的变换。与get_transform()不同,transAxes总是将坐标归一化到0到1之间。
import matplotlib.pyplot as plt
import numpy as np

fig, ax = plt.subplots()
x = np.linspace(0, 10, 100)
y = np.sin(x)
ax.plot(x, y)

# 使用get_transform()
ax.text(5, 0.5, 'Data Coords', transform=ax.xaxis.get_transform())

# 使用transAxes
ax.text(0.5, 0.5, 'Axes Coords', transform=ax.transAxes)

plt.title('How2matplotlib.com: get_transform() vs. transAxes')
plt.show()
Output:
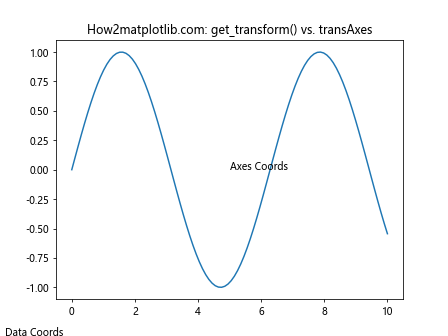
在这个例子中,我们使用get_transform()在数据坐标系中添加文本,使用transAxes在轴坐标系中添加文本。你会看到它们的位置是不同的。
5.3 get_transform() vs. transFigure
transFigure描述了从图形坐标到显示坐标的变换。与get_transform()不同,transFigure是相对于整个图形的,而不是相对于特定的轴。
import matplotlib.pyplot as plt
import numpy as np

fig, ax = plt.subplots()
x = np.linspace(0, 10, 100)
y = np.sin(x)
ax.plot(x, y)

# 使用get_transform()
ax.text(5, 0.5, 'Data Coords', transform=ax.xaxis.get_transform())

# 使用transFigure
fig.text(0.5, 0.5, 'Figure Coords', transform=fig.transFigure)

plt.title('How2matplotlib.com: get_transform() vs. transFigure')
plt.show()
Output:
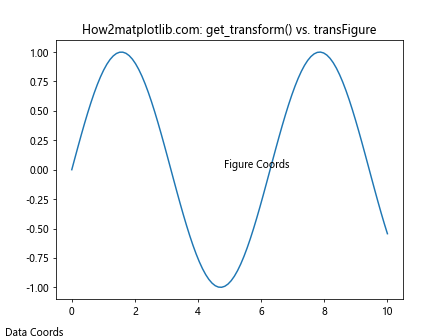
在这个例子中,我们使用get_transform()在数据坐标系中添加文本,使用transFigure在图形坐标系中添加文本。你会看到它们的位置是不同的。
6. get_transform()在复杂图形中的应用
get_transform()函数在创建复杂图形时特别有用,它允许我们精确控制图形元素的位置和大小。让我们看几个具体的应用场景。
6.1 创建自定义刻度标签
我们可以使用get_transform()来创建自定义的刻度标签,这在需要特殊格式或非线性刻度时非常有用。
import matplotlib.pyplot as plt
import numpy as np

fig, ax = plt.subplots()
x = np.linspace(0, 10, 100)
y = np.exp(x)
ax.plot(x, y)

# 获取y轴的变换对象
y_transform = ax.yaxis.get_transform()

# 创建自定义刻度标签
custom_ticks = [0, 100, 1000, 10000, 100000]
custom_positions = y_transform.transform(np.array(custom_ticks)[:, np.newaxis])

for tick, pos in zip(custom_ticks, custom_positions):
    ax.text(0, pos[0, 1], f'{tick}', transform=None, ha='right', va='center')

ax.set_yticks([])  # 移除原有的刻度
ax.set_ylim(0, 100000)

plt.title('How2matplotlib.com: Custom Tick Labels')
plt.show()
在这个例子中,我们使用get_transform()获取y轴的变换对象,然后用它来计算自定义刻度标签的位置。这允许我们创建一个对数刻度的y轴,但使用线性值作为标签。
6.2 创建复合坐标系
get_transform()还可以用来创建复合坐标系,这在需要在同一图形中使用不同坐标系的情况下非常有用。
import matplotlib.pyplot as plt
import matplotlib.transforms as transforms
import numpy as np

fig, ax = plt.subplots()
x = np.linspace(0, 10, 100)
y1 = np.sin(x)
y2 = np.cos(x)

ax.plot(x, y1, 'b-', label='sin(x)')
ax.plot(x, y2, 'r-', label='cos(x)')

# 创建一个复合变换
trans = transforms.blended_transform_factory(ax.transData, ax.transAxes)

# 在x轴数据坐标处,y轴使用轴坐标添加文本
for i in range(11):
    ax.text(i, 1.05, f'{i}', transform=trans, ha='center', va='bottom')

ax.set_ylim(-1.5, 1.5)
plt.legend()
plt.title('How2matplotlib.com: Compound Coordinate System')
plt.show()
Output:
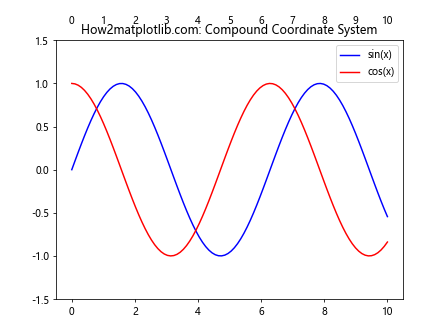
在这个例子中,我们创建了一个复合变换,它在x方向使用数据坐标,在y方向使用轴坐标。这允许我们在图形的顶部添加额外的刻度标签,而不受y轴数据范围的限制。
6.3 创建inset axes
get_transform()还可以用来创建inset axes(嵌入式坐标轴),这在需要在主图中显示局部放大图或额外信息时非常有用。
import matplotlib.pyplot as plt
import matplotlib.transforms as transforms
import numpy as np

fig, ax = plt.subplots()
x = np.linspace(0, 10, 1000)
y = np.sin(x) + np.random.normal(0, 0.1, 1000)
ax.plot(x, y)

# 创建inset axes
axins = ax.inset_axes([0.5, 0.5, 0.47, 0.47])
axins.plot(x, y)
axins.set_xlim(4, 6)
axins.set_ylim(-0.5, 0.5)

# 使用get_transform()来绘制连接线
transform = ax.transData + ax.transAxes.inverted()
corners = transform.transform([[4, -0.5], [6, 0.5]])
con = plt.ConnectionPatch(xyA=(4, -0.5), xyB=(0.5, 0.5), coordsA="data", coordsB="axes fraction",
                          axesA=axins, axesB=ax, color="gray")
ax.add_artist(con)
con = plt.ConnectionPatch(xyA=(6, 0.5), xyB=(0.97, 0.97), coordsA="data", coordsB="axes fraction",
                          axesA=axins, axesB=ax, color="gray")
ax.add_artist(con)

plt.title('How2matplotlib.com: Inset Axes with Connections')
plt.show()
在这个例子中,我们使用get_transform()来计算连接线的位置。这允许我们精确地将inset axes与主图中的相应区域连接起来。
7. get_transform()的高级应用
除了基本应用外,get_transform()还有一些高级应用,可以帮助我们创建更复杂和精细的图形。
7.1 创建自定义投影
get_transform()可以用来创建自定义的投影,这在地图绘制或特殊数据可视化中非常有用。
import matplotlib.pyplot as plt
import numpy as np
from matplotlib.transforms import Affine2D

class CustomProjection(plt.Axes):
    name = 'custom_projection'

    def __init__(self, *args, **kwargs):
        plt.Axes.__init__(self, *args, **kwargs)
        self.set_aspect('equal')

    def get_transform(self):
        return self.transData + Affine2D().rotate_deg(45)

fig = plt.figure()
ax = fig.add_subplot(111, projection=CustomProjection())

x = np.linspace(0, 10, 100)
y = np.sin(x)
ax.plot(x, y)

plt.title('How2matplotlib.com: Custom Projection')
plt.show()
在这个例子中,我们创建了一个自定义的投影,它将所有数据旋转45度。这是通过重写get_transform()方法实现的。
7.2 创建动态变换
get_transform()还可以用来创建动态变换,这在创建动画或交互式图形时非常有用。
import matplotlib.pyplot as plt
import numpy as np
from matplotlib.animation import FuncAnimation

fig, ax = plt.subplots()
x = np.linspace(0, 2*np.pi, 100)
line, = ax.plot(x, np.sin(x))

def animate(i):
    transform = ax.transData
    transform += Affine2D().rotate_deg(i)
    line.set_transform(transform)
    return line,

ani = FuncAnimation(fig, animate, frames=np.linspace(0, 360, 100),
                    interval=50, blit=True)

plt.title('How2matplotlib.com: Dynamic Transform')
plt.show()
在这个例子中,我们创建了一个动画,其中正弦曲线不断旋转。这是通过在每一帧中更新线条的变换实现的。
7.3 创建非线性坐标系
get_transform()还可以用来创建非线性坐标系,这在处理某些特殊类型的数据时非常有用。
import matplotlib.pyplot as plt
import numpy as np
from matplotlib.transforms import Affine2D

class LogTransform(Affine2D):
    def transform_non_affine(self, points):
        x, y = points.T
        return np.column_stack((np.log10(x), y))

fig, ax = plt.subplots()
x = np.logspace(0, 3, 100)
y = np.sin(x)

transform = LogTransform() + ax.transData
ax.plot(x, y, transform=transform)

ax.set_xscale('log')
plt.title('How2matplotlib.com: Non-linear Coordinate System')
plt.show()
Output:
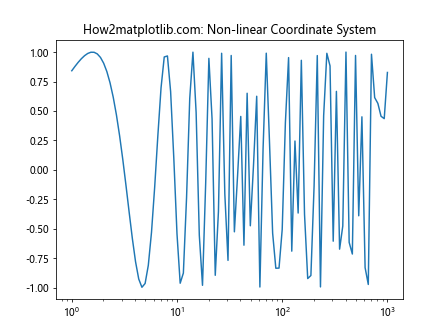
在这个例子中,我们创建了一个对数变换,并将其应用到x轴。这允许我们在对数尺度上绘制数据,但保持线性的视觉效果。
8. get_transform()的性能考虑
虽然get_transform()是一个强大的工具,但在使用时也需要考虑性能问题,特别是在处理大量数据或创建复杂图形时。
8.1 缓存变换对象
如果你需要多次使用同一个变换,最好将其缓存起来,而不是每次都调用get_transform()。
import matplotlib.pyplot as plt
import numpy as np
import time

fig, ax = plt.subplots()
x = np.linspace(0, 10, 1000)
y = np.sin(x)

# 缓存变换对象
transform = ax.xaxis.get_transform()

start_time = time.time()
for i in range(1000):
    ax.plot(x, y, transform=transform)
end_time = time.time()
print(f"Time with cached transform: {end_time - start_time}")

start_time = time.time()
for i in range(1000):
    ax.plot(x, y, transform=ax.xaxis.get_transform())
end_time = time.time()
print(f"Time without cached transform: {end_time - start_time}")

plt.title('How2matplotlib.com: Transform Caching')
plt.show()
Output:
在这个例子中,我们比较了使用缓存变换和每次都调用get_transform()的性能差异。你会发现,缓存变换可以显著提高性能。
8.2 使用简化的变换
在某些情况下,使用完整的get_transform()可能会引入不必要的复杂性。如果你只需要简单的坐标变换,可以考虑使用更简单的方法。
import matplotlib.pyplot as plt
import numpy as np

fig, ax = plt.subplots()
x = np.linspace(0, 10, 100)
y = np.sin(x)
ax.plot(x, y)

# 使用完整的get_transform()
ax.text(5, 0.5, 'Full Transform', transform=ax.xaxis.get_transform())

# 使用简化的变换
ax.text(5, 0.5, 'Simple Transform', transform=ax.transData)

plt.title('How2matplotlib.com: Simplified Transforms')
plt.show()
Output:
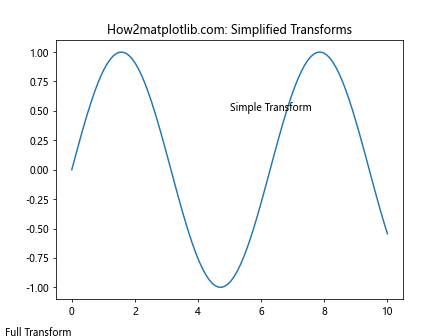
在这个例子中,我们比较了使用get_transform()和直接使用transData的效果。在许多情况下,它们的结果是相同的,但后者可能更简单和高效。
9. get_transform()的常见问题和解决方案
使用get_transform()时可能会遇到一些常见问题,让我们来看看如何解决它们。
9.1 坐标系不匹配
一个常见的问题是坐标系不匹配,这可能导致图形元素出现在意外的位置。
import matplotlib.pyplot as plt
import numpy as np

fig, ax = plt.subplots()
x = np.linspace(0, 10, 100)
y = np.sin(x)
ax.plot(x, y)

# 错误的用法
ax.text(0.5, 0.5, 'Wrong', transform=ax.transData)

# 正确的用法
ax.text(5, 0.5, 'Correct', transform=ax.transData)

plt.title('How2matplotlib.com: Coordinate System Mismatch')
plt.show()
Output:
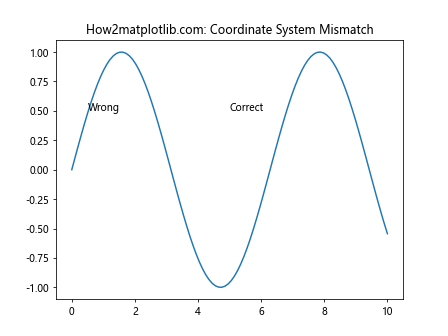
在这个例子中,第一个文本使用了错误的坐标系(轴坐标而不是数据坐标),导致它出现在错误的位置。第二个文本使用了正确的坐标系,因此出现在预期的位置。
9.2 变换顺序问题
另一个常见问题是变换的顺序不正确,这可能导致意外的结果。
import matplotlib.pyplot as plt
import numpy as np
from matplotlib.transforms import Affine2D

fig, ax = plt.subplots()
x = np.linspace(0, 10, 100)
y = np.sin(x)
ax.plot(x, y)

# 错误的顺序
transform1 = ax.transData + Affine2D().rotate_deg(45)
ax.text(5, 0.5, 'Wrong Order', transform=transform1, color='red')

# 正确的顺序
transform2 = Affine2D().rotate_deg(45) + ax.transData
ax.text(5, 0.5, 'Correct Order', transform=transform2, color='green')

plt.title('How2matplotlib.com: Transform Order Problem')
plt.show()
Output:
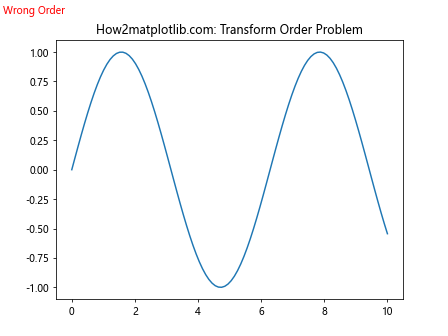
在这个例子中,第一个变换的顺序是错误的,导致文本被旋转到错误的位置。第二个变换的顺序是正确的,文本出现在预期的位置。
9.3 忘记应用变换
有时候,我们可能会忘记应用变换,导致图形元素出现在错误的位置。
import matplotlib.pyplot as plt
import numpy as np

fig, ax = plt.subplots()
x = np.linspace(0, 10, 100)
y = np.sin(x)
ax.plot(x, y)

# 忘记应用变换
ax.text(5, 0.5, 'Forgotten Transform', transform=None)

# 正确应用变换
ax.text(5, 0.5, 'Applied Transform', transform=ax.transData)

plt.title('How2matplotlib.com: Forgotten Transform')
plt.show()
Output:
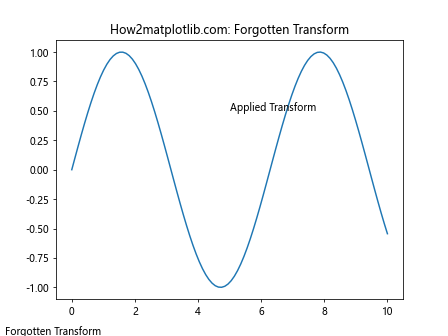
在这个例子中,第一个文本忘记应用变换,导致它出现在错误的位置(显示坐标而不是数据坐标)。第二个文本正确应用了变换,因此出现在预期的位置。
10. 总结
Axis.get_transform()是Matplotlib中一个强大而灵活的函数,它为我们提供了精确控制图形元素位置和大小的能力。通过本文的介绍,我们深入了解了这个函数的工作原理、应用场景以及一些高级用法。
以下是本文的主要要点:
get_transform()函数返回一个变换对象,该对象描述了如何将数据坐标转换为显示坐标。-
理解不同的坐标系(数据坐标系、轴坐标系、图形坐标系、显示坐标系)对于正确使用
get_transform()至关重要。 -
get_transform()在自定义绘图中有广泛的应用,如添加注释、创建自定义刻度标签、组合不同坐标系等。 -
与其他变换方法(如
transData、transAxes、transFigure)相比,get_transform()提供了更大的灵活性。 -
在复杂图形中,
get_transform()可以用于创建inset axes、自定义投影、动态变换和非线性坐标系。 -
使用
get_transform()时需要考虑性能问题,如缓存变换对象和使用简化的变换。 -
常见问题包括坐标系不匹配、变换顺序问题和忘记应用变换,了解这些问题及其解决方案可以帮助我们更好地使用
get_transform()。
通过掌握get_transform()函数,我们可以在Matplotlib中创建更复杂、更精确的可视化效果。无论是简单的数据图表还是复杂的科学可视化,get_transform()都是一个强大的工具。
 极客教程
极客教程