Matplotlib中的Axis.get_snap()函数:轴刻度对齐设置的获取与应用
参考:Matplotlib.axis.Axis.get_snap() function in Python
Matplotlib是Python中最流行的数据可视化库之一,它提供了丰富的绘图功能和自定义选项。在Matplotlib中,轴(Axis)是图表中的重要组成部分,它定义了数据的范围和刻度。Axis.get_snap()函数是Matplotlib库中axis模块的一个重要方法,用于获取轴刻度的对齐设置。本文将深入探讨Axis.get_snap()函数的用法、特性以及在实际绘图中的应用。
1. Axis.get_snap()函数简介
Axis.get_snap()是Matplotlib库中axis.Axis类的一个方法。这个函数的主要作用是获取轴的刻度对齐设置。刻度对齐(snap)是指将刻度线精确地对齐到像素边界的功能。当启用刻度对齐时,可以使图表看起来更加清晰和精确,特别是在打印或导出高分辨率图像时。
让我们通过一个简单的例子来了解如何使用get_snap()函数:
import matplotlib.pyplot as plt

# 创建一个简单的图表
fig, ax = plt.subplots()
ax.plot([1, 2, 3, 4], [1, 4, 2, 3], label='Data from how2matplotlib.com')

# 获取x轴的snap设置
x_snap = ax.xaxis.get_snap()
print(f"X-axis snap setting: {x_snap}")

# 获取y轴的snap设置
y_snap = ax.yaxis.get_snap()
print(f"Y-axis snap setting: {y_snap}")

plt.title('Demonstrating get_snap() in how2matplotlib.com')
plt.legend()
plt.show()
Output:
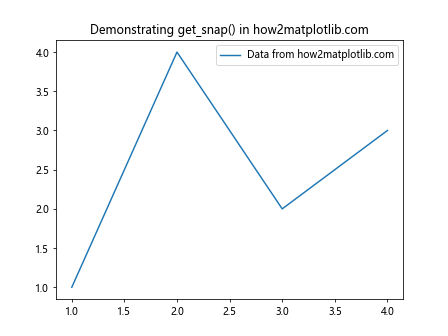
在这个例子中,我们创建了一个简单的线图,然后分别获取了x轴和y轴的snap设置。get_snap()函数返回一个布尔值,表示是否启用了刻度对齐。
2. 理解刻度对齐(Snap)的概念
刻度对齐是Matplotlib中一个微妙但重要的特性。当启用刻度对齐时,Matplotlib会尝试将刻度线精确地放置在像素边界上。这可以带来以下好处:
- 提高图表的清晰度,特别是在打印或导出高分辨率图像时。
- 减少由于抗锯齿造成的模糊效果。
- 使刻度线看起来更加锐利和精确。
然而,刻度对齐也可能导致刻度位置的微小偏移,这在某些情况下可能不是理想的。因此,了解如何控制和检查刻度对齐设置是很重要的。
让我们通过一个例子来演示刻度对齐的效果:
import matplotlib.pyplot as plt
import numpy as np

# 创建数据
x = np.linspace(0, 10, 100)
y = np.sin(x)

# 创建两个子图
fig, (ax1, ax2) = plt.subplots(1, 2, figsize=(12, 5))

# 第一个子图:不启用刻度对齐
ax1.plot(x, y, label='Sin curve from how2matplotlib.com')
ax1.set_title('Without Snap')
ax1.legend()

# 第二个子图:启用刻度对齐
ax2.plot(x, y, label='Sin curve from how2matplotlib.com')
ax2.set_title('With Snap')
ax2.xaxis.set_snap(True)
ax2.yaxis.set_snap(True)
ax2.legend()

# 打印snap设置
print(f"Ax1 x-axis snap: {ax1.xaxis.get_snap()}")
print(f"Ax1 y-axis snap: {ax1.yaxis.get_snap()}")
print(f"Ax2 x-axis snap: {ax2.xaxis.get_snap()}")
print(f"Ax2 y-axis snap: {ax2.yaxis.get_snap()}")

plt.tight_layout()
plt.show()
Output:
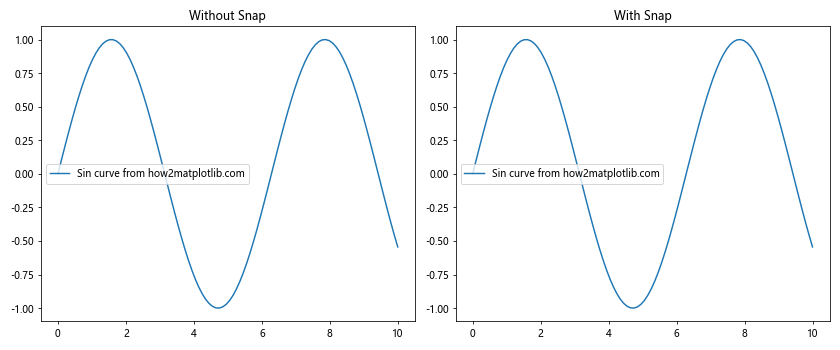
在这个例子中,我们创建了两个子图,一个不启用刻度对齐,另一个启用刻度对齐。通过比较这两个图,你可能会注意到刻度线的细微差别。我们还使用get_snap()函数打印了每个轴的snap设置。
3. Axis.get_snap()的返回值
Axis.get_snap()函数返回一个布尔值:
- 如果返回
True,表示刻度对齐已启用。 - 如果返回
False,表示刻度对齐未启用。
默认情况下,Matplotlib通常不启用刻度对齐,因此get_snap()通常返回False。
让我们通过一个例子来验证这一点:
import matplotlib.pyplot as plt

# 创建一个简单的图表
fig, ax = plt.subplots()
ax.plot([1, 2, 3, 4], [1, 4, 2, 3], label='Data from how2matplotlib.com')

# 获取并打印x轴和y轴的snap设置
print(f"Default X-axis snap: {ax.xaxis.get_snap()}")
print(f"Default Y-axis snap: {ax.yaxis.get_snap()}")

# 启用x轴的snap
ax.xaxis.set_snap(True)

# 再次获取并打印snap设置
print(f"After setting, X-axis snap: {ax.xaxis.get_snap()}")
print(f"After setting, Y-axis snap: {ax.yaxis.get_snap()}")

plt.title('Demonstrating get_snap() in how2matplotlib.com')
plt.legend()
plt.show()
Output:
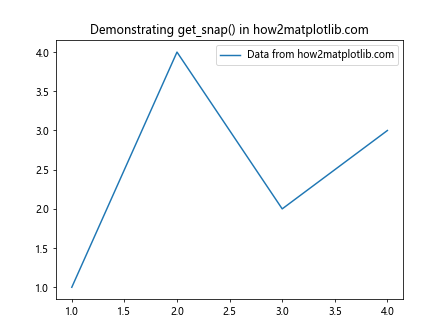
在这个例子中,我们首先打印了默认的snap设置,然后使用set_snap(True)启用了x轴的刻度对齐,并再次打印设置以查看变化。
4. 何时使用Axis.get_snap()
Axis.get_snap()函数主要在以下情况下使用:
- 调试:当你想确认某个轴的刻度对齐设置时。
- 条件逻辑:在绘图脚本中,你可能需要根据当前的snap设置来决定后续的操作。
- 自动化绘图:在批量生成图表时,你可能需要检查和记录每个图表的snap设置。
- 自定义绘图函数:当你创建自己的绘图函数时,可能需要考虑snap设置。
让我们通过一个例子来说明如何在条件逻辑中使用get_snap():
import matplotlib.pyplot as plt
import numpy as np

def plot_with_snap_check(x, y, snap_threshold=0.5):
    fig, ax = plt.subplots()
    ax.plot(x, y, label='Data from how2matplotlib.com')

    # 检查x轴的snap设置
    if ax.xaxis.get_snap():
        print("X-axis snap is already enabled.")
    else:
        # 根据数据范围决定是否启用snap
        data_range = np.ptp(x)
        if data_range > snap_threshold:
            ax.xaxis.set_snap(True)
            print(f"Enabled X-axis snap (data range: {data_range:.2f})")
        else:
            print(f"X-axis snap not needed (data range: {data_range:.2f})")

    plt.title('Snap setting based on data range - how2matplotlib.com')
    plt.legend()
    plt.show()

# 使用函数
x1 = np.linspace(0, 1, 100)
y1 = np.sin(2 * np.pi * x1)
plot_with_snap_check(x1, y1)

x2 = np.linspace(0, 10, 100)
y2 = np.sin(2 * np.pi * x2)
plot_with_snap_check(x2, y2)
Output:

在这个例子中,我们创建了一个函数plot_with_snap_check,它根据数据的范围来决定是否启用x轴的刻度对齐。函数首先检查当前的snap设置,然后根据数据范围和预设的阈值来决定是否需要启用snap。
5. Axis.get_snap()与其他轴设置的关系
Axis.get_snap()函数与其他轴设置函数密切相关。了解这些关系可以帮助我们更好地控制图表的外观和精确度。以下是一些相关的轴设置函数:
Axis.set_snap(self, snap): 设置轴的刻度对齐。Axis.get_major_locator(): 获取主刻度定位器。Axis.get_minor_locator(): 获取次刻度定位器。Axis.get_major_formatter(): 获取主刻度格式化器。Axis.get_minor_formatter(): 获取次刻度格式化器。
让我们通过一个例子来展示这些函数之间的关系:
import matplotlib.pyplot as plt
import matplotlib.ticker as ticker

# 创建一个简单的图表
fig, ax = plt.subplots()
ax.plot([1, 2, 3, 4], [1, 4, 2, 3], label='Data from how2matplotlib.com')

# 获取并打印各种轴设置
print(f"Snap setting: {ax.xaxis.get_snap()}")
print(f"Major locator: {ax.xaxis.get_major_locator()}")
print(f"Minor locator: {ax.xaxis.get_minor_locator()}")
print(f"Major formatter: {ax.xaxis.get_major_formatter()}")
print(f"Minor formatter: {ax.xaxis.get_minor_formatter()}")

# 修改一些设置
ax.xaxis.set_snap(True)
ax.xaxis.set_major_locator(ticker.MultipleLocator(0.5))
ax.xaxis.set_minor_locator(ticker.MultipleLocator(0.1))

# 再次打印设置
print("\nAfter modifications:")
print(f"Snap setting: {ax.xaxis.get_snap()}")
print(f"Major locator: {ax.xaxis.get_major_locator()}")
print(f"Minor locator: {ax.xaxis.get_minor_locator()}")

plt.title('Axis settings demonstration - how2matplotlib.com')
plt.legend()
plt.show()
Output:
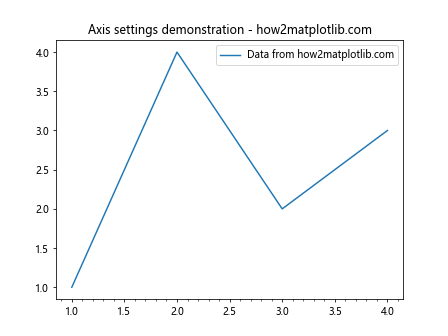
在这个例子中,我们首先打印了默认的轴设置,然后修改了一些设置,包括启用snap和更改刻度定位器。这展示了get_snap()函数与其他轴设置函数的协同工作。
6. Axis.get_snap()在不同类型图表中的应用
Axis.get_snap()函数可以应用于Matplotlib支持的各种类型的图表。不同类型的图表可能对刻度对齐有不同的需求。让我们探讨一下在不同类型的图表中如何使用和检查snap设置。
6.1 线图中的应用
线图是最常见的图表类型之一,通常用于展示连续数据的趋势。在线图中,刻度对齐可以帮助提高图表的精确度,特别是当你需要精确读取数据点的值时。
import matplotlib.pyplot as plt
import numpy as np

# 创建数据
x = np.linspace(0, 10, 100)
y = np.sin(x)

# 创建线图
fig, ax = plt.subplots()
ax.plot(x, y, label='Sine wave from how2matplotlib.com')

# 检查并设置snap
print(f"Initial X-axis snap: {ax.xaxis.get_snap()}")
ax.xaxis.set_snap(True)
print(f"After setting, X-axis snap: {ax.xaxis.get_snap()}")

plt.title('Line Plot with Snap - how2matplotlib.com')
plt.legend()
plt.show()
Output:
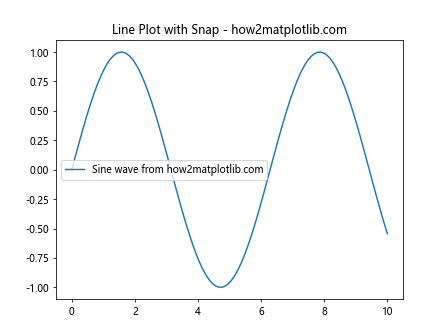
在这个例子中,我们创建了一个简单的正弦波线图,并演示了如何检查和设置x轴的snap。
6.2 散点图中的应用
散点图用于展示两个变量之间的关系。在散点图中,刻度对齐可以帮助更准确地定位每个数据点。
import matplotlib.pyplot as plt
import numpy as np

# 创建数据
x = np.random.rand(50)
y = 2 * x + np.random.rand(50)

# 创建散点图
fig, ax = plt.subplots()
ax.scatter(x, y, label='Random data from how2matplotlib.com')

# 检查并设置snap
print(f"Initial Y-axis snap: {ax.yaxis.get_snap()}")
ax.yaxis.set_snap(True)
print(f"After setting, Y-axis snap: {ax.yaxis.get_snap()}")

plt.title('Scatter Plot with Snap - how2matplotlib.com')
plt.legend()
plt.show()
Output:
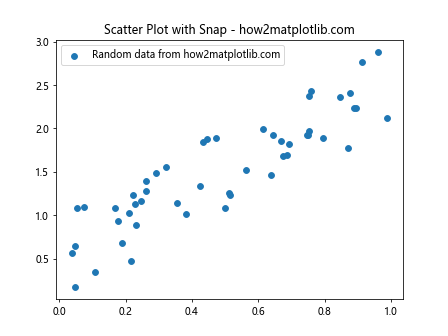
在这个散点图例子中,我们关注了y轴的snap设置,这可能有助于更精确地读取y值。
6.3 柱状图中的应用
柱状图通常用于比较不同类别的数值。在柱状图中,刻度对齐可以帮助更准确地表示每个柱子的高度。
import matplotlib.pyplot as plt
import numpy as np

# 创建数据
categories = ['A', 'B', 'C', 'D', 'E']
values = np.random.randint(1, 10, 5)

# 创建柱状图
fig, ax = plt.subplots()
ax.bar(categories,values, label='Data from how2matplotlib.com')

# 检查并设置snap
print(f"Initial Y-axis snap: {ax.yaxis.get_snap()}")
ax.yaxis.set_snap(True)
print(f"After setting, Y-axis snap: {ax.yaxis.get_snap()}")

plt.title('Bar Plot with Snap - how2matplotlib.com')
plt.legend()
plt.show()
Output:
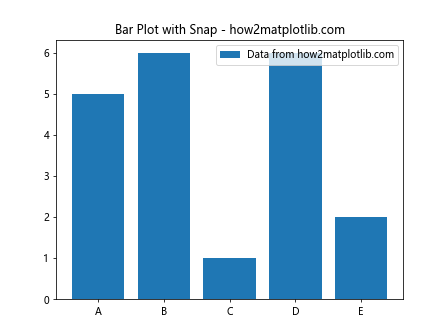
在这个柱状图例子中,我们设置了y轴的snap,这可以帮助更精确地表示每个柱子的高度。
6.4 饼图中的应用
饼图用于展示部分与整体的关系。虽然饼图通常不使用传统的x轴和y轴,但get_snap()仍然可以应用于径向轴。
import matplotlib.pyplot as plt

# 创建数据
sizes = [15, 30, 45, 10]
labels = ['A', 'B', 'C', 'D']

# 创建饼图
fig, ax = plt.subplots()
ax.pie(sizes, labels=labels, autopct='%1.1f%%', startangle=90)

# 检查snap设置
print(f"X-axis snap: {ax.xaxis.get_snap()}")
print(f"Y-axis snap: {ax.yaxis.get_snap()}")

plt.title('Pie Chart - how2matplotlib.com')
plt.axis('equal')  # 确保饼图是圆的
plt.show()
Output:
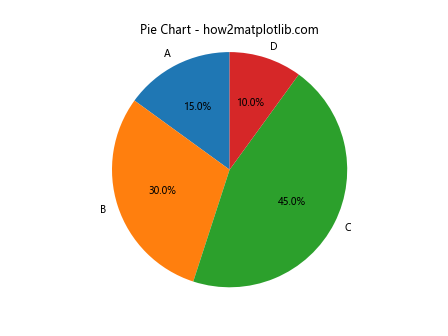
在饼图中,snap设置可能不会直接影响图表的外观,但了解这些设置仍然是有用的。
7. Axis.get_snap()与图表精度的关系
Axis.get_snap()函数与图表的精度密切相关。当启用snap时,刻度线会精确对齐到像素边界,这可能会影响数据的表示精度。理解这种关系对于创建高质量的图表非常重要。
让我们通过一个例子来探讨snap设置对图表精度的影响:
import matplotlib.pyplot as plt
import numpy as np

# 创建精确的数据
x = np.linspace(0, 1, 11)
y = x**2

# 创建两个子图
fig, (ax1, ax2) = plt.subplots(1, 2, figsize=(12, 5))

# 第一个子图:不启用snap
ax1.plot(x, y, 'o-', label='Data from how2matplotlib.com')
ax1.set_title('Without Snap')
ax1.legend()

# 第二个子图:启用snap
ax2.plot(x, y, 'o-', label='Data from how2matplotlib.com')
ax2.set_title('With Snap')
ax2.xaxis.set_snap(True)
ax2.yaxis.set_snap(True)
ax2.legend()

# 打印snap设置和刻度位置
print(f"Ax1 x-axis snap: {ax1.xaxis.get_snap()}")
print(f"Ax1 x-ticks: {ax1.get_xticks()}")
print(f"Ax2 x-axis snap: {ax2.xaxis.get_snap()}")
print(f"Ax2 x-ticks: {ax2.get_xticks()}")

plt.tight_layout()
plt.show()
Output:
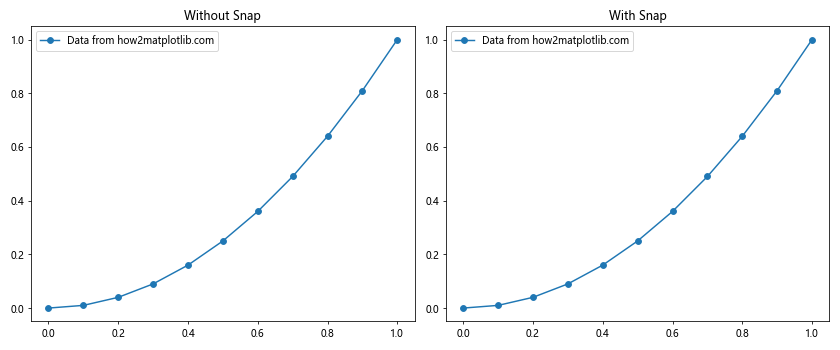
在这个例子中,我们创建了两个子图,一个启用snap,一个不启用。通过比较两个图的刻度位置,你可能会注意到微小的差异。这些差异虽然很小,但在需要高精度的科学或工程应用中可能很重要。
8. Axis.get_snap()在自定义绘图函数中的应用
当创建自定义绘图函数时,考虑snap设置可以增加函数的灵活性和适用性。以下是一个示例,展示如何在自定义函数中使用get_snap():
import matplotlib.pyplot as plt
import numpy as np

def custom_plot(x, y, enable_snap=False, ax=None):
    if ax is None:
        fig, ax = plt.subplots()

    ax.plot(x, y, label='Data from how2matplotlib.com')

    # 检查当前snap设置
    current_snap = ax.xaxis.get_snap()
    print(f"Current X-axis snap: {current_snap}")

    # 根据参数设置snap
    if enable_snap and not current_snap:
        ax.xaxis.set_snap(True)
        print("Enabled X-axis snap")
    elif not enable_snap and current_snap:
        ax.xaxis.set_snap(False)
        print("Disabled X-axis snap")

    ax.set_title('Custom Plot - how2matplotlib.com')
    ax.legend()
    return ax

# 使用自定义函数
x = np.linspace(0, 10, 100)
y = np.sin(x)

fig, (ax1, ax2) = plt.subplots(1, 2, figsize=(12, 5))

custom_plot(x, y, enable_snap=False, ax=ax1)
custom_plot(x, y, enable_snap=True, ax=ax2)

plt.tight_layout()
plt.show()
Output:
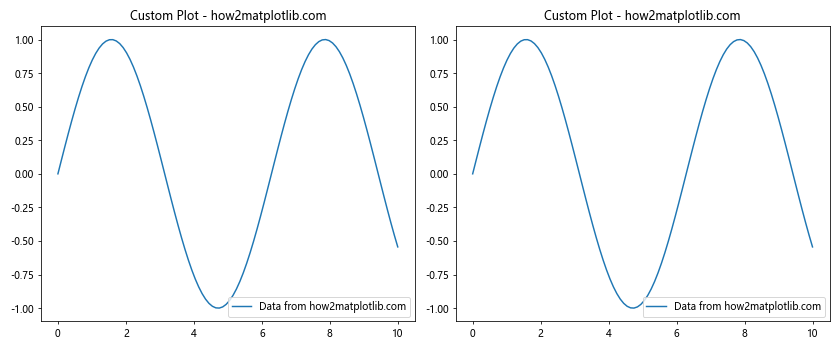
在这个例子中,我们创建了一个自定义函数custom_plot,它可以根据参数启用或禁用snap。这种方法允许我们在不同的情况下灵活地控制snap设置。
9. Axis.get_snap()与图表导出和打印的关系
Axis.get_snap()函数的设置对图表的导出和打印质量有直接影响。当需要生成高质量的图表用于出版或演示时,正确的snap设置可以确保刻度线清晰可辨。
让我们通过一个例子来探讨如何在导出高分辨率图像时使用snap设置:
import matplotlib.pyplot as plt
import numpy as np

# 创建数据
x = np.linspace(0, 10, 100)
y = np.sin(x)

# 创建图表
fig, ax = plt.subplots(figsize=(8, 6), dpi=300)
ax.plot(x, y, label='Sine wave from how2matplotlib.com')

# 设置snap
ax.xaxis.set_snap(True)
ax.yaxis.set_snap(True)

# 检查snap设置
print(f"X-axis snap: {ax.xaxis.get_snap()}")
print(f"Y-axis snap: {ax.yaxis.get_snap()}")

plt.title('High Resolution Plot for Export - how2matplotlib.com')
plt.legend()

# 保存高分辨率图像
plt.savefig('high_res_plot.png', dpi=300, bbox_inches='tight')
plt.show()
Output:
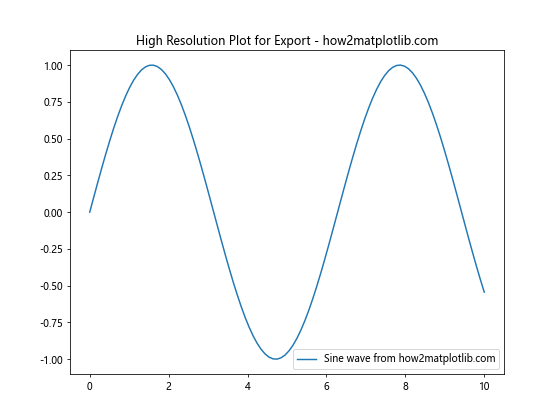
在这个例子中,我们创建了一个高分辨率的图表,并启用了x轴和y轴的snap。这有助于确保导出的图像中的刻度线清晰锐利。
10. Axis.get_snap()在动态图表中的应用
在创建动态或交互式图表时,get_snap()函数可以用来检查和调整刻度对齐设置。这在实时更新的图表中特别有用,可以确保图表在变化过程中保持一致的外观。
以下是一个简单的动态图表示例,展示了如何在更新过程中使用get_snap():
import matplotlib.pyplot as plt
import numpy as np
from matplotlib.animation import FuncAnimation

# 初始化图表
fig, ax = plt.subplots()
line, = ax.plot([], [], label='Dynamic data from how2matplotlib.com')
ax.set_xlim(0, 10)
ax.set_ylim(-1, 1)

# 初始化snap设置
ax.xaxis.set_snap(True)
ax.yaxis.set_snap(True)

def init():
    print(f"Initial X-axis snap: {ax.xaxis.get_snap()}")
    print(f"Initial Y-axis snap: {ax.yaxis.get_snap()}")
    return line,

def update(frame):
    x = np.linspace(0, frame, 100)
    y = np.sin(x)
    line.set_data(x, y)

    # 每5帧切换snap设置
    if frame % 5 == 0:
        new_snap = not ax.xaxis.get_snap()
        ax.xaxis.set_snap(new_snap)
        ax.yaxis.set_snap(new_snap)
        print(f"Frame {frame}: Changed snap to {new_snap}")

    return line,

ani = FuncAnimation(fig, update, frames=np.linspace(0, 10, 50),
                    init_func=init, blit=True)

plt.title('Dynamic Plot with Changing Snap - how2matplotlib.com')
plt.legend()
plt.show()
Output:
在这个动态图表例子中,我们每隔5帧就切换一次snap设置。这展示了如何在动态环境中使用get_snap()和set_snap()来控制图表的外观。
结论
Axis.get_snap()函数是Matplotlib中一个看似简单但功能强大的工具。它允许我们检查和控制轴刻度的对齐设置,这对于创建高质量、精确的图表至关重要。通过本文的详细探讨,我们了解了get_snap()函数的基本用法、在不同类型图表中的应用、与图表精度的关系,以及在自定义函数和动态图表中的使用方法。
正确使用get_snap()函数可以帮助我们创建更加专业和精确的数据可视化。无论是进行科学研究、数据分析还是创建商业报告,了解和利用这个函数都能为我们的图表添加一层额外的精确度和专业性。
在实际应用中,建议根据具体需求和图表类型来决定是否启用snap。对于需要高精度的科学图表,启用snap可能是个好选择;而对于一些概览性的图表,可能不需要这么精确的刻度对齐。无论如何,get_snap()函数为我们提供了一个简单的方法来检查和控制这一重要的图表设置。
 极客教程
极客教程