Matplotlib中的Axis.get_sketch_params()函数详解与应用
参考:Matplotlib.axis.Axis.get_sketch_params() function in Python
Matplotlib是Python中最流行的数据可视化库之一,它提供了丰富的绘图功能和自定义选项。在Matplotlib中,Axis.get_sketch_params()函数是一个重要的方法,用于获取轴的草图参数。本文将深入探讨这个函数的用法、参数和应用场景,帮助读者更好地理解和使用它来增强数据可视化效果。
1. Axis.get_sketch_params()函数简介
Axis.get_sketch_params()是Matplotlib库中axis.Axis类的一个方法。这个函数用于获取轴的草图参数,这些参数控制了轴线的绘制风格,使其呈现出手绘或草图的效果。通过调用这个函数,我们可以获取当前轴的草图参数设置,包括缩放、长度和随机性。
让我们从一个简单的例子开始:
import matplotlib.pyplot as plt

fig, ax = plt.subplots()
ax.set_title("how2matplotlib.com - Basic Axis Example")
ax.set_xlabel("X-axis")
ax.set_ylabel("Y-axis")

# 获取x轴的草图参数
sketch_params = ax.xaxis.get_sketch_params()
print("X-axis sketch parameters:", sketch_params)

plt.show()
Output:
在这个例子中,我们创建了一个简单的图表,并获取了x轴的草图参数。通常情况下,如果没有特别设置,get_sketch_params()会返回None,表示没有应用草图效果。
2. 草图参数的组成
get_sketch_params()函数返回的草图参数是一个包含三个元素的元组,或者是None。这三个元素分别是:
- 缩放(scale):控制草图效果的整体强度。
- 长度(length):控制草图线条的长度。
- 随机性(randomness):控制草图效果的随机程度。
让我们通过一个例子来设置和获取这些参数:
import matplotlib.pyplot as plt

fig, ax = plt.subplots()
ax.set_title("how2matplotlib.com - Sketch Parameters Example")

# 设置x轴的草图参数
ax.xaxis.set_sketch_params(scale=1, length=100, randomness=0.1)

# 获取并打印草图参数
sketch_params = ax.xaxis.get_sketch_params()
print("X-axis sketch parameters:", sketch_params)

plt.show()
Output:
在这个例子中,我们首先设置了x轴的草图参数,然后使用get_sketch_params()获取这些参数。输出将显示我们设置的值。
3. 应用草图效果
虽然get_sketch_params()函数本身不会改变轴的外观,但它通常与set_sketch_params()函数一起使用,以创建有趣的视觉效果。让我们看一个例子,展示如何应用和获取草图效果:
import matplotlib.pyplot as plt
import numpy as np

fig, (ax1, ax2) = plt.subplots(2, 1, figsize=(8, 10))
fig.suptitle("how2matplotlib.com - Sketch Effect Comparison")

x = np.linspace(0, 10, 100)
y = np.sin(x)

# 普通轴
ax1.plot(x, y)
ax1.set_title("Normal Axis")

# 带草图效果的轴
ax2.plot(x, y)
ax2.set_title("Sketchy Axis")
ax2.set_sketch_params(scale=5, length=100, randomness=0.1)

# 获取并打印两个轴的草图参数
print("Normal axis sketch params:", ax1.get_sketch_params())
print("Sketchy axis sketch params:", ax2.get_sketch_params())

plt.tight_layout()
plt.show()
Output:
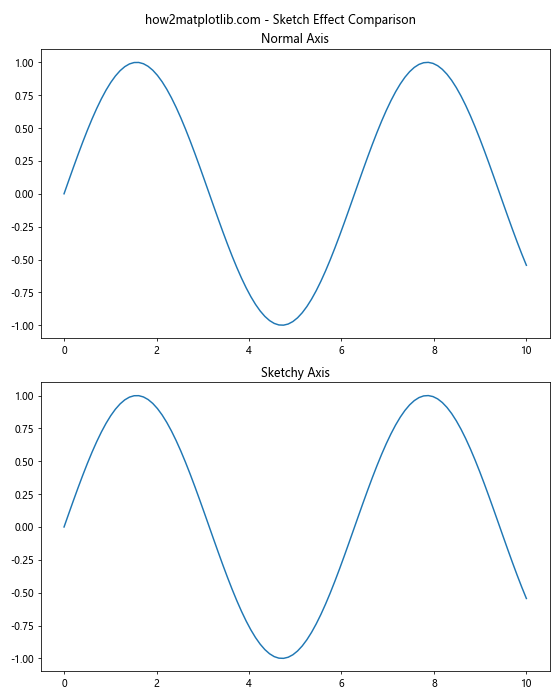
在这个例子中,我们创建了两个子图:一个使用普通轴,另一个应用了草图效果。通过比较get_sketch_params()的返回值,我们可以看到两者的区别。
4. 动态调整草图参数
get_sketch_params()函数的一个重要用途是在绘图过程中动态检查和调整草图参数。以下是一个演示如何根据当前参数动态调整草图效果的例子:
import matplotlib.pyplot as plt
import numpy as np

fig, ax = plt.subplots()
ax.set_title("how2matplotlib.com - Dynamic Sketch Adjustment")

x = np.linspace(0, 10, 100)
y = np.sin(x)
line, = ax.plot(x, y)

# 初始草图参数
initial_params = (1, 50, 0.05)
ax.set_sketch_params(*initial_params)

# 获取当前参数并调整
current_params = ax.get_sketch_params()
if current_params:
    scale, length, randomness = current_params
    new_params = (scale * 1.5, length * 1.2, randomness * 1.1)
    ax.set_sketch_params(*new_params)

print("Initial sketch params:", initial_params)
print("Adjusted sketch params:", ax.get_sketch_params())

plt.show()
Output:
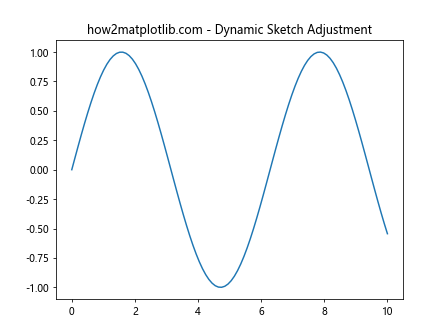
这个例子展示了如何获取当前的草图参数,并基于这些参数进行调整。这种方法在创建交互式图表或动画时特别有用。
5. 不同轴的草图参数
在Matplotlib中,每个轴(x轴、y轴)都可以有自己的草图参数。让我们看一个例子,展示如何为不同的轴设置和获取不同的草图参数:
import matplotlib.pyplot as plt
import numpy as np

fig, ax = plt.subplots()
ax.set_title("how2matplotlib.com - Different Axis Sketch Params")

x = np.linspace(0, 10, 100)
y = np.sin(x)
ax.plot(x, y)

# 设置不同轴的草图参数
ax.xaxis.set_sketch_params(scale=3, length=80, randomness=0.1)
ax.yaxis.set_sketch_params(scale=1, length=120, randomness=0.2)

# 获取并打印不同轴的草图参数
x_params = ax.xaxis.get_sketch_params()
y_params = ax.yaxis.get_sketch_params()

print("X-axis sketch params:", x_params)
print("Y-axis sketch params:", y_params)

plt.show()
Output:
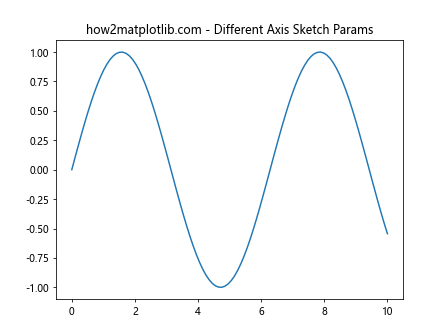
这个例子展示了如何为x轴和y轴设置不同的草图参数,并使用get_sketch_params()获取这些参数。
6. 草图效果在不同图表类型中的应用
草图效果不仅可以应用于简单的线图,还可以用于各种类型的图表。让我们看几个在不同图表类型中应用和获取草图参数的例子:
6.1 柱状图
import matplotlib.pyplot as plt
import numpy as np

fig, ax = plt.subplots()
ax.set_title("how2matplotlib.com - Bar Chart with Sketch Effect")

categories = ['A', 'B', 'C', 'D']
values = [3, 7, 2, 5]

bars = ax.bar(categories, values)

# 为整个轴设置草图参数
ax.set_sketch_params(scale=2, length=100, randomness=0.1)

# 获取并打印草图参数
sketch_params = ax.get_sketch_params()
print("Bar chart sketch params:", sketch_params)

plt.show()
Output:
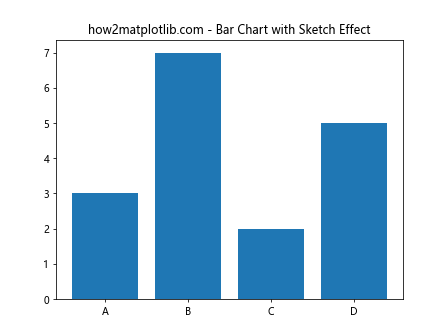
在这个柱状图例子中,我们为整个轴设置了草图参数,给图表一个手绘的外观。
6.2 散点图
import matplotlib.pyplot as plt
import numpy as np

fig, ax = plt.subplots()
ax.set_title("how2matplotlib.com - Scatter Plot with Sketch Effect")

x = np.random.rand(50)
y = np.random.rand(50)

scatter = ax.scatter(x, y)

# 为x轴和y轴设置不同的草图参数
ax.xaxis.set_sketch_params(scale=1, length=80, randomness=0.2)
ax.yaxis.set_sketch_params(scale=2, length=60, randomness=0.1)

# 获取并打印x轴和y轴的草图参数
x_params = ax.xaxis.get_sketch_params()
y_params = ax.yaxis.get_sketch_params()

print("X-axis sketch params:", x_params)
print("Y-axis sketch params:", y_params)

plt.show()
Output:
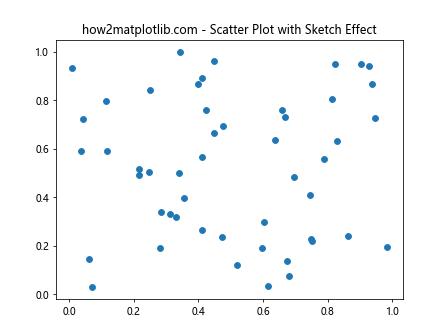
这个散点图例子展示了如何为x轴和y轴设置不同的草图参数,创造出独特的视觉效果。
7. 草图参数与其他样式设置的结合
get_sketch_params()函数可以与其他样式设置结合使用,以创建更复杂和有趣的视觉效果。让我们看一个例子,展示如何将草图效果与其他样式设置结合:
import matplotlib.pyplot as plt
import numpy as np

fig, ax = plt.subplots(figsize=(10, 6))
ax.set_title("how2matplotlib.com - Combined Style Example")

x = np.linspace(0, 10, 100)
y1 = np.sin(x)
y2 = np.cos(x)

# 绘制两条线并设置不同的样式
line1, = ax.plot(x, y1, color='blue', linestyle='--', linewidth=2, label='Sin')
line2, = ax.plot(x, y2, color='red', linestyle=':', linewidth=2, label='Cos')

# 设置草图参数
ax.set_sketch_params(scale=3, length=100, randomness=0.1)

# 添加网格线并设置其样式
ax.grid(True, linestyle='-.', alpha=0.5)

# 设置背景颜色
ax.set_facecolor('#f0f0f0')

# 添加图例
ax.legend()

# 获取并打印草图参数
sketch_params = ax.get_sketch_params()
print("Combined style sketch params:", sketch_params)

plt.show()
Output:
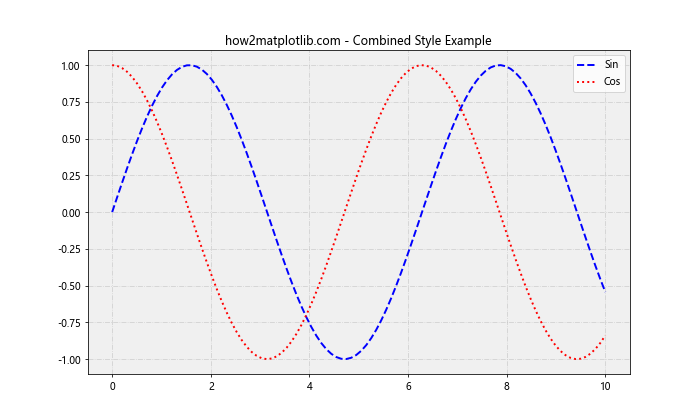
在这个例子中,我们结合了多种样式设置,包括线条样式、颜色、网格线和背景颜色,同时应用了草图效果。get_sketch_params()函数让我们能够确认应用的草图参数。
8. 在子图中使用草图参数
当使用子图时,我们可以为每个子图单独设置和获取草图参数。这允许在同一个图形中创建不同的视觉效果。让我们看一个例子:
import matplotlib.pyplot as plt
import numpy as np

fig, (ax1, ax2) = plt.subplots(1, 2, figsize=(12, 5))
fig.suptitle("how2matplotlib.com - Subplots with Different Sketch Params")

x = np.linspace(0, 10, 100)
y = np.sin(x)

# 第一个子图
ax1.plot(x, y)
ax1.set_title("Subplot 1")
ax1.set_sketch_params(scale=2, length=80, randomness=0.1)

# 第二个子图
ax2.plot(x, y)
ax2.set_title("Subplot 2")
ax2.set_sketch_params(scale=4, length=120, randomness=0.2)

# 获取并打印每个子图的草图参数
params1 = ax1.get_sketch_params()
params2 = ax2.get_sketch_params()

print("Subplot 1 sketch params:", params1)
print("Subplot 2 sketch params:", params2)

plt.tight_layout()
plt.show()
Output:
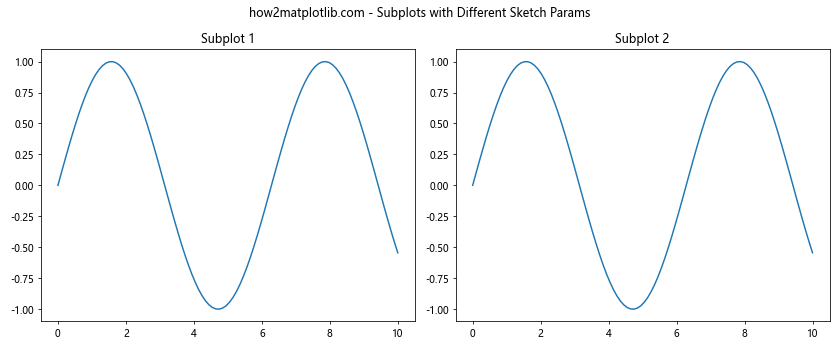
这个例子创建了两个子图,每个子图都有不同的草图参数设置。通过使用get_sketch_params(),我们可以确认每个子图的具体设置。
9. 草图参数在动画中的应用
get_sketch_params()函数在创建动画时也非常有用,特别是当我们想要动态改变草图效果时。以下是一个简单的动画例子,展示如何在动画中使用和调整草图参数:
import matplotlib.pyplot as plt
import matplotlib.animation as animation
import numpy as np

fig, ax = plt.subplots()
ax.set_title("how2matplotlib.com - Animated Sketch Effect")

x = np.linspace(0, 2 * np.pi, 100)
line, = ax.plot(x, np.sin(x))

def animate(frame):
    y = np.sin(x + frame / 10)
    line.set_ydata(y)

    # 动态调整草图参数
    scale = 1 + frame % 5
    ax.set_sketch_params(scale=scale, length=100, randomness=0.1)

    # 获取并打印当前帧的草图参数
    current_params = ax.get_sketch_params()
    print(f"Frame {frame} sketch params: {current_params}")

    return line,

ani = animation.FuncAnimation(fig, animate, frames=50, interval=100, blit=True)

plt.show()
Output:
在这个动画例子中,我们在每一帧都调整草图参数,并使用get_sketch_params()获取当前的参数值。这允许我们创建一个草图效果随时间变化的动画。
10. 草图参数与自定义样式表的结合
Matplotlib允许使用自定义样式表来设置图表的整体外观。我们可以将草图参数与这些自定义样式结合使用。以下是一个示例:
import matplotlib.pyplot as plt
import numpy as np

# 创建一个自定义样式
plt.style.use({
    'axes.facecolor': '#f0f0f0',
    ''axes.edgecolor': '#606060',
    'axes.labelcolor': '#606060',
    'xtick.color': '#606060',
    'ytick.color': '#606060',
    'grid.color': '#b0b0b0',
    'figure.facecolor': 'white',
    'lines.linewidth': 2,
})

fig, ax = plt.subplots()
ax.set_title("how2matplotlib.com - Custom Style with Sketch Effect")

x = np.linspace(0, 10, 100)
y = np.sin(x)

ax.plot(x, y)
ax.grid(True, linestyle='--', alpha=0.7)

# 设置草图参数
ax.set_sketch_params(scale=3, length=100, randomness=0.1)

# 获取并打印草图参数
sketch_params = ax.get_sketch_params()
print("Custom style sketch params:", sketch_params)

plt.show()
在这个例子中,我们首先定义了一个自定义样式,然后应用草图效果。get_sketch_params()函数让我们能够确认应用的草图参数,即使在使用自定义样式的情况下。
11. 草图参数在3D图表中的应用
虽然草图效果主要用于2D图表,但我们也可以在3D图表中应用它。以下是一个在3D图表中使用草图参数的例子:
import matplotlib.pyplot as plt
import numpy as np
from mpl_toolkits.mplot3d import Axes3D

fig = plt.figure()
ax = fig.add_subplot(111, projection='3d')
ax.set_title("how2matplotlib.com - 3D Plot with Sketch Effect")

# 生成数据
x = np.linspace(-5, 5, 100)
y = np.linspace(-5, 5, 100)
X, Y = np.meshgrid(x, y)
Z = np.sin(np.sqrt(X**2 + Y**2))

# 绘制3D表面
surf = ax.plot_surface(X, Y, Z, cmap='viridis')

# 设置草图参数
ax.set_sketch_params(scale=2, length=80, randomness=0.1)

# 获取并打印草图参数
sketch_params = ax.get_sketch_params()
print("3D plot sketch params:", sketch_params)

plt.show()
Output:
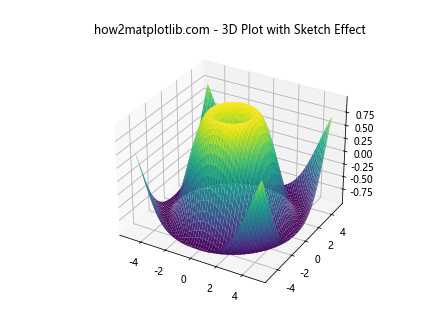
在这个3D图表例子中,我们应用了草图效果并使用get_sketch_params()获取参数。请注意,草图效果在3D图表中的表现可能与2D图表有所不同。
12. 草图参数与颜色映射的结合
我们可以将草图效果与颜色映射(colormap)结合使用,创造出独特的视觉效果。以下是一个例子:
import matplotlib.pyplot as plt
import numpy as np

fig, ax = plt.subplots()
ax.set_title("how2matplotlib.com - Sketch Effect with Colormap")

# 生成数据
x = np.linspace(0, 10, 100)
y = np.linspace(0, 10, 100)
X, Y = np.meshgrid(x, y)
Z = np.sin(X) * np.cos(Y)

# 绘制等高线图
contour = ax.contourf(X, Y, Z, cmap='coolwarm')

# 添加颜色条
plt.colorbar(contour)

# 设置草图参数
ax.set_sketch_params(scale=3, length=100, randomness=0.1)

# 获取并打印草图参数
sketch_params = ax.get_sketch_params()
print("Colormap plot sketch params:", sketch_params)

plt.show()
Output:
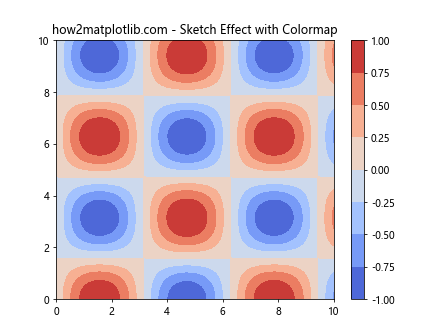
在这个例子中,我们创建了一个带有颜色映射的等高线图,并应用了草图效果。get_sketch_params()函数让我们能够确认应用的草图参数。
13. 在极坐标图中使用草图参数
草图效果也可以应用于极坐标图。以下是一个在极坐标图中使用和获取草图参数的例子:
import matplotlib.pyplot as plt
import numpy as np

fig, ax = plt.subplots(subplot_kw=dict(projection='polar'))
ax.set_title("how2matplotlib.com - Polar Plot with Sketch Effect")

# 生成数据
r = np.linspace(0, 2, 100)
theta = 4 * np.pi * r

# 绘制极坐标图
ax.plot(theta, r)

# 设置草图参数
ax.set_sketch_params(scale=2, length=80, randomness=0.1)

# 获取并打印草图参数
sketch_params = ax.get_sketch_params()
print("Polar plot sketch params:", sketch_params)

plt.show()
Output:
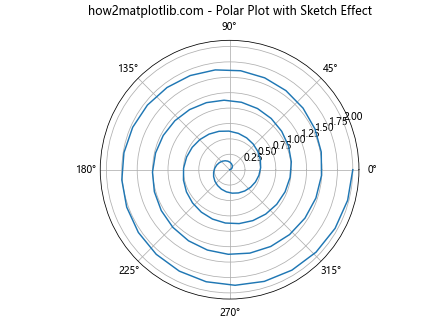
这个例子展示了如何在极坐标图中应用草图效果,并使用get_sketch_params()获取应用的参数。
14. 草图参数在图例中的应用
虽然get_sketch_params()主要用于轴,但草图效果也可以影响图例的外观。以下是一个在图例中应用草图效果的例子:
import matplotlib.pyplot as plt
import numpy as np

fig, ax = plt.subplots()
ax.set_title("how2matplotlib.com - Legend with Sketch Effect")

x = np.linspace(0, 10, 100)
y1 = np.sin(x)
y2 = np.cos(x)

# 绘制两条线
line1, = ax.plot(x, y1, label='Sin')
line2, = ax.plot(x, y2, label='Cos')

# 添加图例
legend = ax.legend()

# 设置草图参数(会影响整个轴,包括图例)
ax.set_sketch_params(scale=3, length=100, randomness=0.1)

# 获取并打印草图参数
sketch_params = ax.get_sketch_params()
print("Plot with legend sketch params:", sketch_params)

plt.show()
Output:
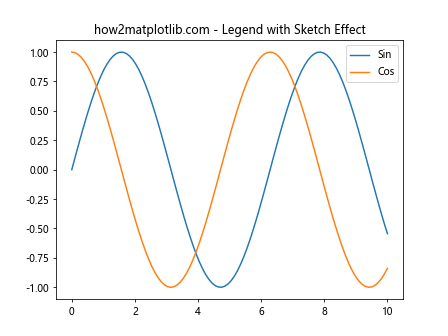
在这个例子中,草图效果应用于整个轴,包括图例。get_sketch_params()函数返回应用于整个轴的参数。
15. 在箱线图中使用草图参数
箱线图是另一种可以应用草图效果的图表类型。以下是一个在箱线图中使用和获取草图参数的例子:
import matplotlib.pyplot as plt
import numpy as np

fig, ax = plt.subplots()
ax.set_title("how2matplotlib.com - Box Plot with Sketch Effect")

# 生成数据
data = [np.random.normal(0, std, 100) for std in range(1, 4)]

# 创建箱线图
box_plot = ax.boxplot(data)

# 设置草图参数
ax.set_sketch_params(scale=2, length=80, randomness=0.1)

# 获取并打印草图参数
sketch_params = ax.get_sketch_params()
print("Box plot sketch params:", sketch_params)

plt.show()
Output:
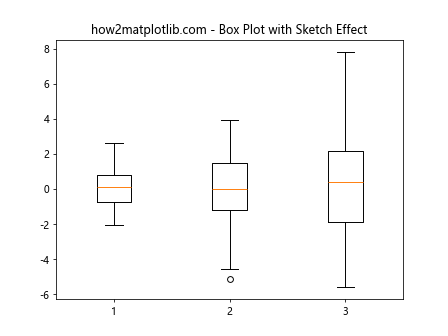
这个例子展示了如何在箱线图中应用草图效果,并使用get_sketch_params()获取应用的参数。
结论
通过本文的详细探讨,我们深入了解了Matplotlib中Axis.get_sketch_params()函数的用法和应用场景。这个函数不仅允许我们获取当前的草图参数设置,还为创建独特的视觉效果提供了基础。
我们看到了如何在各种图表类型中应用草图效果,包括线图、柱状图、散点图、3D图表和极坐标图等。我们还探讨了如何将草图效果与其他样式设置结合,以及在动画和自定义样式中的应用。
get_sketch_params()函数的灵活性使其成为Matplotlib中一个强大的工具,能够帮助数据科学家和可视化专家创建既信息丰富又视觉吸引的图表。通过调整草图参数,我们可以为图表添加独特的手绘风格,使数据展示更加生动有趣。
在实际应用中,合理使用草图效果可以增强图表的视觉吸引力,但也要注意不要过度使用,以免影响数据的清晰度和可读性。结合get_sketch_params()和set_sketch_params()函数,我们可以精确控制和调整图表的草图效果,创造出既专业又富有创意的数据可视化作品。
 极客教程
极客教程