Matplotlib中的Axis.get_major_locator()函数:轻松获取主刻度定位器
参考:Matplotlib.axis.Axis.get_major_locator() function in Python
Matplotlib是Python中最流行的数据可视化库之一,它提供了丰富的绘图功能和自定义选项。在Matplotlib中,轴(Axis)是图表中的重要组成部分,它负责管理刻度、标签和其他轴相关的属性。本文将深入探讨Matplotlib中的Axis.get_major_locator()函数,这是一个用于获取轴主刻度定位器的重要方法。
1. Axis.get_major_locator()函数简介
Axis.get_major_locator()是Matplotlib库中axis.Axis类的一个方法。这个函数的主要作用是获取当前轴的主刻度定位器(Major Locator)。主刻度定位器决定了轴上主刻度的位置,这对于控制图表的刻度显示非常重要。
让我们从一个简单的例子开始:
import matplotlib.pyplot as plt
import numpy as np

# 创建一个简单的图表
fig, ax = plt.subplots()
x = np.linspace(0, 10, 100)
ax.plot(x, np.sin(x))

# 获取x轴的主刻度定位器
major_locator = ax.xaxis.get_major_locator()
print(f"X轴主刻度定位器: {major_locator}")

plt.title("how2matplotlib.com - get_major_locator() 示例")
plt.show()
Output:
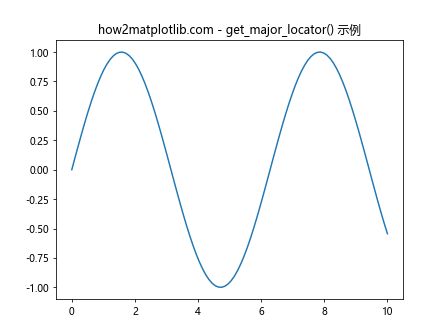
在这个例子中,我们创建了一个简单的正弦曲线图,然后使用get_major_locator()方法获取了x轴的主刻度定位器。默认情况下,Matplotlib会自动选择一个合适的定位器。
2. 主刻度定位器的类型
Matplotlib提供了多种类型的主刻度定位器,每种定位器都有其特定的用途。以下是一些常见的定位器类型:
MultipleLocator: 以固定间隔设置刻度。MaxNLocator: 尝试选择最佳的刻度位置,限制刻度的最大数量。AutoLocator: 自动选择合适的刻度位置(默认)。LinearLocator: 在给定的范围内均匀分布刻度。LogLocator: 为对数刻度设置刻度。FixedLocator: 在指定位置设置刻度。
让我们通过一些例子来了解如何使用get_major_locator()并识别不同类型的定位器。
2.1 MultipleLocator示例
import matplotlib.pyplot as plt
from matplotlib.ticker import MultipleLocator
import numpy as np

fig, ax = plt.subplots()
x = np.linspace(0, 10, 100)
ax.plot(x, np.sin(x))

# 设置MultipleLocator
ax.xaxis.set_major_locator(MultipleLocator(base=2))

# 获取并打印定位器
locator = ax.xaxis.get_major_locator()
print(f"定位器类型: {type(locator)}")

plt.title("how2matplotlib.com - MultipleLocator 示例")
plt.show()
Output:
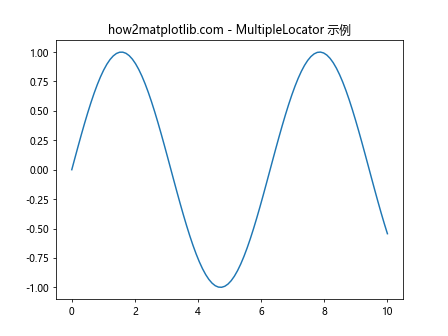
在这个例子中,我们使用MultipleLocator将x轴的主刻度间隔设置为2。然后,我们使用get_major_locator()获取定位器并打印其类型。
2.2 MaxNLocator示例
import matplotlib.pyplot as plt
from matplotlib.ticker import MaxNLocator
import numpy as np

fig, ax = plt.subplots()
x = np.linspace(0, 10, 100)
ax.plot(x, np.sin(x))

# 设置MaxNLocator
ax.xaxis.set_major_locator(MaxNLocator(nbins=5))

# 获取并打印定位器
locator = ax.xaxis.get_major_locator()
print(f"定位器类型: {type(locator)}")

plt.title("how2matplotlib.com - MaxNLocator 示例")
plt.show()
Output:
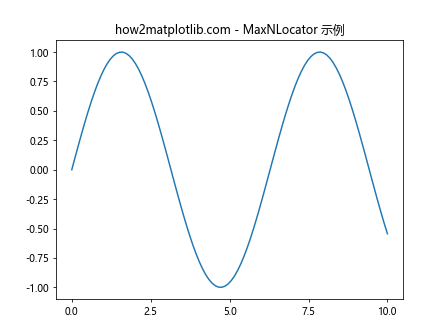
这个例子展示了如何使用MaxNLocator来限制x轴上主刻度的最大数量。我们将其设置为5个刻度,然后使用get_major_locator()获取并打印定位器类型。
3. 使用get_major_locator()进行自定义
get_major_locator()不仅可以用于获取当前的定位器,还可以与其他方法结合使用,实现更复杂的自定义效果。以下是一些高级用法示例:
3.1 修改现有定位器的参数
import matplotlib.pyplot as plt
from matplotlib.ticker import MultipleLocator
import numpy as np

fig, ax = plt.subplots()
x = np.linspace(0, 10, 100)
ax.plot(x, np.sin(x))

# 获取当前定位器
current_locator = ax.xaxis.get_major_locator()

# 如果是MultipleLocator,修改其base值
if isinstance(current_locator, MultipleLocator):
    current_locator.base = 1.5

plt.title("how2matplotlib.com - 修改定位器参数")
plt.show()
Output:
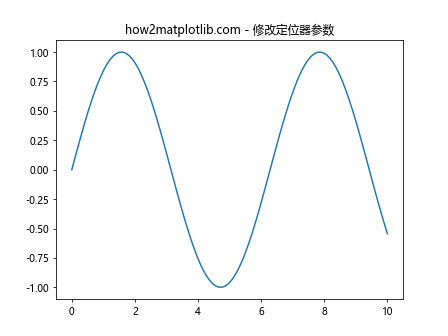
在这个例子中,我们首先获取当前的定位器,然后检查它是否为MultipleLocator类型。如果是,我们就修改其base值,从而改变刻度的间隔。
3.2 根据定位器类型应用不同的格式化
import matplotlib.pyplot as plt
from matplotlib.ticker import MultipleLocator, MaxNLocator
import numpy as np

fig, (ax1, ax2) = plt.subplots(2, 1, figsize=(8, 8))
x = np.linspace(0, 10, 100)

ax1.plot(x, np.sin(x))
ax1.xaxis.set_major_locator(MultipleLocator(base=2))

ax2.plot(x, np.cos(x))
ax2.xaxis.set_major_locator(MaxNLocator(nbins=6))

for ax in (ax1, ax2):
    locator = ax.xaxis.get_major_locator()
    if isinstance(locator, MultipleLocator):
        ax.set_xlabel("MultipleLocator (间隔: {})".format(locator.base))
    elif isinstance(locator, MaxNLocator):
        ax.set_xlabel("MaxNLocator (最大刻度数: {})".format(locator.nbins))

plt.suptitle("how2matplotlib.com - 根据定位器类型应用格式")
plt.tight_layout()
plt.show()
这个例子展示了如何根据不同的定位器类型应用不同的标签格式。我们创建了两个子图,分别使用MultipleLocator和MaxNLocator,然后根据定位器类型设置不同的x轴标签。
4. get_major_locator()在数据分析中的应用
在实际的数据分析和可视化过程中,get_major_locator()函数可以帮助我们更好地理解和控制图表的刻度显示。以下是一些实际应用的例子:
4.1 时间序列数据的刻度调整
import matplotlib.pyplot as plt
import pandas as pd
from matplotlib.dates import AutoDateLocator, DateFormatter

# 创建示例时间序列数据
dates = pd.date_range(start='2023-01-01', end='2023-12-31', freq='D')
values = pd.Series(range(len(dates)), index=dates)

fig, ax = plt.subplots(figsize=(12, 6))
ax.plot(dates, values)

# 获取并设置日期定位器
date_locator = ax.xaxis.get_major_locator()
if isinstance(date_locator, AutoDateLocator):
    date_locator.intervald['month'] = 1  # 每月显示一个刻度

# 设置日期格式化器
ax.xaxis.set_major_formatter(DateFormatter('%Y-%m-%d'))

plt.title("how2matplotlib.com - 时间序列数据刻度调整")
plt.xticks(rotation=45)
plt.tight_layout()
plt.show()
Output:
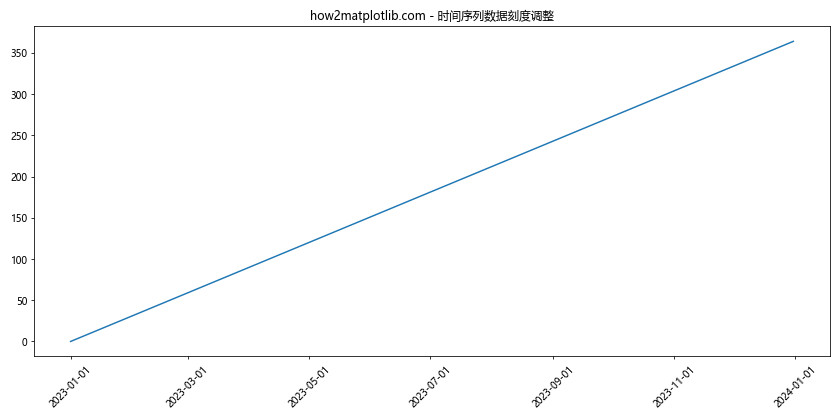
在这个例子中,我们处理了一个时间序列数据。通过获取当前的日期定位器,我们可以调整其参数,使刻度每月显示一次。这种方法在处理长时间跨度的数据时特别有用。
4.2 对数刻度的定位器调整
import matplotlib.pyplot as plt
import numpy as np
from matplotlib.ticker import LogLocator

fig, ax = plt.subplots()
x = np.logspace(0, 5, 100)
ax.plot(x, x**2)

ax.set_xscale('log')
ax.set_yscale('log')

# 获取并调整对数定位器
x_locator = ax.xaxis.get_major_locator()
y_locator = ax.yaxis.get_major_locator()

if isinstance(x_locator, LogLocator):
    x_locator.base = 10
    x_locator.numticks = 6

if isinstance(y_locator, LogLocator):
    y_locator.base = 10
    y_locator.numticks = 8

plt.title("how2matplotlib.com - 对数刻度定位器调整")
plt.show()
Output:
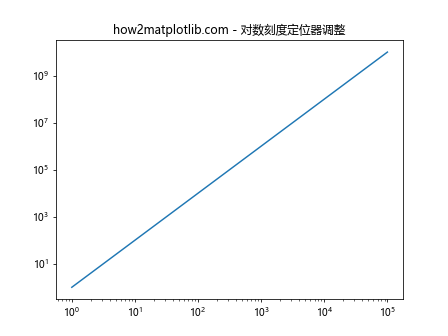
这个例子展示了如何在对数刻度图中调整定位器。我们首先创建一个对数-对数图,然后获取x轴和y轴的定位器。如果它们是LogLocator类型,我们就调整其基数和刻度数量。
5. get_major_locator()与其他Axis方法的配合使用
get_major_locator()函数通常与其他Axis方法一起使用,以实现更复杂的刻度控制。以下是一些常见的组合用法:
5.1 结合get_major_formatter()使用
import matplotlib.pyplot as plt
import numpy as np
from matplotlib.ticker import MultipleLocator, FuncFormatter

fig, ax = plt.subplots()
x = np.linspace(0, 10, 100)
ax.plot(x, np.sin(x))

# 设置定位器
ax.xaxis.set_major_locator(MultipleLocator(base=2))

# 获取定位器和格式化器
locator = ax.xaxis.get_major_locator()
formatter = ax.xaxis.get_major_formatter()

# 自定义格式化函数
def custom_formatter(x, pos):
    return f"x={x:.1f}"

# 如果是MultipleLocator,设置自定义格式化器
if isinstance(locator, MultipleLocator):
    ax.xaxis.set_major_formatter(FuncFormatter(custom_formatter))

plt.title("how2matplotlib.com - 定位器和格式化器配合使用")
plt.show()
Output:
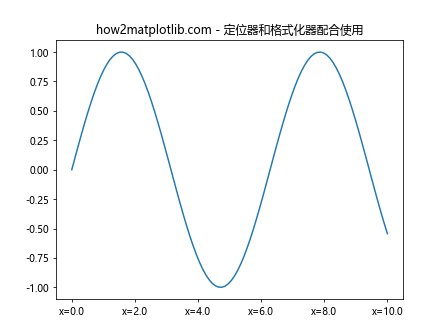
在这个例子中,我们结合使用了get_major_locator()和get_major_formatter()。我们首先设置了一个MultipleLocator,然后根据定位器的类型设置了一个自定义的格式化器。
5.2 与set_ticks()和set_ticklabels()配合
import matplotlib.pyplot as plt
import numpy as np

fig, ax = plt.subplots()
x = np.linspace(0, 10, 100)
ax.plot(x, np.sin(x))

# 获取当前定位器
locator = ax.xaxis.get_major_locator()

# 获取定位器生成的刻度位置
ticks = locator.tick_values(0, 10)

# 自定义刻度标签
labels = [f"Point {i}" for i in range(len(ticks))]

# 设置刻度和标签
ax.set_xticks(ticks)
ax.set_xticklabels(labels, rotation=45, ha='right')

plt.title("how2matplotlib.com - 自定义刻度和标签")
plt.tight_layout()
plt.show()
Output:
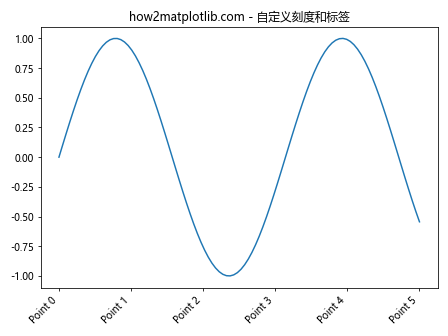
这个例子展示了如何使用get_major_locator()获取刻度位置,然后使用set_xticks()和set_xticklabels()来自定义刻度和标签。
6. get_major_locator()在不同类型图表中的应用
get_major_locator()函数在各种类型的图表中都有广泛的应用。以下是一些在不同图表类型中使用该函数的例子:
6.1 在柱状图中调整刻度
import matplotlib.pyplot as plt
import numpy as np
from matplotlib.ticker import MaxNLocator

categories = ['A', 'B', 'C', 'D', 'E']
values = np.random.randint(1, 100, size=5)

fig, ax = plt.subplots()
ax.bar(categories, values)

# 获取并调整y轴定位器
y_locator = ax.yaxis.get_major_locator()
if isinstance(y_locator, MaxNLocator):
    y_locator.set_params(integer=True)  # 只显示整数刻度

plt.title("how2matplotlib.com - 柱状图刻度调整")
plt.show()
Output:
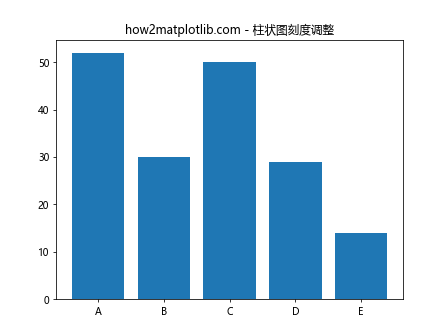
在这个柱状图例子中,我们使用get_major_locator()获取y轴的定位器,并将其设置为只显示整数刻度,这对于显示计数或整数数据特别有用。
6.2 在散点图中自定义刻度
import matplotlib.pyplot as plt
import numpy as np
from matplotlib.ticker import MultipleLocator

x = np.random.rand(50) * 10
y = np.random.rand(50) * 10

fig, ax = plt.subplots()
ax.scatter(x, y)

# 获取并调整x轴和y轴定位器
x_locator = ax.xaxis.get_major_locator()
y_locator = ax.yaxis.get_major_locator()

if isinstance(x_locator, MultipleLocator):
    x_locator.set_params(base=2)
if isinstance(y_locator, MultipleLocator):
    y_locator.set_params(base=2)

plt.title("how2matplotlib.com - 散点图刻度自定义")
plt.show()
Output:
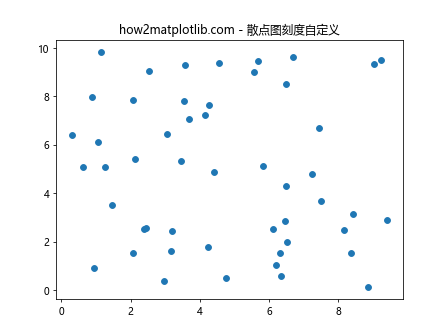
在这个散点图例子中,我们分别获取了x轴和y轴的定位器,并将它们的间隔设置为2。这样可以使散点图的刻度更加清晰和规整。
6.3 在折线图中处理日期刻度
import matplotlib.pyplot as plt
import pandas as pd
from matplotlib.dates import AutoDateLocator, DateFormatter

# 创建示例时间序列数据
dates = pd.date_range(start='2023-01-01', end='2023-12-31', freq='D')
values = pd.Series(np.random.randn(len(dates)).cumsum(), index=dates)

fig, ax = plt.subplots(figsize=(12, 6))
ax.plot(dates, values)

# 获取并调整日期定位器
date_locator = ax.xaxis.get_major_locator()
if isinstance(date_locator, AutoDateLocator):
    date_locator.intervald['month'] = 3  # 每三个月显示一个刻度

# 设置日期格式化器
ax.xaxis.set_major_formatter(DateFormatter('%Y-%m'))

plt.title("how2matplotlib.com - 折线图日期刻度处理")
plt.xticks(rotation=45)
plt.tight_layout()
plt.show()
这个例子展示了如何在折线图中处理日期刻度。我们使用get_major_locator()获取日期定位器,并将其设置为每三个月显示一个刻度,这对于长时间序列数据的可视化非常有用。
7. get_major_locator()的高级技巧
除了基本用法外,get_major_locator()还有一些高级技巧可以帮助我们更好地控制图表的刻度显示。
7.1 动态调整刻度密度
import matplotlib.pyplot as plt
import numpy as np
from matplotlib.ticker import AutoLocator

fig, ax = plt.subplots()
x = np.linspace(0, 100, 1000)
y = np.sin(x)

ax.plot(x, y)

# 获取自动定位器
auto_locator = ax.xaxis.get_major_locator()

if isinstance(auto_locator, AutoLocator):
    # 根据数据范围动态调整刻度数量
    data_range = x.max() - x.min()
    if data_range > 50:
        auto_locator.set_params(nbins=20)
    else:
        auto_locator.set_params(nbins=10)

plt.title("how2matplotlib.com - 动态调整刻度密度")
plt.show()
Output:
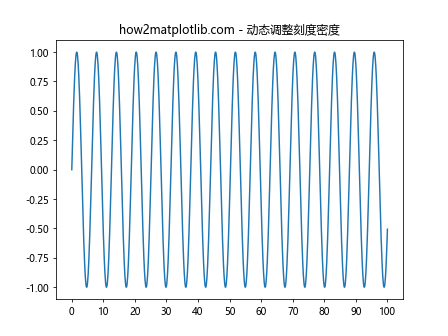
这个例子展示了如何根据数据的范围动态调整刻度的密度。我们首先获取自动定位器,然后根据数据的范围设置不同的刻度数量。
7.2 组合多个定位器
import matplotlib.pyplot as plt
import numpy as np
from matplotlib.ticker import MultipleLocator, AutoMinorLocator

fig, ax = plt.subplots()
x = np.linspace(0, 10, 100)
ax.plot(x, np.sin(x))

# 获取并设置主刻度定位器
major_locator = ax.xaxis.get_major_locator()
if isinstance(major_locator, MultipleLocator):
    major_locator.set_params(base=2)

# 设置次刻度定位器
ax.xaxis.set_minor_locator(AutoMinorLocator())

plt.title("how2matplotlib.com - 组合多个定位器")
plt.grid(which='both', linestyle='--', alpha=0.7)
plt.show()
Output:
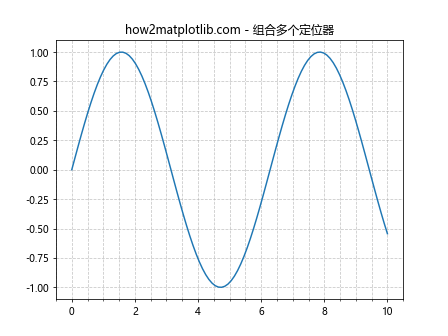
这个例子展示了如何组合使用主刻度定位器和次刻度定位器。我们首先获取并调整主刻度定位器,然后添加一个自动次刻度定位器,以创建更详细的刻度显示。
7.3 自定义定位器
import matplotlib.pyplot as plt
import numpy as np
from matplotlib.ticker import Locator

class CustomLocator(Locator):
    def __init__(self, base=1.0):
        self.base = base

    def __call__(self):
        vmin, vmax = self.axis.get_view_interval()
        return np.arange(np.ceil(vmin / self.base) * self.base,
                         np.floor(vmax / self.base) * self.base + 0.5 * self.base,
                         self.base)

fig, ax = plt.subplots()
x = np.linspace(0, 10, 100)
ax.plot(x, np.sin(x))

# 设置自定义定位器
ax.xaxis.set_major_locator(CustomLocator(base=1.5))

# 获取并打印定位器类型
locator = ax.xaxis.get_major_locator()
print(f"定位器类型: {type(locator)}")

plt.title("how2matplotlib.com - 自定义定位器")
plt.show()
Output:
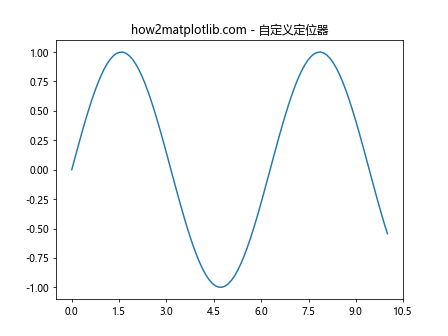
这个例子展示了如何创建和使用自定义定位器。我们定义了一个CustomLocator类,它可以以指定的间隔生成刻度。然后我们使用set_major_locator()设置这个自定义定位器,并用get_major_locator()验证它的类型。
8. get_major_locator()的常见问题和解决方案
在使用get_major_locator()函数时,可能会遇到一些常见问题。以下是一些问题及其解决方案:
8.1 刻度重叠问题
import matplotlib.pyplot as plt
import numpy as np
from matplotlib.ticker import MaxNLocator

fig, ax = plt.subplots(figsize=(8, 4))
x = np.linspace(0, 100, 1000)
ax.plot(x, np.sin(x))

# 获取并调整定位器
locator = ax.xaxis.get_major_locator()
if isinstance(locator, MaxNLocator):
    locator.set_params(nbins=20)  # 增加刻度数量

plt.title("how2matplotlib.com - 处理刻度重叠")
plt.xticks(rotation=45, ha='right')
plt.tight_layout()
plt.show()
Output:
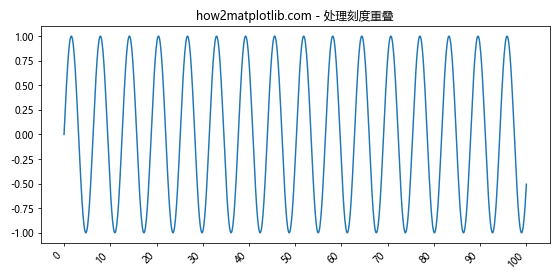
在这个例子中,我们通过增加刻度数量可能导致刻度标签重叠。解决方法是旋转标签或减少刻度数量。
8.2 对数刻度的不理想显示
import matplotlib.pyplot as plt
import numpy as np
from matplotlib.ticker import LogLocator, LogFormatter

fig, ax = plt.subplots()
x = np.logspace(0, 5, 100)
ax.plot(x, x**2)

ax.set_xscale('log')
ax.set_yscale('log')

# 获取并调整对数定位器
x_locator = ax.xaxis.get_major_locator()
if isinstance(x_locator, LogLocator):
    x_locator.set_params(numticks=10)

# 设置对数格式化器
ax.xaxis.set_major_formatter(LogFormatter(labelOnlyBase=False))

plt.title("how2matplotlib.com - 优化对数刻度显示")
plt.show()
Output:
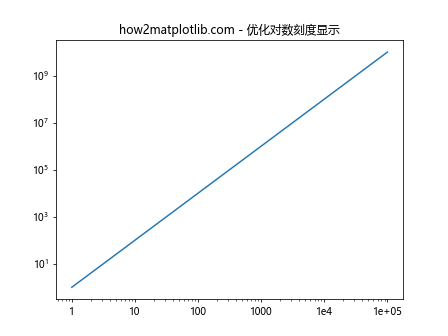
对数刻度有时会显示过多或过少的刻度。这个例子展示了如何调整对数定位器和格式化器来优化显示效果。
8.3 时间序列数据的刻度间隔不均匀
import matplotlib.pyplot as plt
import pandas as pd
from matplotlib.dates import AutoDateLocator, YearLocator, DateFormatter

# 创建不规则时间序列数据
dates = pd.date_range(start='2020-01-01', end='2023-12-31', freq='M')
values = pd.Series(np.random.randn(len(dates)).cumsum(), index=dates)

fig, ax = plt.subplots(figsize=(12, 6))
ax.plot(dates, values)

# 获取并替换日期定位器
date_locator = ax.xaxis.get_major_locator()
if isinstance(date_locator, AutoDateLocator):
    ax.xaxis.set_major_locator(YearLocator())

ax.xaxis.set_major_formatter(DateFormatter('%Y'))

plt.title("how2matplotlib.com - 均匀时间刻度")
plt.tight_layout()
plt.show()
对于跨越多年的时间序列数据,自动定位器可能会产生不均匀的刻度间隔。这个例子展示了如何使用YearLocator来确保每年都有一个刻度。
9. 总结
Axis.get_major_locator()函数是Matplotlib中一个强大而灵活的工具,它允许我们获取和操作图表轴的主刻度定位器。通过本文的详细介绍和丰富的示例,我们了解了以下几点:
get_major_locator()的基本用法和不同类型的定位器。- 如何使用该函数进行自定义刻度调整。
- 在数据分析和不同类型图表中的应用。
- 与其他Axis方法的配合使用。
- 高级技巧和常见问题的解决方案。
掌握get_major_locator()函数可以帮助我们更好地控制图表的刻度显示,从而创建更加清晰、专业的数据可视化效果。无论是处理简单的线性数据,还是复杂的时间序列或对数数据,这个函数都能提供必要的灵活性和控制力。
在实际应用中,建议根据具体的数据特征和可视化需求,灵活运用不同类型的定位器和格式化器。同时,也要注意刻度的可读性和美观性,避免出现刻度重叠或间隔不均等问题。
通过深入理解和熟练运用get_major_locator()函数,我们可以在Matplotlib中创建出更加精确、美观和信息丰富的数据可视化图表,为数据分析和展示工作增添更多价值。
 极客教程
极客教程