Matplotlib中的Axis.get_major_formatter()函数:轻松获取和自定义坐标轴格式
参考:Matplotlib.axis.Axis.get_major_formatter() function in Python
Matplotlib是Python中最流行的数据可视化库之一,它提供了丰富的绘图功能和自定义选项。在Matplotlib中,坐标轴的格式化是一个重要的方面,它可以帮助我们更好地展示数据和提高图表的可读性。本文将深入探讨Matplotlib中的Axis.get_major_formatter()函数,这是一个用于获取坐标轴主刻度格式化器的重要方法。
1. Axis.get_major_formatter()函数简介
Axis.get_major_formatter()是Matplotlib库中axis.Axis类的一个方法。这个函数的主要作用是获取坐标轴的主刻度格式化器。格式化器决定了坐标轴上刻度标签的显示方式,例如数字的精度、日期的格式等。
让我们从一个简单的例子开始:
import matplotlib.pyplot as plt
import numpy as np

# 创建一个简单的图表
fig, ax = plt.subplots()
x = np.linspace(0, 10, 100)
ax.plot(x, np.sin(x))

# 获取x轴的主刻度格式化器
formatter = ax.xaxis.get_major_formatter()
print(f"X轴主刻度格式化器: {formatter}")

plt.title("how2matplotlib.com - get_major_formatter() Example")
plt.show()
Output:
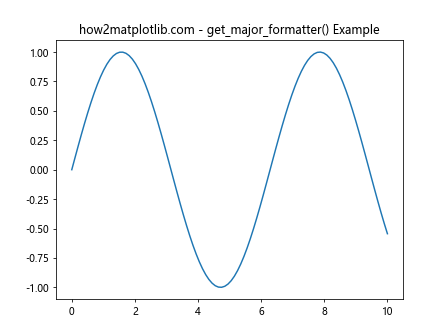
在这个例子中,我们创建了一个简单的正弦曲线图,然后使用get_major_formatter()方法获取了x轴的主刻度格式化器。默认情况下,Matplotlib使用ScalarFormatter作为数值轴的格式化器。
2. 理解主刻度格式化器
主刻度格式化器控制着坐标轴上主要刻度标签的显示方式。Matplotlib提供了多种内置的格式化器,每种都适用于不同的数据类型和显示需求:
ScalarFormatter:用于格式化数值刻度。FuncFormatter:允许用户自定义格式化函数。FixedFormatter:使用固定的字符串列表作为刻度标签。FormatStrFormatter:使用格式字符串来格式化刻度标签。StrMethodFormatter:使用字符串的format方法来格式化刻度标签。PercentFormatter:将数值格式化为百分比。LogFormatter:用于对数刻度的格式化。LogFormatterExponent:用于对数刻度的指数格式化。LogFormatterMathtext:使用数学文本格式化对数刻度。LogitFormatter:用于logit刻度的格式化。
让我们看一个使用ScalarFormatter的例子:
import matplotlib.pyplot as plt
import numpy as np
from matplotlib.ticker import ScalarFormatter

fig, ax = plt.subplots()
x = np.linspace(0, 1, 10)
ax.plot(x, x**2)

# 获取并设置x轴的主刻度格式化器
formatter = ScalarFormatter(useOffset=False, useMathText=True)
ax.xaxis.set_major_formatter(formatter)

# 再次获取格式化器并打印
current_formatter = ax.xaxis.get_major_formatter()
print(f"当前X轴主刻度格式化器: {current_formatter}")

plt.title("how2matplotlib.com - ScalarFormatter Example")
plt.show()
Output:
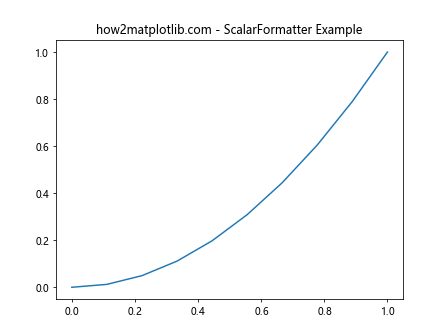
在这个例子中,我们首先创建了一个ScalarFormatter实例,禁用了偏移功能并启用了数学文本。然后我们将这个格式化器应用到x轴上,最后再次使用get_major_formatter()获取当前的格式化器并打印出来。
3. 自定义格式化器
有时候,内置的格式化器可能无法满足我们的特定需求。在这种情况下,我们可以创建自定义的格式化器。最灵活的方式是使用FuncFormatter,它允许我们定义一个函数来控制刻度标签的格式。
让我们看一个例子,我们将创建一个自定义格式化器,将数值转换为科学记数法:
import matplotlib.pyplot as plt
import numpy as np
from matplotlib.ticker import FuncFormatter

def scientific_formatter(x, pos):
    return f"{x:.2e}"

fig, ax = plt.subplots()
x = np.logspace(0, 5, 100)
ax.plot(x, x**2)

# 创建并设置自定义格式化器
formatter = FuncFormatter(scientific_formatter)
ax.xaxis.set_major_formatter(formatter)

# 获取并打印当前格式化器
current_formatter = ax.xaxis.get_major_formatter()
print(f"当前X轴主刻度格式化器: {current_formatter}")

plt.title("how2matplotlib.com - Custom Formatter Example")
plt.show()
Output:
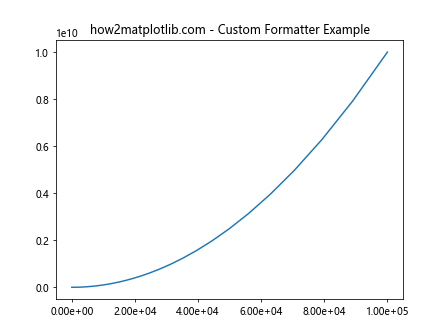
在这个例子中,我们定义了一个scientific_formatter函数,它将数值转换为科学记数法。然后我们使用FuncFormatter创建了一个自定义格式化器,并将其应用到x轴上。最后,我们再次使用get_major_formatter()获取当前的格式化器并打印出来。
4. 日期和时间的格式化
对于时间序列数据,Matplotlib提供了专门的日期格式化器。最常用的是DateFormatter。让我们看一个例子:
import matplotlib.pyplot as plt
import numpy as np
from matplotlib.dates import DateFormatter
import datetime

# 创建一些示例数据
dates = [datetime.datetime(2023, 1, 1) + datetime.timedelta(days=i) for i in range(365)]
values = np.random.randn(365).cumsum()

fig, ax = plt.subplots(figsize=(10, 6))
ax.plot(dates, values)

# 设置日期格式化器
date_formatter = DateFormatter("%Y-%m-%d")
ax.xaxis.set_major_formatter(date_formatter)

# 获取并打印当前格式化器
current_formatter = ax.xaxis.get_major_formatter()
print(f"当前X轴主刻度格式化器: {current_formatter}")

plt.title("how2matplotlib.com - Date Formatter Example")
plt.xticks(rotation=45)
plt.tight_layout()
plt.show()
Output:
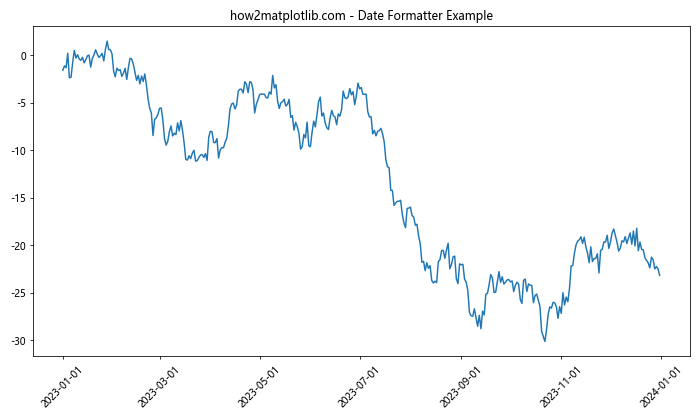
在这个例子中,我们创建了一个时间序列数据,然后使用DateFormatter来格式化x轴的日期显示。我们指定了日期的显示格式为”年-月-日”。最后,我们再次使用get_major_formatter()获取当前的格式化器并打印出来。
5. 百分比格式化
对于需要显示为百分比的数据,Matplotlib提供了PercentFormatter。让我们看一个例子:
import matplotlib.pyplot as plt
import numpy as np
from matplotlib.ticker import PercentFormatter

fig, ax = plt.subplots()
x = np.linspace(0, 1, 100)
ax.plot(x, x**2)

# 设置百分比格式化器
formatter = PercentFormatter(xmax=1, decimals=1)
ax.yaxis.set_major_formatter(formatter)

# 获取并打印当前格式化器
current_formatter = ax.yaxis.get_major_formatter()
print(f"当前Y轴主刻度格式化器: {current_formatter}")

plt.title("how2matplotlib.com - Percent Formatter Example")
plt.show()
Output:
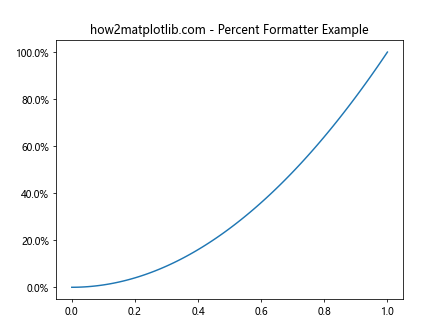
在这个例子中,我们创建了一个简单的二次函数图,然后使用PercentFormatter来格式化y轴的显示。我们指定了xmax=1,这意味着1将被视为100%,并设置了小数点后保留1位。最后,我们再次使用get_major_formatter()获取当前的格式化器并打印出来。
6. 对数刻度的格式化
对于对数刻度,Matplotlib提供了专门的格式化器,如LogFormatter。让我们看一个例子:
import matplotlib.pyplot as plt
import numpy as np
from matplotlib.ticker import LogFormatter

fig, ax = plt.subplots()
x = np.logspace(0, 5, 100)
ax.plot(x, x**2)
ax.set_xscale('log')

# 设置对数格式化器
formatter = LogFormatter(base=10)
ax.xaxis.set_major_formatter(formatter)

# 获取并打印当前格式化器
current_formatter = ax.xaxis.get_major_formatter()
print(f"当前X轴主刻度格式化器: {current_formatter}")

plt.title("how2matplotlib.com - Log Formatter Example")
plt.show()
Output:
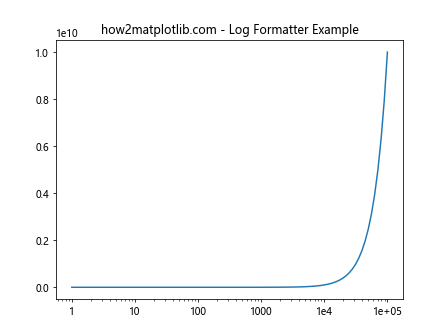
在这个例子中,我们创建了一个对数刻度的图表,然后使用LogFormatter来格式化x轴的显示。我们指定了底数为10。最后,我们再次使用get_major_formatter()获取当前的格式化器并打印出来。
7. 使用FixedFormatter
有时候,我们可能想要为刻度使用固定的标签。这时可以使用FixedFormatter。让我们看一个例子:
import matplotlib.pyplot as plt
import numpy as np
from matplotlib.ticker import FixedFormatter

fig, ax = plt.subplots()
x = np.arange(5)
y = x**2

ax.plot(x, y)

# 设置固定格式化器
formatter = FixedFormatter(['A', 'B', 'C', 'D', 'E'])
ax.xaxis.set_major_formatter(formatter)

# 获取并打印当前格式化器
current_formatter = ax.xaxis.get_major_formatter()
print(f"当前X轴主刻度格式化器: {current_formatter}")

plt.title("how2matplotlib.com - Fixed Formatter Example")
plt.show()
Output:
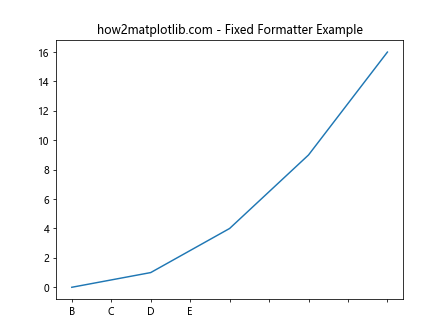
在这个例子中,我们创建了一个简单的图表,然后使用FixedFormatter来为x轴设置固定的标签。我们提供了一个字符串列表作为标签。最后,我们再次使用get_major_formatter()获取当前的格式化器并打印出来。
8. 使用FormatStrFormatter
如果我们想要使用Python的字符串格式化语法来控制刻度标签的显示,可以使用FormatStrFormatter。让我们看一个例子:
import matplotlib.pyplot as plt
import numpy as np
from matplotlib.ticker import FormatStrFormatter

fig, ax = plt.subplots()
x = np.linspace(0, 2*np.pi, 100)
ax.plot(x, np.sin(x))

# 设置格式字符串格式化器
formatter = FormatStrFormatter('%.2f')
ax.xaxis.set_major_formatter(formatter)

# 获取并打印当前格式化器
current_formatter = ax.xaxis.get_major_formatter()
print(f"当前X轴主刻度格式化器: {current_formatter}")

plt.title("how2matplotlib.com - FormatStr Formatter Example")
plt.show()
Output:
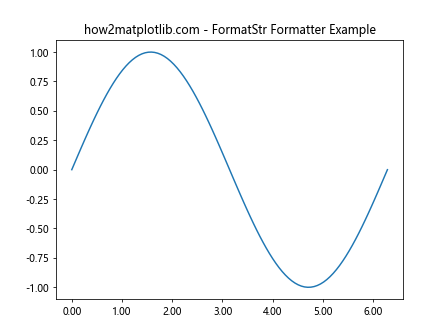
在这个例子中,我们创建了一个正弦函数图,然后使用FormatStrFormatter来格式化x轴的显示。我们指定了格式字符串’%.2f’,这意味着数值将显示为保留两位小数的浮点数。最后,我们再次使用get_major_formatter()获取当前的格式化器并打印出来。
9. 使用StrMethodFormatter
StrMethodFormatter是一个更现代的字符串格式化器,它使用Python 3的字符串格式化语法。让我们看一个例子:
import matplotlib.pyplot as plt
import numpy as np
from matplotlib.ticker import StrMethodFormatter

fig, ax = plt.subplots()
x = np.linspace(0, 1, 10)
ax.plot(x, x**2)

# 设置字符串方法格式化器
formatter = StrMethodFormatter("{x:.3f}")
ax.xaxis.set_major_formatter(formatter)

# 获取并打印当前格式化器
current_formatter = ax.xaxis.get_major_formatter()
print(f"当前X轴主刻度格式化器: {current_formatter}")

plt.title("how2matplotlib.com - StrMethod Formatter Example")
plt.show()
Output:
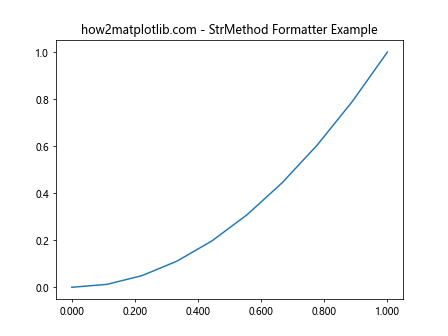
在这个例子中,我们创建了一个二次函数图,然后使用StrMethodFormatter来格式化x轴的显示。我们指定了格式字符串”{x:.3f}”,这意味着数值将显示为保留三位小数的浮点数。最后,我们再次使用get_major_formatter()获取当前的格式化器并打印出来。
10. 组合使用多种格式化器
在某些情况下,我们可能需要在同一个图表中使用多种不同的格式化器。Matplotlib允许我们为不同的轴设置不同的格式化器。让我们看一个例子:
import matplotlib.pyplot as plt
import numpy as np
from matplotlib.ticker import FuncFormatter, PercentFormatter

def currency_formatter(x, pos):
    return f"${x:,.0f}"

fig, ax = plt.subplots()
x = np.linspace(0, 1, 100)
ax.plot(x, x**2)

# 为x轴设置货币格式化器
ax.xaxis.set_major_formatter(FuncFormatter(currency_formatter))

# 为y轴设置百分比格式化器
ax.yaxis.set_major_formatter(PercentFormatter(xmax=1))

# 获取并打印当前格式化器
x_formatter = ax.xaxis.get_major_formatter()
y_formatter = ax.yaxis.get_major_formatter()
print(f"当前X轴主刻度格式化器: {x_formatter}")
print(f"当前Y轴主刻度格式化器: {y_formatter}")

plt.title("how2matplotlib.com - Multiple Formatters Example")
plt.show()
Output:
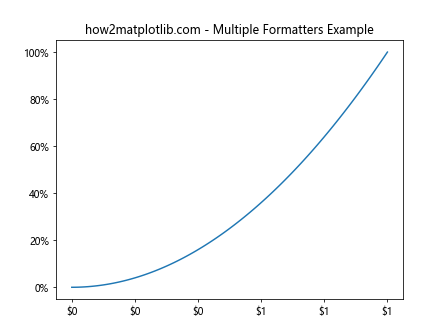
在这个例子中,我们创建了一个图表,x轴使用自定义的货币格式化器,y轴使用百分比格式化器。我们分别为x轴和y轴设置了不同的格式化器,然后使用get_major_formatter()获取并打印了两个轴的格式化器。
11. 动态更改格式化器
有时候,我们可能需要在程序运行过程中动态地更改格式化器。Axis.get_major_formatter()和Axis.set_major_formatter()方法使这变得非常简单。让我们看一个例子:
import matplotlib.pyplot as plt
import numpy as np
from matplotlib.ticker import ScalarFormatter, PercentFormatter

fig, ax = plt.subplots()
x = np.linspace(0, 1, 100)
line, = ax.plot(x, x**2)

# 初始使用ScalarFormatter
ax.yaxis.set_major_formatter(ScalarFormatter())

# 获取并打印初始格式化器
initial_formatter = ax.yaxis.get_major_formatter()
print(f"初始Y轴主刻度格式化器: {initial_formatter}")

plt.title("how2matplotlib.com - Dynamic Formatter Change")
plt.draw()
plt.pause(2)

# 更改为PercentFormatter
ax.yaxis.set_major_formatter(PercentFormatter(xmax=1))

# 获取并打印更改后的格式化器
new_formatter = ax.yaxis.get_major_formatter()
print(f"更改后Y轴主刻度格式化器: {new_formatter}")

plt.draw()
plt.show()
Output:
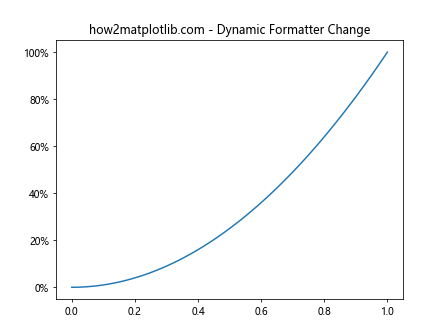
在这个例子中,我们首先使用ScalarFormatter,然后在短暂暂停后切换到PercentFormatter。我们使用get_major_formatter()方法来验证格式化器的变化。
12. 在子图中使用不同的格式化器
当我们创建包含多个子图的图表时,可以为每个子图设置不同的格式化器。让我们看一个例子:
import matplotlib.pyplot as plt
import numpy as np
from matplotlib.ticker import ScalarFormatter, PercentFormatter, FuncFormatter

def scientific_formatter(x, pos):
    return f"{x:.2e}"

fig, (ax1, ax2, ax3) = plt.subplots(1, 3, figsize=(15, 5))
x = np.linspace(0, 1, 100)

# 第一个子图:使用ScalarFormatter
ax1.plot(x, x**2)
ax1.yaxis.set_major_formatter(ScalarFormatter())

# 第二个子图:使用PercentFormatter
ax2.plot(x, x**2)
ax2.yaxis.set_major_formatter(PercentFormatter(xmax=1))

# 第三个子图:使用自定义FuncFormatter
ax3.plot(x, x**2)
ax3.yaxis.set_major_formatter(FuncFormatter(scientific_formatter))

# 获取并打印每个子图的格式化器
for i, ax in enumerate([ax1, ax2, ax3], 1):
    formatter = ax.yaxis.get_major_formatter()
    print(f"子图{i}的Y轴主刻度格式化器: {formatter}")

plt.suptitle("how2matplotlib.com - Different Formatters in Subplots")
plt.tight_layout()
plt.show()
Output:
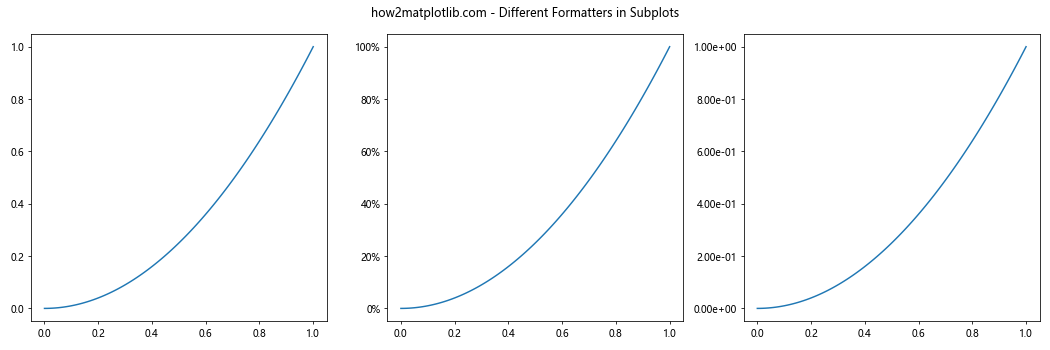
在这个例子中,我们创建了三个子图,每个子图使用不同的格式化器。我们使用get_major_formatter()方法来获取并打印每个子图的格式化器。
13. 处理大数字的格式化
当处理非常大或非常小的数字时,默认的格式化器可能不能很好地显示这些数字。我们可以使用自定义的格式化器来解决这个问题。让我们看一个例子:
import matplotlib.pyplot as plt
import numpy as np
from matplotlib.ticker import FuncFormatter

def large_num_formatter(x, pos):
    if abs(x) >= 1e9:
        return f'{x/1e9:.1f}B'
    elif abs(x) >= 1e6:
        return f'{x/1e6:.1f}M'
    elif abs(x) >= 1e3:
        return f'{x/1e3:.1f}K'
    else:
        return f'{x:.1f}'

fig, ax = plt.subplots()
x = np.array([1e3, 1e6, 1e9, 1e12])
y = x**2

ax.plot(x, y)
ax.set_xscale('log')
ax.set_yscale('log')

# 设置自定义格式化器
formatter = FuncFormatter(large_num_formatter)
ax.xaxis.set_major_formatter(formatter)
ax.yaxis.set_major_formatter(formatter)

# 获取并打印当前格式化器
x_formatter = ax.xaxis.get_major_formatter()
y_formatter = ax.yaxis.get_major_formatter()
print(f"X轴主刻度格式化器: {x_formatter}")
print(f"Y轴主刻度格式化器: {y_formatter}")

plt.title("how2matplotlib.com - Large Number Formatting")
plt.show()
Output:
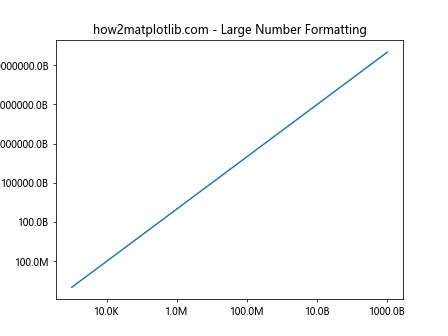
在这个例子中,我们创建了一个自定义的格式化函数,它可以将大数字转换为更易读的形式(如1B表示10亿)。我们将这个格式化器应用到x轴和y轴,然后使用get_major_formatter()方法来验证设置。
14. 在极坐标图中使用格式化器
格式化器不仅可以用于笛卡尔坐标系,也可以用于其他类型的图表,如极坐标图。让我们看一个在极坐标图中使用格式化器的例子:
import matplotlib.pyplot as plt
import numpy as np
from matplotlib.ticker import FuncFormatter

def degree_formatter(x, pos):
    return f"{x}°"

fig, ax = plt.subplots(subplot_kw=dict(projection='polar'))
r = np.linspace(0, 1, 100)
theta = 2 * np.pi * r

ax.plot(theta, r)

# 设置角度格式化器
formatter = FuncFormatter(degree_formatter)
ax.xaxis.set_major_formatter(formatter)

# 获取并打印当前格式化器
current_formatter = ax.xaxis.get_major_formatter()
print(f"当前角度轴主刻度格式化器: {current_formatter}")

plt.title("how2matplotlib.com - Polar Plot Formatter")
plt.show()
Output:
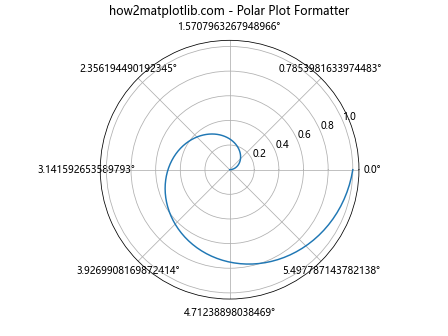
在这个例子中,我们创建了一个极坐标图,并为角度轴设置了一个自定义的格式化器,将弧度转换为度数。我们使用get_major_formatter()方法来验证设置的格式化器。
15. 在3D图中使用格式化器
Axis.get_major_formatter()方法同样适用于3D图表。让我们看一个在3D图中使用格式化器的例子:
import matplotlib.pyplot as plt
import numpy as np
from matplotlib.ticker import FuncFormatter

def custom_formatter(x, pos):
    return f"[{x:.1f}]"

fig = plt.figure()
ax = fig.add_subplot(111, projection='3d')

# 生成一些3D数据
x = np.linspace(-5, 5, 100)
y = np.linspace(-5, 5, 100)
X, Y = np.meshgrid(x, y)
Z = np.sin(np.sqrt(X**2 + Y**2))

# 绘制3D表面
surf = ax.plot_surface(X, Y, Z)

# 设置自定义格式化器
formatter = FuncFormatter(custom_formatter)
ax.xaxis.set_major_formatter(formatter)
ax.yaxis.set_major_formatter(formatter)
ax.zaxis.set_major_formatter(formatter)

# 获取并打印当前格式化器
x_formatter = ax.xaxis.get_major_formatter()
y_formatter = ax.yaxis.get_major_formatter()
z_formatter = ax.zaxis.get_major_formatter()
print(f"X轴主刻度格式化器: {x_formatter}")
print(f"Y轴主刻度格式化器: {y_formatter}")
print(f"Z轴主刻度格式化器: {z_formatter}")

plt.title("how2matplotlib.com - 3D Plot Formatter")
plt.show()
Output:
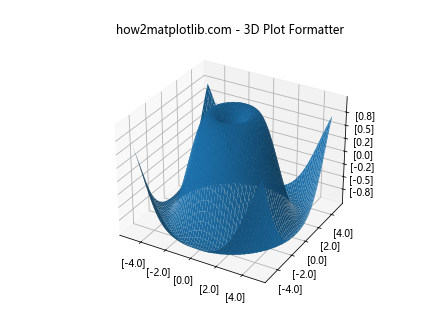
在这个例子中,我们创建了一个3D表面图,并为x、y、z三个轴设置了相同的自定义格式化器。我们使用get_major_formatter()方法来验证每个轴的格式化器设置。
总结
通过本文,我们深入探讨了Matplotlib中的Axis.get_major_formatter()函数及其相关应用。我们学习了如何获取、设置和自定义坐标轴的格式化器,以及如何在不同类型的图表中应用这些技术。
格式化器是Matplotlib中非常强大的工具,它们允许我们精确控制数据在图表中的显示方式。通过合理使用格式化器,我们可以大大提高图表的可读性和美观度。
无论是处理简单的2D图表,还是复杂的3D可视化,了解如何使用get_major_formatter()和相关的格式化器方法都是非常有价值的。这些技能将帮助你创建更专业、更有洞察力的数据可视化。
记住,选择合适的格式化器取决于你的数据类型和可视化目标。不要害怕尝试不同的格式化器,或者创建自定义的格式化器来满足你的特定需求。通过实践和探索,你将能够充分利用Matplotlib的强大功能,创建出令人印象深刻的数据可视化作品。
 极客教程
极客教程