Matplotlib中的Axis.get_gid()函数:获取图形元素的组标识符
参考:Matplotlib.axis.Axis.get_gid() function in Python
Matplotlib是Python中最流行的数据可视化库之一,它提供了丰富的绘图功能和自定义选项。在Matplotlib中,Axis.get_gid()函数是一个重要的方法,用于获取轴对象的组标识符(Group ID)。本文将深入探讨这个函数的用法、特点和应用场景,帮助你更好地理解和使用它。
1. Axis.get_gid()函数简介
Axis.get_gid()是Matplotlib库中axis.Axis类的一个方法。这个函数的主要作用是获取轴对象的组标识符(GID)。组标识符是一个字符串,用于唯一标识图形中的特定元素或元素组。通过使用GID,我们可以更方便地管理和操作图形中的不同部分。
让我们来看一个简单的示例,了解如何使用get_gid()函数:
import matplotlib.pyplot as plt

fig, ax = plt.subplots()
ax.set_title("how2matplotlib.com Example")
ax.plot([1, 2, 3, 4], [1, 4, 2, 3])

# 设置x轴的GID
ax.xaxis.set_gid("x_axis_gid")

# 获取x轴的GID
x_axis_gid = ax.xaxis.get_gid()
print(f"X-axis GID: {x_axis_gid}")

plt.show()
Output:
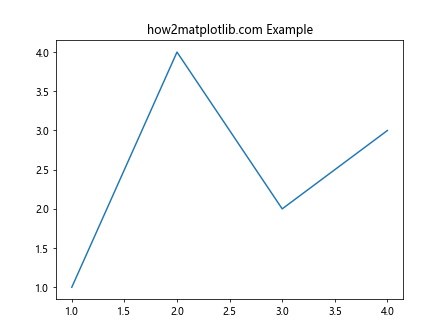
在这个例子中,我们首先创建了一个简单的折线图。然后,我们使用set_gid()方法为x轴设置了一个GID。最后,我们通过get_gid()方法获取并打印了x轴的GID。
2. Axis.get_gid()函数的参数和返回值
Axis.get_gid()函数是一个无参数的方法。它的语法非常简单:
gid = axis.get_gid()
这个函数的返回值是一个字符串,表示轴对象的组标识符。如果没有设置GID,函数将返回None。
让我们通过一个例子来演示这一点:
import matplotlib.pyplot as plt

fig, ax = plt.subplots()
ax.set_title("how2matplotlib.com GID Example")

# 获取y轴的GID(未设置)
y_axis_gid = ax.yaxis.get_gid()
print(f"Y-axis GID (before setting): {y_axis_gid}")

# 设置y轴的GID
ax.yaxis.set_gid("y_axis_gid")

# 再次获取y轴的GID
y_axis_gid = ax.yaxis.get_gid()
print(f"Y-axis GID (after setting): {y_axis_gid}")

plt.show()
Output:
在这个例子中,我们首先尝试获取y轴的GID,此时它还未被设置,所以返回None。然后,我们为y轴设置了一个GID,再次获取时就能得到我们设置的值。
3. Axis.get_gid()函数的应用场景
Axis.get_gid()函数在许多场景下都非常有用。以下是一些常见的应用场景:
3.1 识别和管理多个轴
当你的图形包含多个子图或轴时,使用GID可以帮助你更容易地识别和管理这些轴。例如:
import matplotlib.pyplot as plt

fig, (ax1, ax2) = plt.subplots(1, 2, figsize=(10, 4))
fig.suptitle("how2matplotlib.com Multiple Axes Example")

ax1.set_gid("left_axis")
ax2.set_gid("right_axis")

ax1.plot([1, 2, 3, 4], [1, 4, 2, 3])
ax2.plot([1, 2, 3, 4], [3, 2, 4, 1])

print(f"Left axis GID: {ax1.get_gid()}")
print(f"Right axis GID: {ax2.get_gid()}")

plt.show()
Output:
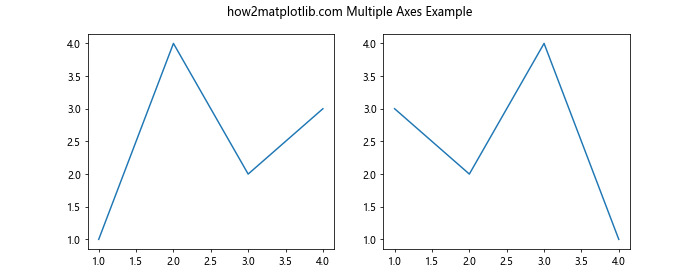
在这个例子中,我们创建了两个子图,并为每个子图的轴设置了不同的GID。这样,我们可以通过GID轻松地区分和操作这两个轴。
3.2 自定义样式和行为
通过GID,我们可以为特定的轴应用自定义的样式或行为。例如:
import matplotlib.pyplot as plt

fig, ax = plt.subplots()
ax.set_title("how2matplotlib.com Custom Style Example")

ax.plot([1, 2, 3, 4], [1, 4, 2, 3])

ax.xaxis.set_gid("custom_x_axis")
ax.yaxis.set_gid("custom_y_axis")

# 自定义样式函数
def customize_axis(axis):
    if axis.get_gid() == "custom_x_axis":
        axis.set_ticks_position('top')
        axis.set_label_position('top')
    elif axis.get_gid() == "custom_y_axis":
        axis.set_ticks_position('right')
        axis.set_label_position('right')

customize_axis(ax.xaxis)
customize_axis(ax.yaxis)

plt.show()
Output:
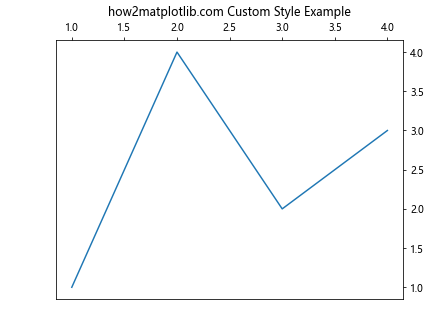
在这个例子中,我们定义了一个自定义函数customize_axis,它根据轴的GID来应用不同的样式。对于x轴,我们将刻度和标签移到了顶部;对于y轴,我们将刻度和标签移到了右侧。
3.3 动态更新图形元素
GID还可以用于在动态更新图形时识别特定的元素。例如:
import matplotlib.pyplot as plt
import numpy as np

fig, ax = plt.subplots()
ax.set_title("how2matplotlib.com Dynamic Update Example")

line, = ax.plot([], [], 'r-')
line.set_gid("dynamic_line")

def update_line(frame):
    x = np.linspace(0, 2*np.pi, 100)
    y = np.sin(x + frame/10)
    line = [l for l in ax.get_lines() if l.get_gid() == "dynamic_line"][0]
    line.set_data(x, y)
    return line,

ax.set_xlim(0, 2*np.pi)
ax.set_ylim(-1, 1)

from matplotlib.animation import FuncAnimation
anim = FuncAnimation(fig, update_line, frames=100, interval=50, blit=True)

plt.show()
Output:
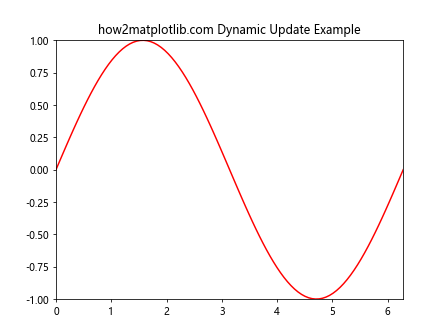
在这个例子中,我们创建了一个动画,其中的线条通过GID进行标识。在update_line函数中,我们使用GID来找到需要更新的线条对象,并更新其数据。
4. Axis.get_gid()函数与其他相关函数的比较
Axis.get_gid()函数通常与其他相关函数一起使用,以实现更复杂的功能。让我们来比较一下这些函数:
4.1 get_gid() vs set_gid()
set_gid()函数用于设置轴的GID,而get_gid()用于获取GID。这两个函数通常配对使用:
import matplotlib.pyplot as plt

fig, ax = plt.subplots()
ax.set_title("how2matplotlib.com get_gid vs set_gid Example")

# 设置GID
ax.xaxis.set_gid("x_axis_gid")
ax.yaxis.set_gid("y_axis_gid")

# 获取GID
print(f"X-axis GID: {ax.xaxis.get_gid()}")
print(f"Y-axis GID: {ax.yaxis.get_gid()}")

plt.show()
Output:
4.2 get_gid() vs get_label()
get_label()函数用于获取轴的标签,而不是GID。这两个函数返回不同类型的信息:
import matplotlib.pyplot as plt

fig, ax = plt.subplots()
ax.set_title("how2matplotlib.com get_gid vs get_label Example")

ax.set_xlabel("X Label")
ax.set_ylabel("Y Label")

ax.xaxis.set_gid("x_axis_gid")
ax.yaxis.set_gid("y_axis_gid")

print(f"X-axis GID: {ax.xaxis.get_gid()}, Label: {ax.xaxis.get_label()}")
print(f"Y-axis GID: {ax.yaxis.get_gid()}, Label: {ax.yaxis.get_label()}")

plt.show()
Output:

4.3 get_gid() vs get_visible()
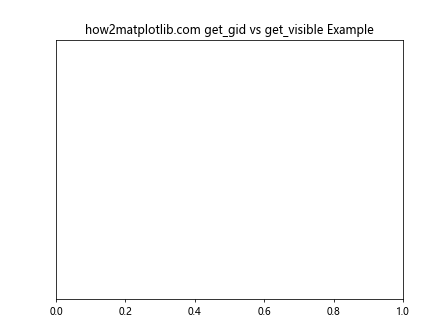
get_visible()函数用于检查轴是否可见,而get_gid()用于获取GID。这两个函数提供了不同的信息:
import matplotlib.pyplot as plt

fig, ax = plt.subplots()
ax.set_title("how2matplotlib.com get_gid vs get_visible Example")

ax.xaxis.set_gid("x_axis_gid")
ax.yaxis.set_gid("y_axis_gid")

ax.yaxis.set_visible(False)

print(f"X-axis GID: {ax.xaxis.get_gid()}, Visible: {ax.xaxis.get_visible()}")
print(f"Y-axis GID: {ax.yaxis.get_gid()}, Visible: {ax.yaxis.get_visible()}")

plt.show()
Output:
5. Axis.get_gid()函数的高级应用
除了基本用法外,Axis.get_gid()函数还有一些高级应用。让我们探讨几个例子:
5.1 使用GID进行条件格式化
我们可以使用GID来对特定的轴应用条件格式化:
import matplotlib.pyplot as plt
import numpy as np

fig, axs = plt.subplots(2, 2, figsize=(10, 8))
fig.suptitle("how2matplotlib.com Conditional Formatting Example")

for i, ax in enumerate(axs.flat):
    ax.plot(np.random.rand(10))
    ax.set_gid(f"axis_{i}")

def format_axis(ax):
    gid = ax.get_gid()
    if gid in ["axis_0", "axis_3"]:
        ax.set_facecolor('lightgray')
    if gid in ["axis_1", "axis_2"]:
        ax.grid(True)

for ax in axs.flat:
    format_axis(ax)

plt.tight_layout()
plt.show()
Output:
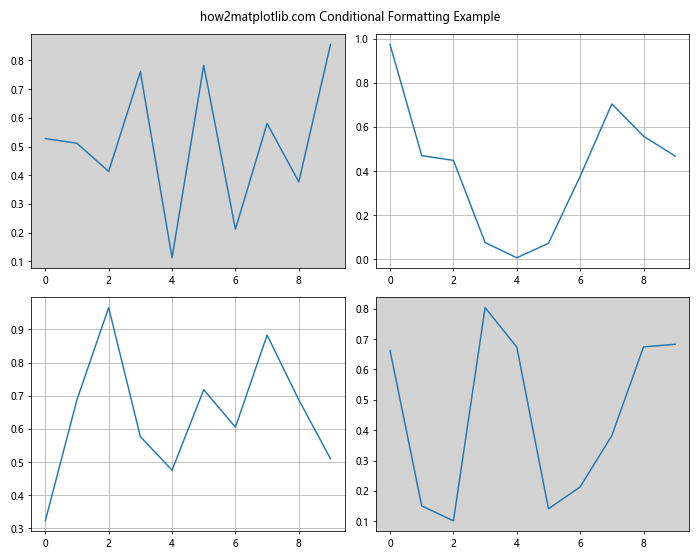
在这个例子中,我们创建了一个2×2的子图网格,并为每个子图设置了不同的GID。然后,我们定义了一个format_axis函数,根据轴的GID应用不同的格式。
5.2 使用GID进行交互式操作
GID也可以用于实现交互式操作,例如在点击事件中识别特定的轴:
import matplotlib.pyplot as plt
import numpy as np

fig, axs = plt.subplots(2, 2, figsize=(10, 8))
fig.suptitle("how2matplotlib.com Interactive Example")

for i, ax in enumerate(axs.flat):
    ax.plot(np.random.rand(10))
    ax.set_gid(f"axis_{i}")

def on_click(event):
    if event.inaxes:
        gid = event.inaxes.get_gid()
        print(f"Clicked on axis with GID: {gid}")

fig.canvas.mpl_connect('button_press_event', on_click)

plt.tight_layout()
plt.show()
Output:
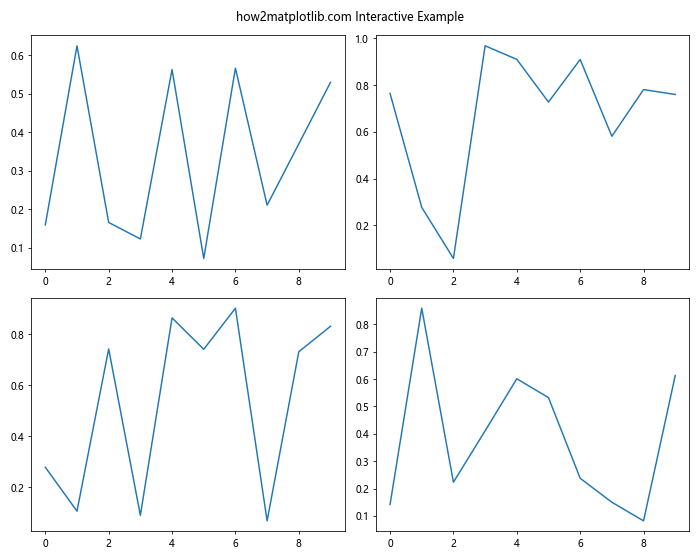
在这个例子中,我们为图形添加了一个点击事件处理函数。当用户点击某个子图时,我们使用get_gid()函数获取被点击轴的GID,并打印出来。
5.3 使用GID进行动态图例管理
GID还可以用于动态管理图例,特别是在处理多个子图时:
import matplotlib.pyplot as plt
import numpy as np

fig, axs = plt.subplots(2, 2, figsize=(10, 8))
fig.suptitle("how2matplotlib.com Dynamic Legend Example")

for i, ax in enumerate(axs.flat):
    x = np.linspace(0, 10, 100)
    ax.plot(x, np.sin(x), label=f"Sin {i}")
    ax.plot(x, np.cos(x), label=f"Cos {i}")
    ax.set_gid(f"axis_{i}")

def toggle_legend(event):
    if event.inaxes:
        gid = event.inaxes.get_gid()
        if gid:
            if event.inaxes.get_legend():
                event.inaxes.get_legend().remove()
            else:
                event.inaxes.legend()
        fig.canvas.draw()

fig.canvas.mpl_connect('button_press_event', toggle_legend)

plt.tight_layout()
plt.show()
Output:
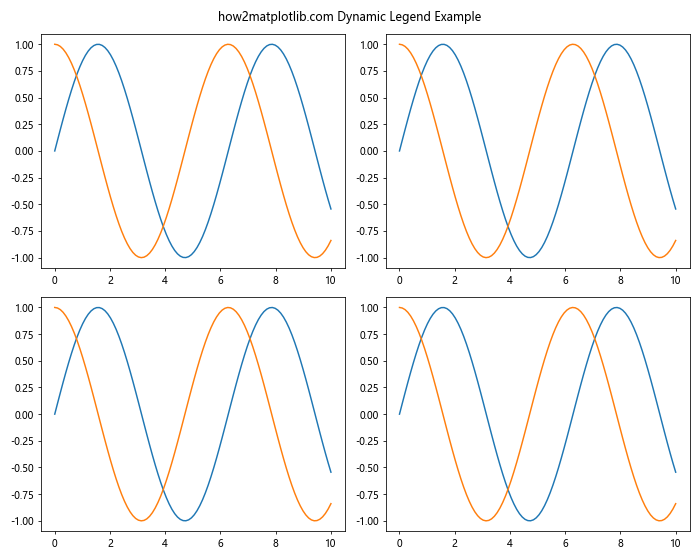
在这个例子中,我们创建了一个2×2的子图网格,每个子图包含正弦和余弦曲线。我们为每个子图设置了GID,并添加了一个点击事件处理函数。当用户点击某个子图时,我们使用get_gid()函数识别被点击的轴,然后切换该轴的图例显示状态。
6. Axis.get_gid()函数的注意事项和最佳实践
在使用Axis.get_gid()函数时,有一些注意事项和最佳实践需要考虑:
6.1 GID的唯一性
确保为每个需要识别的轴设置唯一的GID。重复的GID可能会导致混淆和错误:
import matplotlib.pyplot asplt

fig, (ax1, ax2) = plt.subplots(1, 2, figsize=(10, 4))
fig.suptitle("how2matplotlib.com Unique GID Example")

ax1.set_gid("unique_axis_1")
ax2.set_gid("unique_axis_2")

ax1.plot([1, 2, 3, 4], [1, 4, 2, 3])
ax2.plot([1, 2, 3, 4], [3, 2, 4, 1])

print(f"Left axis GID: {ax1.get_gid()}")
print(f"Right axis GID: {ax2.get_gid()}")

plt.show()
在这个例子中,我们为两个子图设置了不同的GID,确保它们可以被唯一识别。
6.2 GID的命名规范
采用一致的命名规范可以使你的代码更易读和维护。例如,你可以使用描述性的名称或遵循特定的格式:
import matplotlib.pyplot as plt

fig, ((ax1, ax2), (ax3, ax4)) = plt.subplots(2, 2, figsize=(10, 8))
fig.suptitle("how2matplotlib.com GID Naming Convention Example")

ax1.set_gid("top_left_axis")
ax2.set_gid("top_right_axis")
ax3.set_gid("bottom_left_axis")
ax4.set_gid("bottom_right_axis")

for ax in (ax1, ax2, ax3, ax4):
    ax.plot([1, 2, 3, 4], [1, 4, 2, 3])
    print(f"Axis GID: {ax.get_gid()}")

plt.tight_layout()
plt.show()
Output:

在这个例子中,我们使用描述性的名称作为GID,清晰地表示了每个轴的位置。
6.3 避免过度使用GID
虽然GID很有用,但不应该过度使用。只为真正需要特殊识别或处理的轴设置GID:
import matplotlib.pyplot as plt
import numpy as np

fig, axs = plt.subplots(3, 3, figsize=(12, 12))
fig.suptitle("how2matplotlib.com Selective GID Usage Example")

for i, ax in enumerate(axs.flat):
    ax.plot(np.random.rand(10))
    if i in [0, 4, 8]:  # 只为对角线上的子图设置GID
        ax.set_gid(f"diagonal_axis_{i}")

for ax in axs.flat:
    gid = ax.get_gid()
    if gid:
        print(f"Axis with GID: {gid}")
    else:
        print("Axis without GID")

plt.tight_layout()
plt.show()
Output:
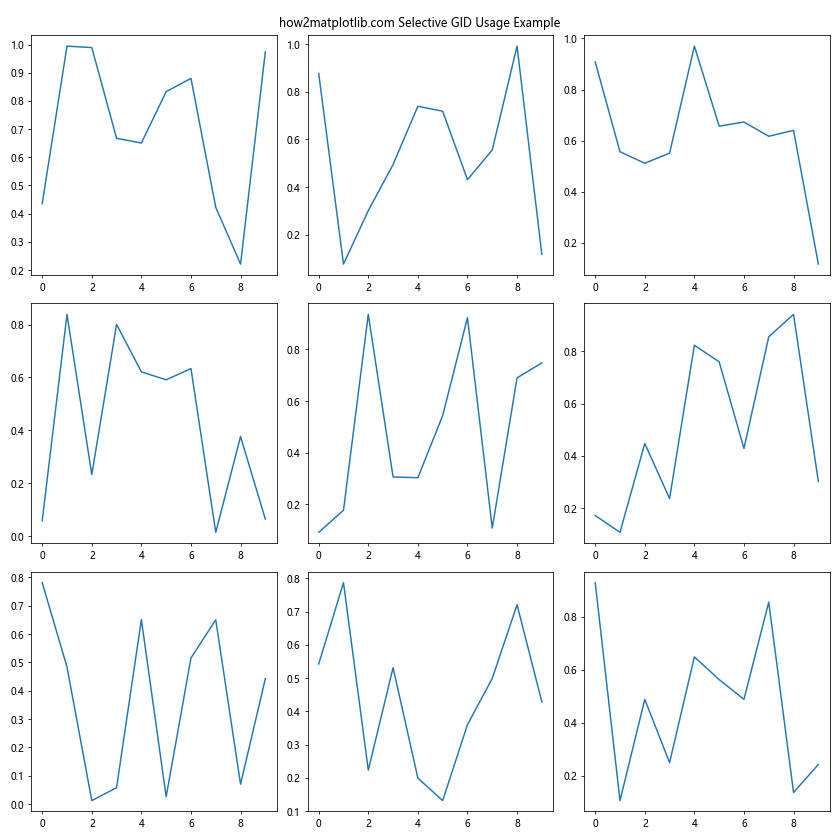
在这个例子中,我们只为3×3网格中对角线上的子图设置了GID,而不是为所有子图都设置GID。
6.4 结合使用GID和其他属性
GID可以与其他属性结合使用,以实现更复杂的功能:
import matplotlib.pyplot as plt
import numpy as np

fig, axs = plt.subplots(2, 2, figsize=(10, 8))
fig.suptitle("how2matplotlib.com Combining GID with Other Attributes")

colors = ['red', 'blue', 'green', 'orange']

for i, ax in enumerate(axs.flat):
    ax.plot(np.random.rand(10), color=colors[i])
    ax.set_gid(f"axis_{i}")
    ax.set_title(f"Plot {i+1}")

def highlight_axis(event):
    if event.inaxes:
        gid = event.inaxes.get_gid()
        title = event.inaxes.get_title()
        color = event.inaxes.get_lines()[0].get_color()
        print(f"Clicked on {title} (GID: {gid}) with {color} line")

fig.canvas.mpl_connect('button_press_event', highlight_axis)

plt.tight_layout()
plt.show()
Output:
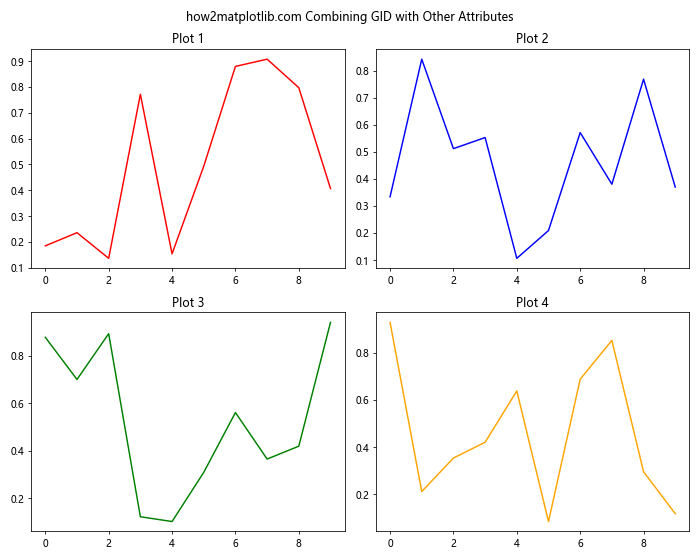
在这个例子中,我们结合使用了GID、标题和线条颜色。当用户点击某个子图时,我们不仅显示GID,还显示标题和线条颜色。
7. Axis.get_gid()函数在不同类型图表中的应用
Axis.get_gid()函数可以应用于各种类型的图表。让我们看几个例子:
7.1 在散点图中使用GID
import matplotlib.pyplot as plt
import numpy as np

fig, ax = plt.subplots()
fig.suptitle("how2matplotlib.com Scatter Plot with GID")

x = np.random.rand(50)
y = np.random.rand(50)
colors = np.random.rand(50)
sizes = 1000 * np.random.rand(50)

scatter = ax.scatter(x, y, c=colors, s=sizes, alpha=0.5)
scatter.set_gid("main_scatter")

ax.set_xlabel("X-axis")
ax.set_ylabel("Y-axis")

print(f"Scatter plot GID: {scatter.get_gid()}")

plt.show()
Output:
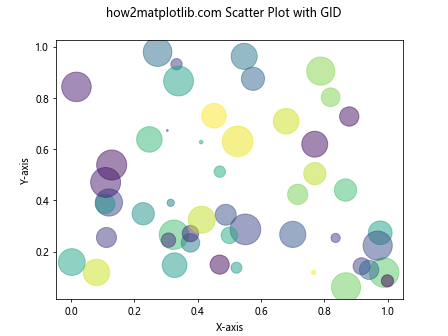
在这个例子中,我们为散点图对象设置了GID,这可以用于后续的识别和操作。
7.2 在柱状图中使用GID
import matplotlib.pyplot as plt
import numpy as np

fig, ax = plt.subplots()
fig.suptitle("how2matplotlib.com Bar Chart with GID")

categories = ['A', 'B', 'C', 'D', 'E']
values = np.random.randint(0, 100, 5)

bars = ax.bar(categories, values)

for i, bar in enumerate(bars):
    bar.set_gid(f"bar_{i}")

ax.set_ylabel("Values")

for bar in bars:
    print(f"Bar GID: {bar.get_gid()}")

plt.show()
Output:
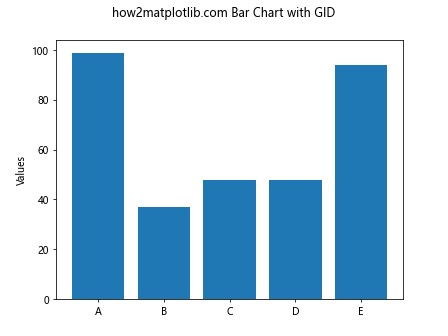
在这个例子中,我们为每个柱子设置了唯一的GID,这可以用于单独操作或样式化每个柱子。
7.3 在饼图中使用GID
import matplotlib.pyplot as plt

fig, ax = plt.subplots()
fig.suptitle("how2matplotlib.com Pie Chart with GID")

sizes = [15, 30, 45, 10]
labels = ['A', 'B', 'C', 'D']
colors = ['gold', 'yellowgreen', 'lightcoral', 'lightskyblue']

wedges, texts, autotexts = ax.pie(sizes, labels=labels, colors=colors, autopct='%1.1f%%', startangle=90)

for i, wedge in enumerate(wedges):
    wedge.set_gid(f"slice_{i}")

for wedge in wedges:
    print(f"Pie slice GID: {wedge.get_gid()}")

plt.axis('equal')
plt.show()
Output:
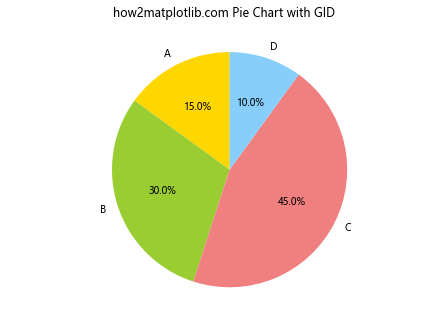
在这个例子中,我们为饼图的每个切片设置了GID,这可以用于后续的交互或动画效果。
8. Axis.get_gid()函数在动画中的应用
GID在创建动画时特别有用,因为它可以帮助我们追踪和更新特定的图形元素。让我们看一个例子:
import matplotlib.pyplot as plt
import matplotlib.animation as animation
import numpy as np

fig, ax = plt.subplots()
fig.suptitle("how2matplotlib.com Animation with GID")

x = np.linspace(0, 2*np.pi, 100)
line, = ax.plot(x, np.sin(x))
line.set_gid("animated_line")

def animate(frame):
    line = [l for l in ax.get_lines() if l.get_gid() == "animated_line"][0]
    line.set_ydata(np.sin(x + frame/10))
    return line,

ani = animation.FuncAnimation(fig, animate, frames=100, interval=50, blit=True)

plt.show()
Output:
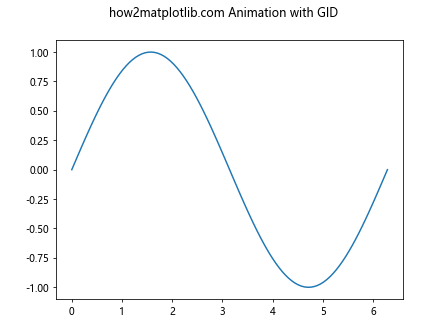
在这个例子中,我们创建了一个简单的正弦波动画。我们为线条对象设置了GID,然后在动画函数中使用这个GID来找到并更新正确的线条。
9. Axis.get_gid()函数在自定义可视化中的应用
GID还可以用于创建自定义的可视化效果。例如,我们可以使用GID来创建一个交互式的多层图表:
import matplotlib.pyplot as plt
import numpy as np

fig, ax = plt.subplots()
fig.suptitle("how2matplotlib.com Custom Visualization with GID")

# 创建多层数据
x = np.linspace(0, 10, 100)
y1 = np.sin(x)
y2 = np.cos(x)
y3 = np.tan(x)

# 绘制多层图表
line1, = ax.plot(x, y1, 'r-', label='Sin')
line2, = ax.plot(x, y2, 'g-', label='Cos')
line3, = ax.plot(x, y3, 'b-', label='Tan')

# 设置GID
line1.set_gid("sin_line")
line2.set_gid("cos_line")
line3.set_gid("tan_line")

ax.set_ylim(-10, 10)
ax.legend()

def on_click(event):
    if event.inaxes == ax:
        for line in ax.get_lines():
            if line.get_gid() == "sin_line":
                line.set_visible(not line.get_visible())
            elif line.get_gid() == "cos_line":
                line.set_visible(not line.get_visible())
            elif line.get_gid() == "tan_line":
                line.set_visible(not line.get_visible())
        fig.canvas.draw()

fig.canvas.mpl_connect('button_press_event', on_click)

plt.show()
Output:
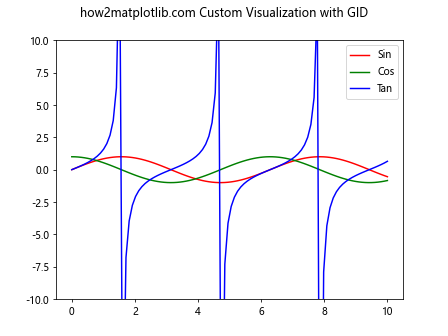
在这个例子中,我们创建了一个包含三条曲线的图表。每条曲线都有一个唯一的GID。我们添加了一个点击事件处理函数,当用户点击图表时,会切换每条曲线的可见性。这种方法允许用户交互式地探索不同的数据层。
10. 总结
Axis.get_gid()函数是Matplotlib中一个强大而灵活的工具。它允许我们为图形元素分配唯一的标识符,这在管理复杂的图表、创建交互式可视化和实现动画效果时非常有用。通过本文的详细介绍和丰富的示例,我们探讨了get_gid()函数的各种应用场景,从基本用法到高级技巧。
在实际应用中,合理使用GID可以大大提高代码的可读性和可维护性。它可以帮助我们更精确地控制图形元素,实现更复杂的可视化效果。然而,也要注意避免过度使用GID,只在真正需要的地方应用它。
通过掌握Axis.get_gid()函数及其相关技巧,你将能够创建更加灵活、交互性更强的数据可视化作品。无论是在科学研究、数据分析还是商业报告中,这些技能都将帮助你更有效地传达信息,展示数据的洞察力。
希望本文能够帮助你更好地理解和运用Axis.get_gid()函数,为你的Matplotlib之旅增添新的工具和灵感。继续探索和实践,你将发现更多Matplotlib的强大功能,创造出更加精彩的数据可视化作品。
 极客教程
极客教程