Matplotlib中的axis.Axis.get_figure()函数详解与应用
参考:Matplotlib.axis.Axis.get_figure() function in Python
Matplotlib是Python中最流行的数据可视化库之一,它提供了丰富的绘图功能和灵活的API。在Matplotlib中,axis.Axis.get_figure()函数是一个非常有用的工具,它允许我们从轴对象获取其所属的图形对象。本文将深入探讨这个函数的用法、应用场景以及相关的示例代码,帮助读者更好地理解和使用这个功能。
1. axis.Axis.get_figure()函数简介
axis.Axis.get_figure()是Matplotlib库中Axis类的一个方法。这个方法的主要作用是返回与当前轴对象相关联的Figure对象。换句话说,它允许我们从一个轴对象获取其所属的整个图形。
这个函数的语法非常简单:
figure = axis.get_figure()
其中,axis是一个Axis对象,而返回的figure是一个Figure对象。
2. 为什么需要get_figure()函数?
在Matplotlib中,图形(Figure)是最顶层的容器,它可以包含一个或多个子图(Subplot)。每个子图都有自己的轴(Axis)对象。有时候,我们可能只有一个轴对象的引用,但需要对整个图形进行操作。这时,get_figure()函数就派上用场了。
以下是一些使用get_figure()函数的常见场景:
- 调整整个图形的大小或布局
- 添加新的子图
- 保存整个图形
- 设置图形级别的属性(如标题、背景色等)
3. 基本用法示例
让我们从一个简单的例子开始,看看如何使用get_figure()函数:
import matplotlib.pyplot as plt

# 创建一个简单的图形
fig, ax = plt.subplots()
ax.plot([1, 2, 3, 4], [1, 4, 2, 3], label='how2matplotlib.com')

# 使用get_figure()获取图形对象
figure = ax.get_figure()

# 设置图形标题
figure.suptitle('使用get_figure()设置标题')

plt.show()
Output:
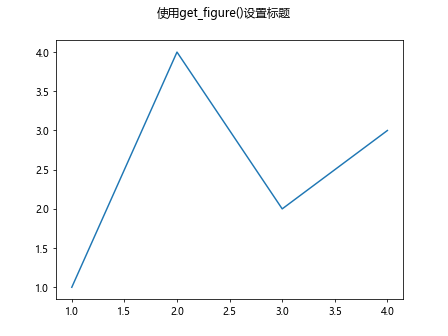
在这个例子中,我们首先创建了一个包含一个子图的图形。然后,我们使用ax.get_figure()获取了图形对象,并使用这个对象设置了图形的标题。
4. 调整图形大小
get_figure()函数常用于调整整个图形的大小。以下是一个示例:
import matplotlib.pyplot as plt

# 创建一个包含两个子图的图形
fig, (ax1, ax2) = plt.subplots(1, 2)
ax1.plot([1, 2, 3], [1, 2, 3], label='how2matplotlib.com')
ax2.plot([3, 2, 1], [1, 2, 3], label='how2matplotlib.com')

# 使用get_figure()获取图形对象并调整大小
figure = ax1.get_figure()
figure.set_size_inches(12, 6)

plt.show()
Output:
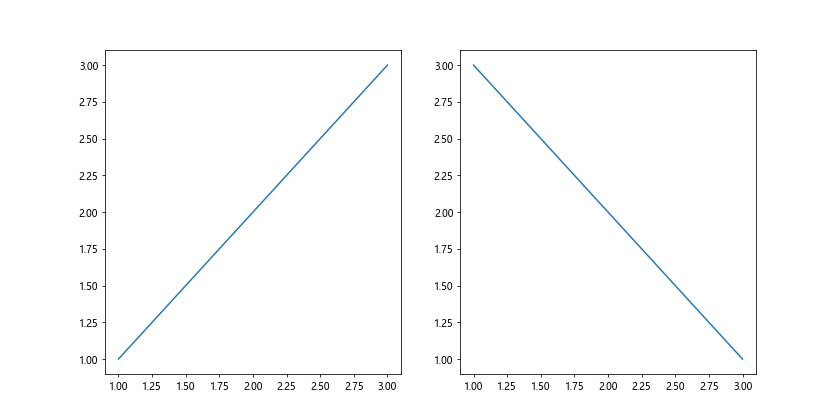
在这个例子中,我们创建了一个包含两个子图的图形。然后,我们使用ax1.get_figure()获取图形对象,并使用set_size_inches()方法调整了图形的大小。
5. 添加新的子图
get_figure()函数也可以用于在现有图形中添加新的子图:
import matplotlib.pyplot as plt

# 创建一个子图
fig, ax = plt.subplots()
ax.plot([1, 2, 3], [1, 2, 3], label='how2matplotlib.com')

# 使用get_figure()获取图形对象
figure = ax.get_figure()

# 添加新的子图
new_ax = figure.add_subplot(212)
new_ax.plot([3, 2, 1], [1, 2, 3], label='how2matplotlib.com')

plt.show()
Output:
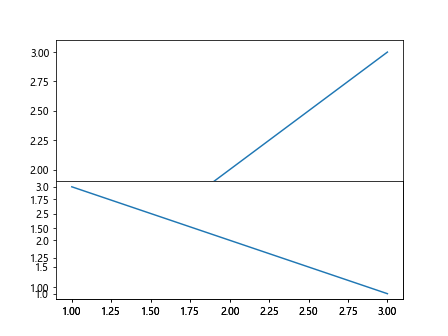
在这个例子中,我们首先创建了一个包含一个子图的图形。然后,我们使用get_figure()获取图形对象,并使用add_subplot()方法添加了一个新的子图。
6. 保存图形
get_figure()函数还可以用于保存整个图形:
import matplotlib.pyplot as plt

# 创建一个简单的图形
fig, ax = plt.subplots()
ax.plot([1, 2, 3, 4], [1, 4, 2, 3], label='how2matplotlib.com')

# 使用get_figure()获取图形对象并保存
figure = ax.get_figure()
figure.savefig('how2matplotlib_example.png')

plt.show()
Output:
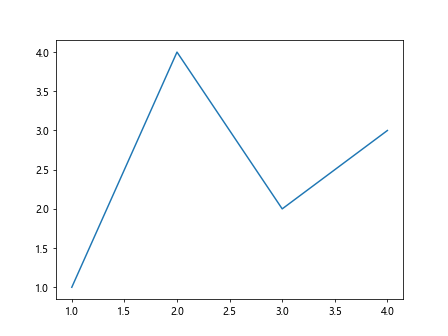
在这个例子中,我们创建了一个简单的图形,然后使用get_figure()获取图形对象,并使用savefig()方法将图形保存为PNG文件。
7. 设置图形级别的属性
get_figure()函数还可以用于设置图形级别的属性,如背景色:
import matplotlib.pyplot as plt

# 创建一个简单的图形
fig, ax = plt.subplots()
ax.plot([1, 2, 3, 4], [1, 4, 2, 3], label='how2matplotlib.com')

# 使用get_figure()获取图形对象并设置背景色
figure = ax.get_figure()
figure.patch.set_facecolor('lightgray')

plt.show()
Output:
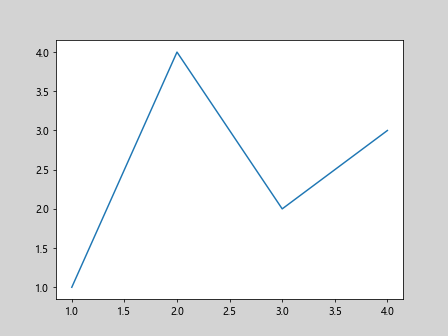
在这个例子中,我们创建了一个简单的图形,然后使用get_figure()获取图形对象,并使用patch.set_facecolor()方法设置了图形的背景色。
8. 在多子图环境中的应用
get_figure()函数在处理多个子图时特别有用。以下是一个示例:
import matplotlib.pyplot as plt

# 创建一个包含多个子图的图形
fig, axes = plt.subplots(2, 2)

for i, ax in enumerate(axes.flat):
    ax.plot([1, 2, 3], [i+1, i+2, i+3], label=f'how2matplotlib.com {i+1}')
    ax.set_title(f'Subplot {i+1}')

# 使用get_figure()获取图形对象并设置总标题
figure = axes[0, 0].get_figure()
figure.suptitle('Multiple Subplots Example')

plt.tight_layout()
plt.show()
Output:
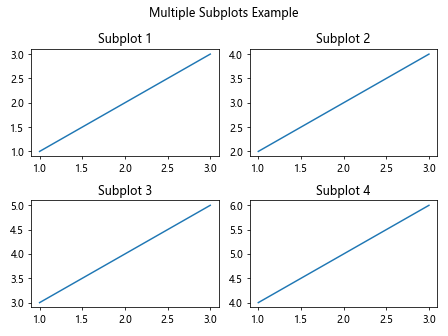
在这个例子中,我们创建了一个2×2的子图网格。然后,我们使用get_figure()从其中一个轴对象获取图形对象,并设置了总标题。
9. 结合其他Matplotlib功能
get_figure()函数可以与其他Matplotlib功能结合使用,以实现更复杂的可视化效果。以下是一个示例:
import matplotlib.pyplot as plt
import numpy as np

# 创建数据
x = np.linspace(0, 10, 100)
y1 = np.sin(x)
y2 = np.cos(x)

# 创建子图
fig, ax = plt.subplots()
ax.plot(x, y1, label='sin(x)')
ax.plot(x, y2, label='cos(x)')
ax.set_title('Trigonometric Functions')
ax.legend()

# 使用get_figure()获取图形对象
figure = ax.get_figure()

# 添加文本注释
figure.text(0.5, 0.02, 'how2matplotlib.com', ha='center')

# 调整布局
figure.tight_layout()

plt.show()
Output:
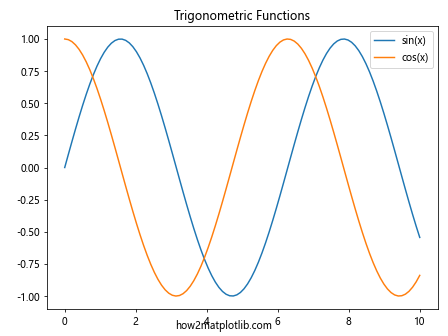
在这个例子中,我们创建了一个包含正弦和余弦函数的图形。然后,我们使用get_figure()获取图形对象,并添加了一个文本注释。
10. 在动画中的应用
get_figure()函数在创建动画时也很有用。以下是一个简单的动画示例:
import matplotlib.pyplot as plt
import matplotlib.animation as animation
import numpy as np

# 创建图形和轴
fig, ax = plt.subplots()
line, = ax.plot([], [], lw=2)
ax.set_xlim(0, 2*np.pi)
ax.set_ylim(-1, 1)

# 初始化函数
def init():
    line.set_data([], [])
    return line,

# 动画函数
def animate(i):
    x = np.linspace(0, 2*np.pi, 100)
    y = np.sin(x + i/10.0)
    line.set_data(x, y)
    return line,

# 使用get_figure()获取图形对象
figure = ax.get_figure()

# 创建动画
anim = animation.FuncAnimation(figure, animate, init_func=init,
                               frames=200, interval=20, blit=True)

# 添加水印
figure.text(0.5, 0.02, 'how2matplotlib.com', ha='center')

plt.show()
Output:
在这个例子中,我们创建了一个简单的正弦波动画。我们使用get_figure()获取图形对象,并将其传递给FuncAnimation函数来创建动画。
11. 在面向对象编程中的应用
get_figure()函数在面向对象的编程方法中也很有用。以下是一个示例:
import matplotlib.pyplot as plt
import numpy as np

class Plotter:
    def __init__(self):
        self.fig, self.ax = plt.subplots()

    def plot_data(self, x, y):
        self.ax.plot(x, y, label='how2matplotlib.com')
        self.ax.legend()

    def set_title(self, title):
        figure = self.ax.get_figure()
        figure.suptitle(title)

    def show(self):
        plt.show()

# 使用Plotter类
plotter = Plotter()
x = np.linspace(0, 10, 100)
y = np.sin(x)
plotter.plot_data(x, y)
plotter.set_title('Sine Wave')
plotter.show()
在这个例子中,我们创建了一个Plotter类,它封装了创建图形和绘图的功能。我们使用get_figure()方法在set_title方法中设置图形的标题。
12. 处理复杂的图形布局
get_figure()函数在处理复杂的图形布局时也很有用。以下是一个示例:
import matplotlib.pyplot as plt
import matplotlib.gridspec as gridspec

# 创建图形
fig = plt.figure(figsize=(12, 8))

# 创建网格规范
gs = gridspec.GridSpec(3, 3)

# 创建子图
ax1 = fig.add_subplot(gs[0, :])
ax2 = fig.add_subplot(gs[1, :-1])
ax3 = fig.add_subplot(gs[1:, -1])
ax4 = fig.add_subplot(gs[-1, 0])
ax5 = fig.add_subplot(gs[-1, -2])

# 在子图中绘制数据
ax1.plot([1, 2, 3], [1, 2, 3], label='how2matplotlib.com 1')
ax2.plot([3, 2, 1], [1, 2, 3], label='how2matplotlib.com 2')
ax3.plot([2, 3, 1], [1, 2, 3], label='how2matplotlib.com 3')
ax4.plot([1, 3, 2], [1, 2, 3], label='how2matplotlib.com 4')
ax5.plot([3, 1, 2], [1, 2, 3], label='how2matplotlib.com 5')

# 使用get_figure()获取图形对象并设置总标题
figure = ax1.get_figure()
figure.suptitle('Complex Layout Example')

plt.tight_layout()
plt.show()
Output:
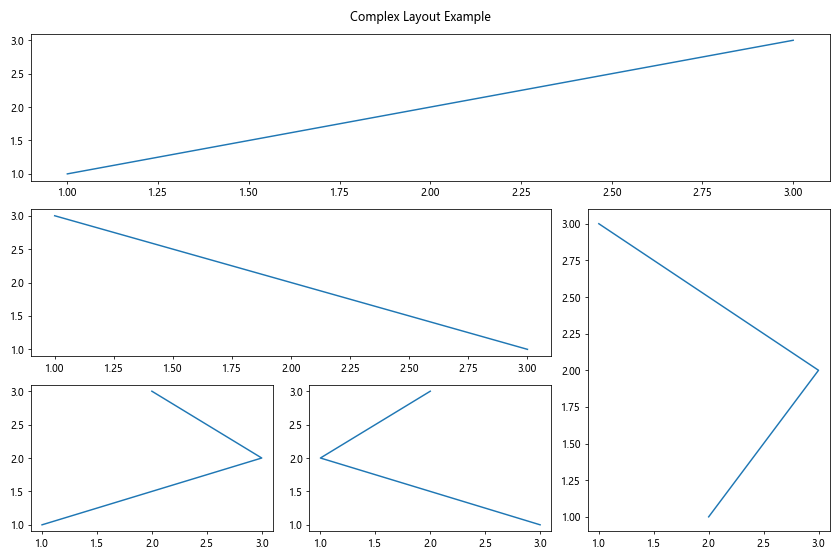
在这个例子中,我们创建了一个具有复杂布局的图形,包含五个不同大小和位置的子图。我们使用get_figure()从其中一个轴对象获取图形对象,并设置了总标题。
13. 在交互式环境中的应用
get_figure()函数在交互式环境(如Jupyter Notebook)中也很有用。以下是一个示例:
%matplotlib inline
import matplotlib.pyplot as plt
import ipywidgets as widgets
from IPython.display import display

# 创建图形和轴
fig, ax = plt.subplots()
line, = ax.plot([], [])
ax.set_xlim(0, 10)
ax.set_ylim(0, 10)

# 创建滑块
slider = widgets.FloatSlider(min=0, max=10, step=0.1, value=5)

# 更新函数
def update(change):
    y = change['new']
    line.set_data([0, 10], [y, y])
    figure = ax.get_figure()
    figure.canvas.draw_idle()

# 连接滑块和更新函数
slider.observe(update, names='value')

# 显示滑块和图形
display(slider)
plt.show()
在这个例子中,我们创建了一个交互式图形,其中包含一个滑块控件。我们使用get_figure()获取图形对象,并在更新函数中重新绘制图形。
14. 在子图中使用不同的坐标系
get_figure()函数在处理具有不同坐标系的子图时也很有用。以下是一个示例:
import matplotlib.pyplot as plt
import numpy as np

# 创建图形和子图
fig, (ax1, ax2) = plt.subplots(1, 2, figsize=(12, 5))

# 在第一个子图中绘制笛卡尔坐标系中的数据
x = np.linspace(0, 10, 100)
y = np.sin(x)
ax1.plot(x, y, label='how2matplotlib.com')
ax1.set_title('Cartesian Coordinates')
ax1.legend()

# 在第二个子图中绘制极坐标系中的数据
r = np.linspace(0, 2, 100)
theta = 2 * np.pi * r
ax2.plot(theta, r, label='how2matplotlib.com')
ax2.set_title('Polar Coordinates')
ax2.legend()
ax2.set_theta_zero_location('N')
ax2.set_theta_direction(-1)

# 使用get_figure()获取图形对象并设置总标题
figure = ax1.get_figure()
figure.suptitle('Different Coordinate Systems')

plt.tight_layout()
plt.show()
在这个例子中,我们创建了两个子图,一个使用笛卡尔坐标系,另一个使用极坐标系。我们使用get_figure()从其中一个轴对象获取图形对象,并设置了总标题。
15. 在3D图形中的应用
get_figure()函数在处理3D图形时也很有用。以下是一个示例:
import matplotlib.pyplot as plt
from mpl_toolkits.mplot3d import Axes3D
import numpy as np

# 创建图形和3D轴
fig = plt.figure(figsize=(10, 8))
ax = fig.add_subplot(111, projection='3d')

# 创建数据
x = np.linspace(-5, 5, 100)
y = np.linspace(-5, 5, 100)
X, Y = np.meshgrid(x, y)
Z = np.sin(np.sqrt(X**2 + Y**2))

# 绘制3D表面
surf = ax.plot_surface(X, Y, Z, cmap='viridis')

# 设置标签
ax.set_xlabel('X')
ax.set_ylabel('Y')
ax.set_zlabel('Z')

# 使用get_figure()获取图形对象并添加颜色条
figure = ax.get_figure()
figure.colorbar(surf, shrink=0.5, aspect=5)

# 添加标题和水印
figure.suptitle('3D Surface Plot')
figure.text(0.5, 0.02, 'how2matplotlib.com', ha='center')

plt.show()
Output:
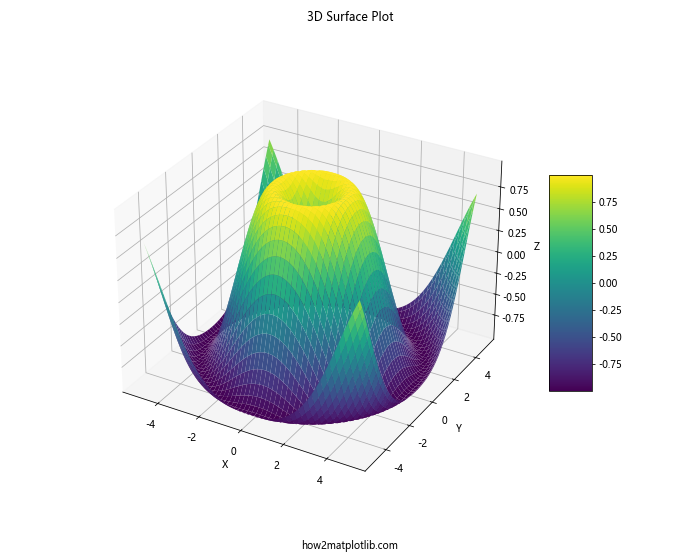
在这个例子中,我们创建了一个3D表面图。我们使用get_figure()获取图形对象,添加了颜色条,并设置了标题和水印。
16. 在子图网格中的应用
get_figure()函数在处理子图网格时也很有用。以下是一个示例:
import matplotlib.pyplot as plt
import numpy as np

# 创建4x4的子图网格
fig, axes = plt.subplots(4, 4, figsize=(12, 12))

# 在每个子图中绘制不同的函数
for i, ax in enumerate(axes.flat):
    x = np.linspace(0, 10, 100)
    y = np.sin(x + i)
    ax.plot(x, y, label=f'how2matplotlib.com {i+1}')
    ax.set_title(f'Subplot {i+1}')
    ax.legend()

# 使用get_figure()获取图形对象并设置总标题
figure = axes[0, 0].get_figure()
figure.suptitle('Subplots Grid Example')

plt.tight_layout()
plt.show()
Output:
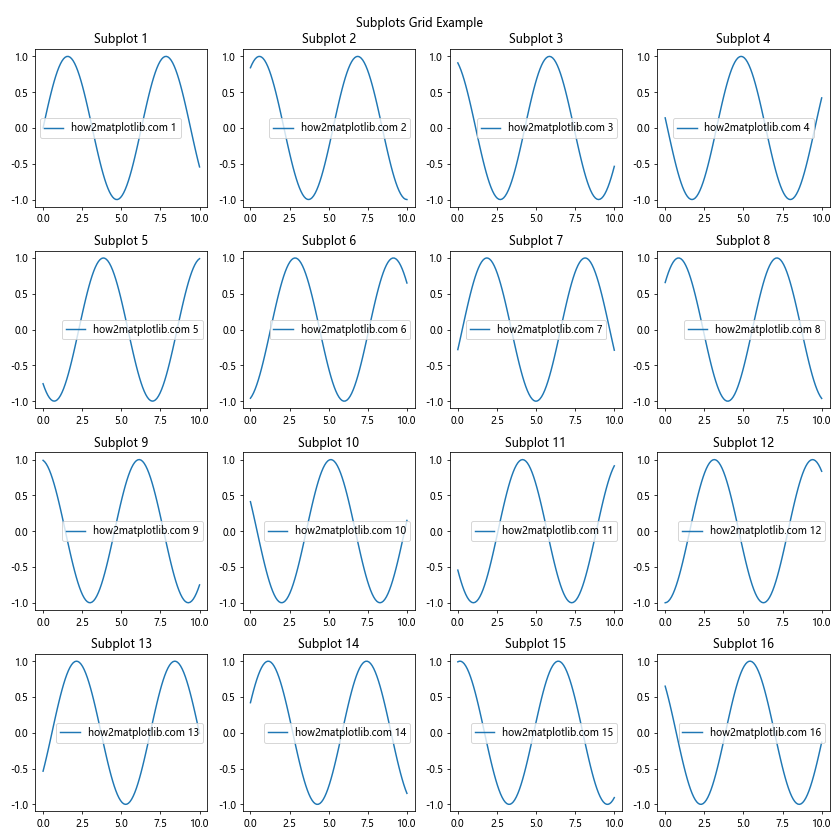
在这个例子中,我们创建了一个4×4的子图网格,每个子图中绘制了不同的正弦函数。我们使用get_figure()从其中一个轴对象获取图形对象,并设置了总标题。
17. 在图形样式中的应用
get_figure()函数在设置图形样式时也很有用。以下是一个示例:
import matplotlib.pyplot as plt
import numpy as np

# 创建数据
x = np.linspace(0, 10, 100)
y1 = np.sin(x)
y2 = np.cos(x)

# 创建图形和轴
fig, ax = plt.subplots()

# 绘制数据
ax.plot(x, y1, label='sin(x)')
ax.plot(x, y2, label='cos(x)')
ax.legend()

# 使用get_figure()获取图形对象并设置样式
figure = ax.get_figure()
figure.set_facecolor('lightgray')
figure.set_edgecolor('black')
figure.set_linewidth(2)

# 设置标题和水印
figure.suptitle('Figure Style Example', fontsize=16)
figure.text(0.5, 0.02, 'how2matplotlib.com', ha='center')

plt.show()
Output:
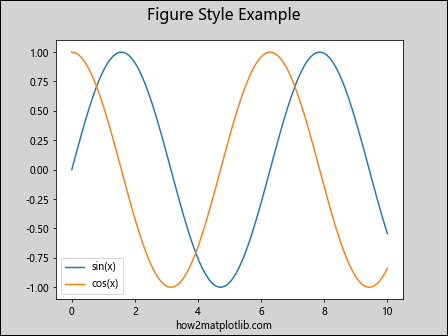
在这个例子中,我们创建了一个包含正弦和余弦函数的图形。我们使用get_figure()获取图形对象,并设置了图形的背景色、边框颜色和线宽。
18. 在图形注释中的应用
get_figure()函数在添加图形级别的注释时也很有用。以下是一个示例:
import matplotlib.pyplot as plt
import numpy as np

# 创建数据
x = np.linspace(0, 10, 100)
y = np.sin(x)

# 创建图形和轴
fig, ax = plt.subplots()

# 绘制数据
ax.plot(x, y, label='sin(x)')
ax.legend()

# 使用get_figure()获取图形对象并添加注释
figure = ax.get_figure()
figure.text(0.1, 0.95, 'Top Left', ha='left', va='top')
figure.text(0.9, 0.95, 'Top Right', ha='right', va='top')
figure.text(0.1, 0.05, 'Bottom Left', ha='left', va='bottom')
figure.text(0.9, 0.05, 'Bottom Right', ha='right', va='bottom')
figure.text(0.5, 0.5, 'how2matplotlib.com', ha='center', va='center', fontsize=20, alpha=0.2)

plt.show()
Output:
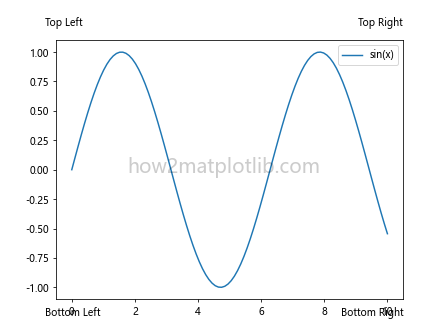
在这个例子中,我们创建了一个包含正弦函数的图形。我们使用get_figure()获取图形对象,并在图形的不同位置添加了文本注释。
19. 在图形导出中的应用
get_figure()函数在导出图形时也很有用。以下是一个示例:
import matplotlib.pyplot as plt
import numpy as np

# 创建数据
x = np.linspace(0, 10, 100)
y = np.sin(x)

# 创建图形和轴
fig, ax = plt.subplots()

# 绘制数据
ax.plot(x, y, label='sin(x)')
ax.legend()

# 使用get_figure()获取图形对象并设置DPI
figure = ax.get_figure()
figure.set_dpi(300)

# 保存图形为不同格式
figure.savefig('how2matplotlib_example.png')
figure.savefig('how2matplotlib_example.pdf')
figure.savefig('how2matplotlib_example.svg')

plt.show()
Output:
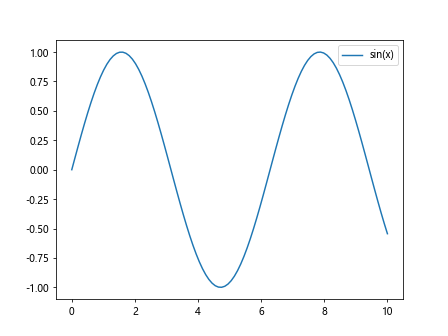
在这个例子中,我们创建了一个包含正弦函数的图形。我们使用get_figure()获取图形对象,设置了DPI(每英寸点数),并将图形保存为不同的文件格式。
20. 在图形事件处理中的应用
get_figure()函数在处理图形事件时也很有用。以下是一个示例:
import matplotlib.pyplot as plt
import numpy as np

# 创建数据
x = np.linspace(0, 10, 100)
y = np.sin(x)

# 创建图形和轴
fig, ax = plt.subplots()

# 绘制数据
ax.plot(x, y, label='sin(x)')
ax.legend()

# 定义点击事件处理函数
def on_click(event):
    if event.inaxes is not None:
        print(f'Clicked at position: ({event.xdata:.2f}, {event.ydata:.2f})')
    else:
        print('Clicked outside the axes')

# 使用get_figure()获取图形对象并连接事件
figure = ax.get_figure()
figure.canvas.mpl_connect('button_press_event', on_click)

# 添加水印
figure.text(0.5, 0.02, 'how2matplotlib.com', ha='center')

plt.show()
Output:
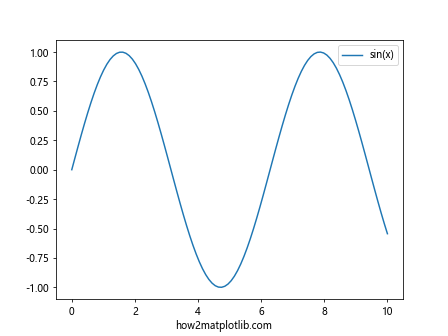
在这个例子中,我们创建了一个包含正弦函数的交互式图形。我们使用get_figure()获取图形对象,并连接了一个点击事件处理函数。当用户点击图形时,会打印出点击的坐标。
总结起来,axis.Axis.get_figure()函数是Matplotlib库中一个非常有用的工具,它允许我们从轴对象获取其所属的图形对象。这个函数在许多场景下都有应用,包括调整图形大小、添加新的子图、保存图形、设置图形级别的属性、处理复杂的图形布局、创建动画、处理3D图形等。通过本文的详细介绍和丰富的示例,读者应该能够更好地理解和使用这个函数,从而在Python中创建更复杂和精美的数据可视化。
 极客教程
极客教程