Matplotlib中如何使用Axes.remove_callback()方法移除回调函数
参考:Matplotlib.axes.Axes.remove_callback() in Python
Matplotlib是Python中最流行的数据可视化库之一,它提供了丰富的绘图功能和自定义选项。在Matplotlib中,Axes对象是绘图的核心,它代表了图表中的一个绘图区域。Axes对象提供了许多方法来操作和自定义图表,其中remove_callback()方法是一个非常有用但经常被忽视的功能。本文将深入探讨Matplotlib中Axes.remove_callback()方法的使用,帮助你更好地理解和应用这个功能。
1. Axes.remove_callback()方法简介
Axes.remove_callback()方法是Matplotlib库中Axes类的一个重要方法。它的主要作用是从Axes对象中移除之前添加的回调函数。回调函数通常用于响应图表的各种事件,如鼠标点击、键盘输入等。通过移除不再需要的回调函数,我们可以优化图表的性能并避免不必要的操作。
1.1 方法语法
remove_callback()方法的基本语法如下:
Axes.remove_callback(cid)
其中,cid是之前通过Axes.callbacks.connect()方法添加回调函数时返回的回调ID。
1.2 使用示例
让我们看一个简单的示例,展示如何添加和移除回调函数:
import matplotlib.pyplot as plt

def on_click(event):
    print(f"Clicked at position: {event.xdata}, {event.ydata}")

fig, ax = plt.subplots()
ax.plot([1, 2, 3, 4], [1, 4, 2, 3], label='how2matplotlib.com')
ax.set_title('Click on the plot')

cid = ax.callbacks.connect('button_press_event', on_click)

# 模拟一些操作后,移除回调函数
ax.remove_callback(cid)

plt.show()
在这个例子中,我们首先定义了一个回调函数on_click,它会在鼠标点击图表时打印点击位置。然后,我们使用ax.callbacks.connect()方法将这个函数连接到’button_press_event’事件。最后,我们使用ax.remove_callback()方法移除了这个回调函数。
2. 回调函数的类型
在Matplotlib中,我们可以为不同类型的事件添加回调函数。了解这些事件类型对于正确使用remove_callback()方法至关重要。以下是一些常见的事件类型:
- 鼠标事件:’button_press_event’, ‘button_release_event’, ‘motion_notify_event’
- 键盘事件:’key_press_event’, ‘key_release_event’
- 图表事件:’resize_event’, ‘draw_event’, ‘close_event’
- 轴事件:’xlim_changed’, ‘ylim_changed’
让我们看一个例子,展示如何为不同类型的事件添加和移除回调函数:
import matplotlib.pyplot as plt

def on_mouse_move(event):
    print(f"Mouse moved to: {event.xdata}, {event.ydata}")

def on_key_press(event):
    print(f"Key pressed: {event.key}")

fig, ax = plt.subplots()
ax.plot([1, 2, 3, 4], [1, 4, 2, 3], label='how2matplotlib.com')
ax.set_title('Interact with the plot')

mouse_cid = ax.callbacks.connect('motion_notify_event', on_mouse_move)
key_cid = fig.canvas.mpl_connect('key_press_event', on_key_press)

# 模拟一些操作后,移除回调函数
ax.remove_callback(mouse_cid)
fig.canvas.mpl_disconnect(key_cid)

plt.show()
在这个例子中,我们为鼠标移动和键盘按键事件添加了回调函数。注意,键盘事件是通过fig.canvas.mpl_connect()方法添加的,因此我们需要使用fig.canvas.mpl_disconnect()方法来移除它。
3. 回调函数的优先级
在Matplotlib中,回调函数是按照添加的顺序执行的。如果你需要控制回调函数的执行顺序,可以使用callbacks.connect()方法的priority参数。优先级越高的回调函数会先执行。
让我们看一个例子,展示如何设置回调函数的优先级:
import matplotlib.pyplot as plt

def callback1(event):
    print("Callback 1 executed")

def callback2(event):
    print("Callback 2 executed")

fig, ax = plt.subplots()
ax.plot([1, 2, 3, 4], [1, 4, 2, 3], label='how2matplotlib.com')
ax.set_title('Callback Priority Example')

cid1 = ax.callbacks.connect('button_press_event', callback1, priority=10)
cid2 = ax.callbacks.connect('button_press_event', callback2, priority=20)

# 模拟一些操作后,移除优先级较高的回调函数
ax.remove_callback(cid2)

plt.show()
在这个例子中,我们为同一个事件添加了两个回调函数,并设置了不同的优先级。callback2的优先级更高,所以它会先执行。然后,我们使用remove_callback()方法移除了优先级较高的回调函数。
4. 动态添加和移除回调函数
在某些情况下,我们可能需要根据用户的交互或其他条件动态地添加和移除回调函数。这可以通过结合使用callbacks.connect()和remove_callback()方法来实现。
以下是一个动态添加和移除回调函数的示例:
import matplotlib.pyplot as plt

def toggle_callback(event):
    global callback_active, cid
    if callback_active:
        ax.remove_callback(cid)
        callback_active = False
        print("Callback removed")
    else:
        cid = ax.callbacks.connect('motion_notify_event', on_mouse_move)
        callback_active = True
        print("Callback added")

def on_mouse_move(event):
    if event.xdata is not None and event.ydata is not None:
        print(f"Mouse position: {event.xdata:.2f}, {event.ydata:.2f}")

fig, ax = plt.subplots()
ax.plot([1, 2, 3, 4], [1, 4, 2, 3], label='how2matplotlib.com')
ax.set_title('Click to toggle mouse move callback')

callback_active = False
cid = None

fig.canvas.mpl_connect('button_press_event', toggle_callback)

plt.show()
Output:

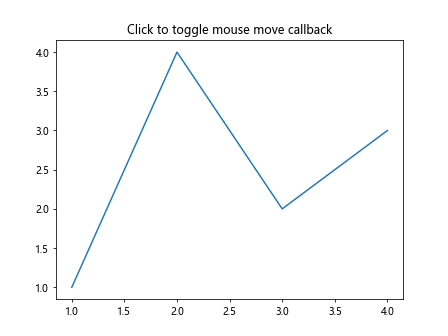
在这个例子中,我们创建了一个toggle_callback函数,它可以在用户点击图表时添加或移除鼠标移动的回调函数。这展示了如何根据用户的交互动态地管理回调函数。
5. 使用lambda函数作为回调
有时,我们可能想要使用简单的lambda函数作为回调,而不是定义一个完整的函数。这在需要快速添加简单回调时非常有用。让我们看一个使用lambda函数作为回调的例子:
import matplotlib.pyplot as plt

fig, ax = plt.subplots()
ax.plot([1, 2, 3, 4], [1, 4, 2, 3], label='how2matplotlib.com')
ax.set_title('Lambda Callback Example')

cid = ax.callbacks.connect('button_press_event', lambda event: print(f"Clicked at: {event.xdata:.2f}, {event.ydata:.2f}"))

# 模拟一些操作后,移除回调函数
ax.remove_callback(cid)

plt.show()
在这个例子中,我们使用lambda函数作为点击事件的回调。这个lambda函数简单地打印了点击的坐标。然后,我们像移除普通回调函数一样移除了这个lambda回调。
6. 回调函数中的错误处理
当使用回调函数时,错误处理是一个重要的考虑因素。如果回调函数中发生未捕获的异常,它可能会中断整个程序的执行。因此,在回调函数中添加适当的错误处理是一个好习惯。
以下是一个包含错误处理的回调函数示例:
import matplotlib.pyplot as plt

def safe_callback(event):
    try:
        # 可能引发异常的代码
        result = 10 / (event.xdata - 2)
        print(f"Result: {result}")
    except Exception as e:
        print(f"An error occurred: {e}")

fig, ax = plt.subplots()
ax.plot([1, 2, 3, 4], [1, 4, 2, 3], label='how2matplotlib.com')
ax.set_title('Error Handling in Callbacks')

cid = ax.callbacks.connect('button_press_event', safe_callback)

# 模拟一些操作后,移除回调函数
ax.remove_callback(cid)

plt.show()
在这个例子中,我们的回调函数safe_callback包含了一个可能引发除零错误的操作。通过使用try-except块,我们可以捕获并处理这个异常,防止它中断程序的执行。
7. 多个Axes对象的回调管理
在复杂的图表中,我们可能会有多个Axes对象,每个对象都有自己的回调函数。在这种情况下,正确管理和移除回调函数变得更加重要。
让我们看一个管理多个Axes对象回调的例子:
import matplotlib.pyplot as plt

def on_click(event):
    print(f"Clicked on axes: {event.inaxes}")

fig, (ax1, ax2) = plt.subplots(1, 2)
ax1.plot([1, 2, 3, 4], [1, 4, 2, 3], label='how2matplotlib.com')
ax2.plot([1, 2, 3, 4], [3, 2, 4, 1], label='how2matplotlib.com')

ax1.set_title('Axes 1')
ax2.set_title('Axes 2')

cid1 = ax1.callbacks.connect('button_press_event', on_click)
cid2 = ax2.callbacks.connect('button_press_event', on_click)

# 模拟一些操作后,移除第一个Axes的回调函数
ax1.remove_callback(cid1)

plt.show()
在这个例子中,我们创建了两个Axes对象,并为每个对象添加了相同的回调函数。然后,我们只移除了第一个Axes对象的回调函数,展示了如何独立管理不同Axes对象的回调。
8. 回调函数与动画
Matplotlib的动画功能也可以与回调函数结合使用,创建交互式动画。在这种情况下,正确管理回调函数变得尤为重要,因为不恰当的回调可能会影响动画的性能。
以下是一个结合动画和回调函数的示例:
import matplotlib.pyplot as plt
import matplotlib.animation as animation
import numpy as np

fig, ax = plt.subplots()
line, = ax.plot([], [], label='how2matplotlib.com')
ax.set_xlim(0, 2*np.pi)
ax.set_ylim(-1, 1)

def init():
    line.set_data([], [])
    return line,

def animate(i):
    x = np.linspace(0, 2*np.pi, 100)
    y = np.sin(x + i/10.0)
    line.set_data(x, y)
    return line,

def on_click(event):
    print(f"Clicked at frame: {ani.frame_seq.index}")

ani = animation.FuncAnimation(fig, animate, init_func=init, frames=200, interval=50, blit=True)

cid = fig.canvas.mpl_connect('button_press_event', on_click)

# 在动画结束后移除回调函数
def cleanup(event):
    if event.key == 'q':
        fig.canvas.mpl_disconnect(cid)
        print("Callback removed")

fig.canvas.mpl_connect('key_press_event', cleanup)

plt.show()
Output:

在这个例子中,我们创建了一个简单的正弦波动画,并添加了一个点击事件的回调函数。我们还添加了一个清理函数,当用户按下’q’键时,它会移除回调函数。这展示了如何在动画环境中管理回调函数。
9. 回调函数与自定义事件
除了Matplotlib提供的标准事件外,我们还可以创建和使用自定义事件。这为回调函数的使用提供了更大的灵活性。让我们看一个使用自定义事件的例子:
import matplotlib.pyplot as plt
from matplotlib.backend_bases import Event

class CustomEvent(Event):
    def __init__(self, name, canvas, x, y):
        Event.__init__(self, name, canvas)
        self.x = x
        self.y = y

def on_custom_event(event):
    print(f"Custom event occurred at: {event.x}, {event.y}")

fig, ax = plt.subplots()
ax.plot([1, 2, 3, 4], [1, 4, 2, 3], label='how2matplotlib.com')
ax.set_title('Custom Event Example')

cid = ax.callbacks.connect('custom_event', on_custom_event)

# 模拟触发自定义事件
custom_event = CustomEvent('custom_event', fig.canvas, 2.5, 3.5)
ax.callbacks.process('custom_event', custom_event)

# 移除自定义事件的回调函数
ax.remove_callback(cid)

plt.show()
在这个例子中,我们定义了一个自定义事件CustomEvent,并为其创建了一个回调函数。我们可以在需要的时候触发这个自定义事件,并且可以像处理标准事件一样移除其回调函数。
10. 回调函数的性能考虑
当使用回调函数时,需要考虑性能问题,特别是在处理大量数据或频繁触发事件的情况下。以下是一些提高回调函数性能的建议:
- 保持回调函数简洁:复杂的回调函数可能会降低性能。
- 避免在回调函数中进行耗时操作:如果必须进行耗时操作,考虑使用异步处理。
- 及时移除不需要的回调函数:使用
remove_callback()方法移除不再需要的回调函数。 - 使用节流或去抖动技术:对于频繁触发的事件,可以使用这些技术来限制回调函数的执行频率。
让我们看一个使用简单节流技术的例子:
import matplotlib.pyplot as plt
import time

class Throttle:
    def __init__(self, delay):
        self.delay = delay
        self.last_call = 0

    def __call__(self, func):
        def wrapper(*args, **kwargs):
            now = time.time()
            if now - self.last_call >= self.delay:
                self.last_call = now
                return func(*args, **kwargs)
        return wrapper

@Throttle(0.5)
def on_mouse_move(event):
    if event.xdata is not None and event.ydata is not None:
        print(f"Mouse position: {event.xdata:.2f}, {event.ydata:.2f}")

fig, ax = plt.subplots()
ax.plot([1, 2, 3, 4], [1, 4, 2, 3], label='how2matplotlib.com')
ax.set_title('Throttled Callback Example')

cid = ax.callbacks.connect('motion_notify_event', on_mouse_move)

# 模拟一些操作后,移除回调函数
ax.remove_callback(cid)

plt.show()
在这个例子中,我们使用了一个简单的Throttle装饰器来限制on_mouse_move回调函数的执行频率。这可以显著减少回调函数的调用次数,从而提高性能。
11. 回调函数与图表交互
回调函数可以用来创建高度交互的图表。例如,我们可以使用回调函数来实现自定义的缩放、平移或数据选择功能。以下是一个实现简单数据选择功能的例子:
import matplotlib.pyplot as plt
import numpy as np

class DataSelector:
    def __init__(self, ax):
        self.ax = ax
        self.selected = []
        self.cid = ax.figure.canvas.mpl_connect('button_press_event', self.on_click)

    def on_click(self, event):
        if event.inaxes != self.ax:
            return
        cont, ind = self.ax.collections[0].contains(event)
        if cont:
            point = ind["ind"][0]
            if point in self.selected:
                self.selected.remove(point)
            else:
                self.selected.append(point)
            self.update_plot()

    def update_plot(self):
        x = np.linspace(0, 10, 100)
        y = np.sin(x)
        self.ax.clear()
        self.ax.plot(x, y, 'b-', label='how2matplotlib.com')
        self.ax.scatter(x[self.selected], y[self.selected], color='red')
        self.ax.figure.canvas.draw()

    def disconnect(self):
        self.ax.figure.canvas.mpl_disconnect(self.cid)

fig, ax = plt.subplots()
x = np.linspace(0, 10, 100)
y = np.sin(x)
ax.plot(x, y, 'b-', label='how2matplotlib.com')
ax.set_title('Click to select points')

selector = DataSelector(ax)

plt.show()

# 清理
selector.disconnect()
Output:

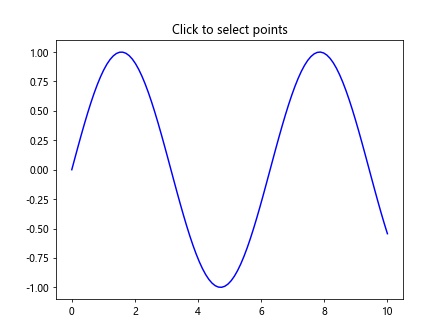
在这个例子中,我们创建了一个DataSelector类,它允许用户通过点击来选择数据点。每次点击时,回调函数都会更新图表,高亮显示选中的点。这展示了如何使用回调函数创建交互式数据可视化工具。
12. 回调函数与其他Matplotlib组件的集成
回调函数可以与Matplotlib的其他组件集成,如工具栏、导航栏等。这允许我们创建更复杂和功能丰富的可视化应用。以下是一个将回调函数与Matplotlib工具栏集成的例子:
import matplotlib.pyplot as plt
from matplotlib.backend_tools import ToolToggleBase

class CustomTool(ToolToggleBase):
    default_toggled = False
    description = 'Custom tool'

    def __init__(self, *args, **kwargs):
        super().__init__(*args, **kwargs)
        self.cid = None

    def enable(self, event):
        self.cid = event.canvas.mpl_connect('button_press_event', self.on_click)

    def disable(self, event):
        if self.cid:
            event.canvas.mpl_disconnect(self.cid)
            self.cid = None

    def on_click(self, event):
        if event.inaxes:
            print(f"Custom tool clicked at: {event.xdata:.2f}, {event.ydata:.2f}")

fig, ax = plt.subplots()
ax.plot([1, 2, 3, 4], [1, 4, 2, 3], label='how2matplotlib.com')
ax.set_title('Custom Tool Example')

tool_name = 'custom'
fig.canvas.manager.toolmanager.add_tool(tool_name, CustomTool)
fig.canvas.manager.toolbar.add_tool(tool_name, 'toolgroup')

plt.show()
在这个例子中,我们创建了一个自定义工具CustomTool,它可以添加到Matplotlib的工具栏中。这个工具使用回调函数来响应用户的点击事件。当工具被激活时,它会连接回调函数;当工具被禁用时,它会断开回调函数。这展示了如何将回调函数与Matplotlib的用户界面组件集成。
13. 回调函数与数据更新
回调函数还可以用于实现实时数据更新。这在创建动态图表或实时数据可视化时特别有用。以下是一个使用回调函数实现简单实时数据更新的例子:
import matplotlib.pyplot as plt
import numpy as np
from matplotlib.animation import FuncAnimation

class RealtimePlotter:
    def __init__(self, ax, max_points=100):
        self.ax = ax
        self.max_points = max_points
        self.line, = ax.plot([], [], label='how2matplotlib.com')
        self.data = []
        self.cid = None

    def update(self, frame):
        self.data.append(np.random.random())
        if len(self.data) > self.max_points:
            self.data = self.data[-self.max_points:]
        self.line.set_data(range(len(self.data)), self.data)
        self.ax.relim()
        self.ax.autoscale_view()
        return self.line,

    def start(self):
        self.ani = FuncAnimation(self.ax.figure, self.update, interval=100, blit=True)
        self.cid = self.ax.figure.canvas.mpl_connect('button_press_event', self.on_click)

    def on_click(self, event):
        if event.inaxes == self.ax:
            print(f"Clicked at value: {event.ydata:.2f}")

    def stop(self):
        self.ani.event_source.stop()
        if self.cid:
            self.ax.figure.canvas.mpl_disconnect(self.cid)

fig, ax = plt.subplots()
ax.set_title('Realtime Data Update')
ax.set_xlim(0, 100)
ax.set_ylim(0, 1)

plotter = RealtimePlotter(ax)
plotter.start()

plt.show()

# 清理
plotter.stop()
Output:

在这个例子中,我们创建了一个RealtimePlotter类,它使用FuncAnimation来实现实时数据更新。同时,我们还添加了一个点击事件的回调函数,允许用户与实时更新的图表交互。这展示了如何结合使用回调函数和动画来创建动态、交互式的数据可视化。
14. 回调函数的调试技巧
调试回调函数可能会比调试普通函数更具挑战性,因为它们是在特定事件发生时被调用的。以下是一些调试回调函数的技巧:
- 使用print语句:在回调函数中添加print语句可以帮助你了解函数何时被调用以及传入了什么参数。
- 使用日志:比print更好的选择是使用Python的logging模块,它提供了更多的灵活性和控制。
- 使用断点:如果你使用IDE,可以在回调函数中设置断点来逐步调试。
- 错误处理:在回调函数中使用try-except块可以捕获和记录错误,而不会中断程序的执行。
让我们看一个包含这些调试技巧的例子:
import matplotlib.pyplot as plt
import logging

logging.basicConfig(level=logging.DEBUG)
logger = logging.getLogger(__name__)

def debug_callback(event):
    try:
        logger.debug(f"Event type: {event.name}")
        logger.debug(f"Event occurred at: {event.xdata:.2f}, {event.ydata:.2f}")

        # 模拟一个可能出错的操作
        result = 10 / (event.xdata - 2)
        logger.info(f"Operation result: {result}")

    except Exception as e:
        logger.error(f"An error occurred: {e}")

fig, ax = plt.subplots()
ax.plot([1, 2, 3, 4], [1, 4, 2, 3], label='how2matplotlib.com')
ax.set_title('Callback Debugging Example')

cid = ax.callbacks.connect('button_press_event', debug_callback)

plt.show()

# 清理
ax.remove_callback(cid)
在这个例子中,我们使用了logging模块来记录回调函数的执行情况。我们还添加了错误处理来捕获可能发生的异常。这些技巧可以帮助你更容易地调试复杂的回调函数。
结论
Matplotlib的Axes.remove_callback()方法是一个强大而灵活的工具,它允许我们动态地管理图表的交互行为。通过本文的详细介绍和丰富的示例,我们探讨了如何有效地使用这个方法,以及如何在各种场景下应用回调函数。
从基本的使用到高级的应用,如动画、自定义事件和实时数据更新,我们看到了回调函数在创建交互式和动态数据可视化中的重要作用。同时,我们也讨论了性能考虑和调试技巧,这些对于开发复杂的Matplotlib应用至关重要。
通过掌握remove_callback()方法和相关的回调函数技术,你可以创建更加灵活、响应迅速和用户友好的数据可视化应用。无论是简单的交互式图表还是复杂的实时数据分析工具,这些技术都将为你的Matplotlib使用增添新的维度。
记住,有效的回调管理不仅可以提高应用的性能,还可以使你的代码更加清晰和易于维护。在实际应用中,根据具体需求灵活运用这些技术,将帮助你充分发挥Matplotlib的潜力,创造出令人印象深刻的数据可视化作品。
 极客教程
极客教程