Matplotlib中使用Artist.set_transform()方法设置坐标变换
参考:Matplotlib.artist.Artist.set_transform() in Python
Matplotlib是Python中强大的数据可视化库,其中Artist类是绘图元素的基类。本文将深入探讨Artist类的set_transform()方法,这是一个用于设置坐标变换的重要函数。通过本文,您将了解如何使用set_transform()方法来改变图形元素的位置、大小和形状,从而创建更加灵活和动态的可视化效果。
1. Artist类简介
在Matplotlib中,Artist类是所有可视化元素的基类。它包括线条、文本、填充区域等各种图形对象。Artist类提供了许多方法来控制这些对象的属性,其中set_transform()方法是用于设置坐标变换的关键函数。
让我们从一个简单的例子开始,创建一个基本的Artist对象:
import matplotlib.pyplot as plt
from matplotlib.patches import Rectangle

fig, ax = plt.subplots()
rect = Rectangle((0.1, 0.1), 0.5, 0.5, fill=False)
ax.add_patch(rect)
ax.text(0.5, 0.5, 'how2matplotlib.com', ha='center', va='center')
plt.show()
Output:
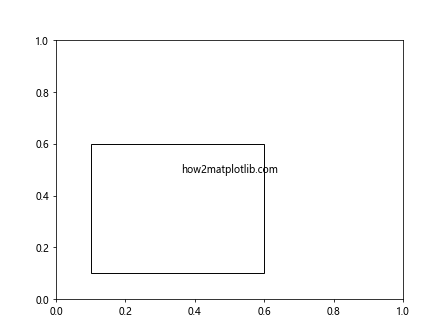
在这个例子中,我们创建了一个矩形对象和一个文本对象,它们都是Artist的子类。
2. set_transform()方法概述
set_transform()方法允许我们为Artist对象设置一个变换对象。这个变换对象定义了如何将Artist的坐标从一个坐标系统映射到另一个坐标系统。
基本语法如下:
artist.set_transform(transform)
其中,transform是一个Matplotlib的Transform对象,用于定义坐标变换。
3. 常用的Transform对象
Matplotlib提供了多种Transform对象,以下是一些常用的:
- IdentityTransform:不进行任何变换
- Affine2D:进行二维仿射变换
- ScaledTranslation:缩放和平移变换
- RotatedBbox:旋转变换
让我们看一个使用Affine2D的例子:
import matplotlib.pyplot as plt
from matplotlib.patches import Rectangle
from matplotlib.transforms import Affine2D

fig, ax = plt.subplots()
rect = Rectangle((0.1, 0.1), 0.5, 0.5, fill=False)
transform = Affine2D().rotate_deg(45).translate(0.2, 0.2)
rect.set_transform(transform + ax.transData)
ax.add_patch(rect)
ax.text(0.5, 0.5, 'how2matplotlib.com', ha='center', va='center')
plt.show()
Output:
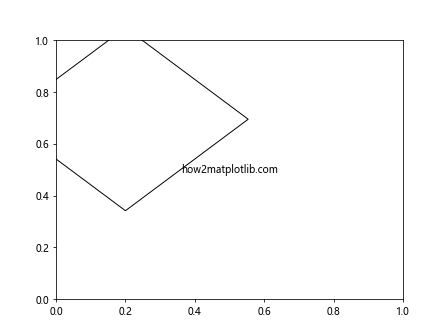
在这个例子中,我们创建了一个Affine2D变换,先旋转45度,然后平移(0.2, 0.2)。通过set_transform()方法,我们将这个变换应用到矩形对象上。
4. 坐标系统和变换
在Matplotlib中,有几种不同的坐标系统:
- 数据坐标系(Data coordinates)
- 轴坐标系(Axes coordinates)
- 图形坐标系(Figure coordinates)
- 显示坐标系(Display coordinates)
set_transform()方法允许我们在这些坐标系统之间进行转换。例如:
import matplotlib.pyplot as plt
from matplotlib.patches import Rectangle

fig, ax = plt.subplots()
rect = Rectangle((0.1, 0.1), 0.5, 0.5, fill=False)
rect.set_transform(ax.transAxes)
ax.add_patch(rect)
ax.text(0.5, 0.5, 'how2matplotlib.com', ha='center', va='center', transform=ax.transAxes)
plt.show()
Output:
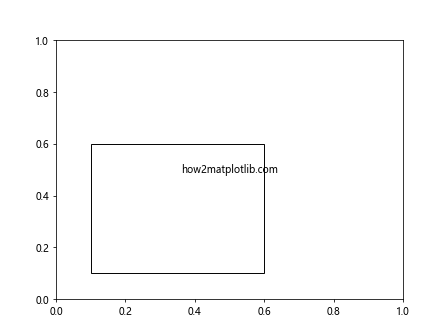
在这个例子中,我们使用ax.transAxes将矩形和文本放置在轴坐标系中,而不是默认的数据坐标系。
5. 复合变换
Matplotlib允许我们组合多个变换来创建复杂的效果。例如:
import matplotlib.pyplot as plt
from matplotlib.patches import Rectangle
from matplotlib.transforms import Affine2D

fig, ax = plt.subplots()
rect = Rectangle((0.1, 0.1), 0.5, 0.5, fill=False)
transform = Affine2D().rotate_deg(30).scale(1.5, 0.7)
rect.set_transform(transform + ax.transAxes)
ax.add_patch(rect)
ax.text(0.5, 0.5, 'how2matplotlib.com', ha='center', va='center', transform=ax.transAxes)
plt.show()
Output:
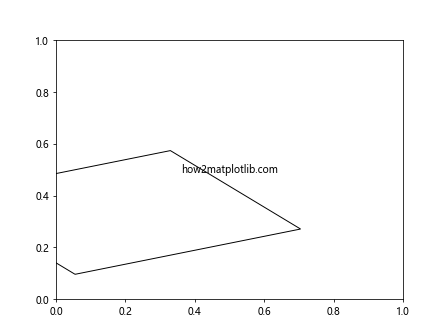
在这个例子中,我们组合了旋转和缩放变换,然后将结果与轴变换相加。
6. 动态变换
set_transform()方法也可以用于创建动态效果。例如,我们可以创建一个随时间变化的动画:
import matplotlib.pyplot as plt
from matplotlib.patches import Rectangle
from matplotlib.transforms import Affine2D
import numpy as np

fig, ax = plt.subplots()
rect = Rectangle((0.1, 0.1), 0.5, 0.5, fill=False)
ax.add_patch(rect)
ax.text(0.5, 0.5, 'how2matplotlib.com', ha='center', va='center')

def animate(i):
    angle = i * 10
    transform = Affine2D().rotate_deg(angle).translate(0.2 * np.cos(np.radians(angle)), 0.2 * np.sin(np.radians(angle)))
    rect.set_transform(transform + ax.transData)
    return rect,

from matplotlib.animation import FuncAnimation
anim = FuncAnimation(fig, animate, frames=36, interval=50, blit=True)
plt.show()
Output:
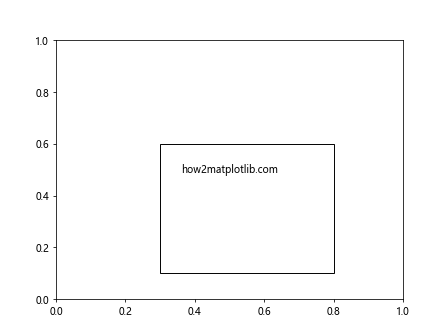
这个例子创建了一个旋转并沿圆形路径移动的矩形动画。
7. 自定义变换
除了使用Matplotlib提供的标准变换,我们还可以创建自定义变换。例如:
import matplotlib.pyplot as plt
from matplotlib.patches import Rectangle
from matplotlib.transforms import Transform
import numpy as np

class SineWaveTransform(Transform):
    input_dims = 2
    output_dims = 2

    def transform_non_affine(self, values):
        x, y = values
        return x, y + 0.1 * np.sin(5 * x)

fig, ax = plt.subplots()
rect = Rectangle((0.1, 0.1), 0.8, 0.3, fill=False)
rect.set_transform(SineWaveTransform() + ax.transData)
ax.add_patch(rect)
ax.text(0.5, 0.5, 'how2matplotlib.com', ha='center', va='center')
plt.show()
这个例子创建了一个自定义变换,将矩形沿正弦波扭曲。
8. 在3D图形中使用set_transform()
set_transform()方法也可以在3D图形中使用。例如:
import matplotlib.pyplot as plt
from mpl_toolkits.mplot3d import Axes3D
from matplotlib.patches import Rectangle
import mpl_toolkits.mplot3d.art3d as art3d
from matplotlib.transforms import Affine2D

fig = plt.figure()
ax = fig.add_subplot(111, projection='3d')

rect = Rectangle((0, 0), 1, 1, fill=False)
transform = Affine2D().rotate_deg(45).translate(0.5, 0.5)
rect.set_transform(transform)

art3d.pathpatch_2d_to_3d(rect, z=0.5, zdir="x")
ax.add_patch(rect)

ax.set_xlim(0, 1)
ax.set_ylim(0, 1)
ax.set_zlim(0, 1)
ax.text(0.5, 0.5, 0.5, 'how2matplotlib.com', ha='center', va='center')
plt.show()
这个例子在3D空间中创建了一个旋转的矩形。
9. 在极坐标系中使用set_transform()
set_transform()方法也可以用于极坐标系:
import matplotlib.pyplot as plt
import numpy as np
from matplotlib.patches import Rectangle
from matplotlib.transforms import Affine2D

fig, ax = plt.subplots(subplot_kw=dict(projection='polar'))
rect = Rectangle((0, 0.5), np.pi/4, 0.3, fill=False)
transform = Affine2D().scale(np.pi/180., 1.).translate(45, 0)
rect.set_transform(transform + ax.transData)
ax.add_patch(rect)
ax.text(np.pi/4, 0.7, 'how2matplotlib.com', ha='center', va='center')
plt.show()
Output:
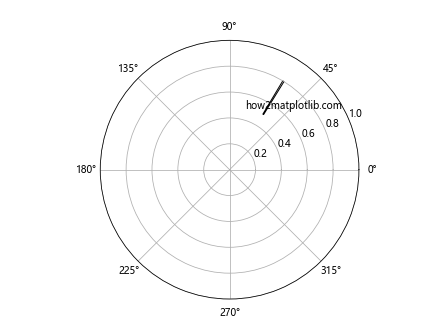
这个例子在极坐标系中创建了一个矩形。
10. 在子图中使用set_transform()
set_transform()方法可以在子图中使用,以创建复杂的布局:
import matplotlib.pyplot as plt
from matplotlib.patches import Rectangle
from matplotlib.transforms import Affine2D

fig, (ax1, ax2) = plt.subplots(1, 2, figsize=(10, 5))

rect1 = Rectangle((0.1, 0.1), 0.5, 0.5, fill=False)
ax1.add_patch(rect1)
ax1.text(0.5, 0.5, 'how2matplotlib.com\nSubplot 1', ha='center', va='center')

rect2 = Rectangle((0.1, 0.1), 0.5, 0.5, fill=False)
transform = Affine2D().rotate_deg(45)
rect2.set_transform(transform + ax2.transData)
ax2.add_patch(rect2)
ax2.text(0.5, 0.5, 'how2matplotlib.com\nSubplot 2', ha='center', va='center')

plt.show()
Output:
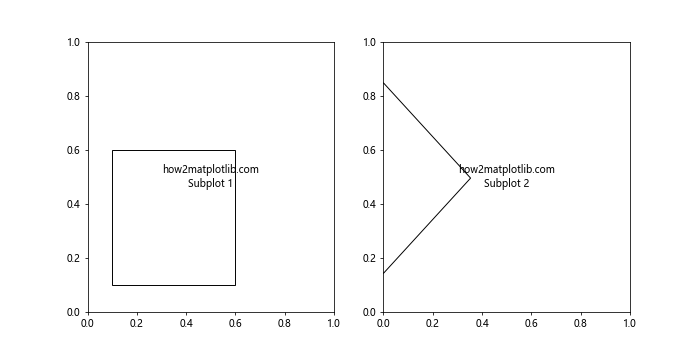
这个例子创建了两个子图,一个包含普通矩形,另一个包含旋转的矩形。
11. 在图例中使用set_transform()
set_transform()方法也可以用于自定义图例的外观:
import matplotlib.pyplot as plt
from matplotlib.patches import Rectangle
from matplotlib.transforms import Affine2D

fig, ax = plt.subplots()

rect1 = Rectangle((0, 0), 1, 1, fill=False)
rect2 = Rectangle((0, 0), 1, 1, fill=False)
transform = Affine2D().rotate_deg(45)
rect2.set_transform(transform)

ax.add_patch(rect1)
ax.add_patch(rect2)

ax.legend([rect1, rect2], ['Normal', 'Rotated'], loc='upper left')
ax.text(0.5, 0.5, 'how2matplotlib.com', ha='center', va='center')
plt.show()
Output:
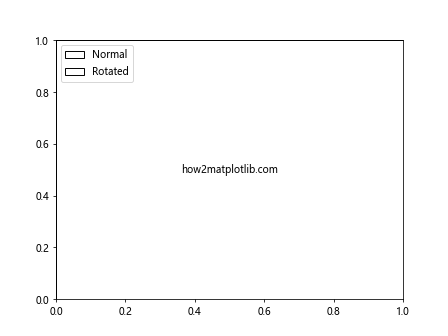
这个例子创建了一个包含普通矩形和旋转矩形的图例。
12. 在文本对象中使用set_transform()
set_transform()方法不仅可以用于图形对象,还可以用于文本对象:
import matplotlib.pyplot as plt
from matplotlib.transforms import Affine2D

fig, ax = plt.subplots()

text = ax.text(0.5, 0.5, 'how2matplotlib.com', ha='center', va='center')
transform = Affine2D().rotate_deg(45).scale(1.5, 1)
text.set_transform(transform + ax.transData)

plt.show()
Output:
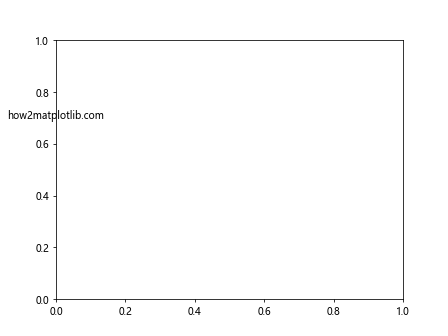
这个例子创建了一个旋转和缩放的文本对象。
13. 在图像对象中使用set_transform()
set_transform()方法也可以用于图像对象:
import matplotlib.pyplot as plt
import numpy as np
from matplotlib.transforms import Affine2D

fig, ax = plt.subplots()

# 创建一个简单的图像
image = np.random.rand(10, 10)
im = ax.imshow(image, extent=[0, 1, 0, 1])

# 创建变换
transform = Affine2D().rotate_deg(45).scale(0.7)
im.set_transform(transform + ax.transData)

ax.text(0.5, 0.5, 'how2matplotlib.com', ha='center', va='center')
plt.show()
Output:
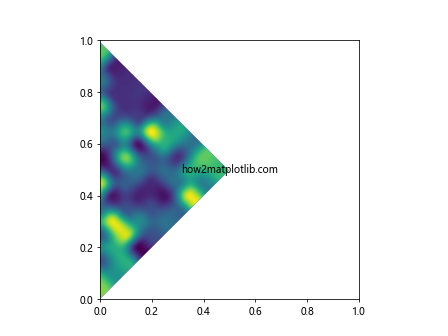
这个例子创建了一个旋转和缩放的图像对象。
14. 在动画中使用set_transform()
set_transform()方法可以用于创建复杂的动画效果:
import matplotlib.pyplot as plt
from matplotlib.patches import Rectangle
from matplotlib.transforms import Affine2D
import numpy as np
from matplotlib.animation import FuncAnimation

fig, ax = plt.subplots()

rect = Rectangle((0, 0), 0.5, 0.5, fill=False)
ax.add_patch(rect)

def animate(i):
    angle = i * 10
    scale = 1 + 0.5 * np.sin(np.radians(angle))
    transform = Affine2D().rotate_deg(angle).scale(scale)
    rect.set_transform(transform + ax.transData)
    return rect,

anim = FuncAnimation(fig, animate, frames=36, interval=50, blit=True)

ax.text(0.5, 0.5, 'how2matplotlib.com', ha='center', va='center')
plt.show()
Output:

这个例子创建了一个同时旋转和缩放的矩形动画。
15. 在自定义Artist中使用set_transform()
我们可以创建自定义的Artist类,并在其中使用set_transform()方法:
import matplotlib.pyplot as plt
from matplotlib.patches import Patch
from matplotlib.transforms import Affine2D
import numpy as np

class StarPatch(Patch):
    def __init__(self, xy, size, **kwargs):
        super().__init__(**kwargs)
        self.xy = xy
        self.size = size

    def get_path(self):
        from matplotlib.path import Path
        angle = np.linspace(0, 2*np.pi, 11, endpoint=False)
        r = self.size * np.array([1, 0.5] * 5)
        points = np.vstack((r * np.cos(angle), r * np.sin(angle))).T
        return Path(points, closed=True)

fig, ax = plt.subplots()

star = StarPatch((0.5, 0.5), 0.3, facecolor='none', edgecolor='black')
transform = Affine2D().rotate_deg(30)
star.set_transform(transform + ax.transData)
ax.add_patch(star)

ax.text(0.5, 0.5, 'how2matplotlib.com', ha='center', va='center')
plt.show()
这个例子创建了一个自定义的星形Artist,并使用set_transform()方法对其进行旋转。
16. 在极坐标系中使用复合变换
我们可以在极坐标系中使用复合变换来创建更复杂的效果:
import matplotlib.pyplot as plt
import numpy as np
from matplotlib.patches import Rectangle
from matplotlib.transforms import Affine2D

fig, ax = plt.subplots(subplot_kw=dict(projection='polar'))

rect = Rectangle((0, 0.5), np.pi/4, 0.3, fill=False)
transform = Affine2D().scale(np.pi/180., 1.).translate(45, 0).rotate_deg(30)
rect.set_transform(transform + ax.transData)
ax.add_patch(rect)

ax.text(np.pi/4, 0.7, 'how2matplotlib.com', ha='center', va='center')
plt.show()
Output:
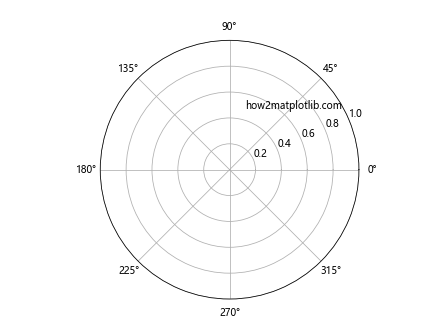
这个例子在极坐标系中创建了一个经过缩放、平移和旋转的矩形。
17. 在3D图形中使用复合变换
我们也可以在3D图形中使用复合变换:
import matplotlib.pyplot as plt
from mpl_toolkits.mplot3d import Axes3D
from matplotlib.patches import Rectangle
import mpl_toolkits.mplot3d.art3d as art3d
from matplotlib.transforms import Affine2D

fig = plt.figure()
ax = fig.add_subplot(111, projection='3d')

rect = Rectangle((0, 0), 1, 1, fill=False)
transform = Affine2D().rotate_deg(45).scale(0.7).translate(0.5, 0.5)
rect.set_transform(transform)

art3d.pathpatch_2d_to_3d(rect, z=0.5, zdir="x")
ax.add_patch(rect)

ax.set_xlim(0, 1)
ax.set_ylim(0, 1)
ax.set_zlim(0, 1)
ax.text(0.5, 0.5, 0.5, 'how2matplotlib.com', ha='center', va='center')
plt.show()
这个例子在3D空间中创建了一个经过旋转、缩放和平移的矩形。
18. 使用set_transform()创建镜像效果
我们可以使用set_transform()方法创建镜像效果:
import matplotlib.pyplot as plt
from matplotlib.patches import Rectangle
from matplotlib.transforms import Affine2D

fig, ax = plt.subplots()

rect1 = Rectangle((0.2, 0.2), 0.3, 0.3, fill=False)
ax.add_patch(rect1)

rect2 = Rectangle((0.2, 0.2), 0.3, 0.3, fill=False)
transform = Affine2D().scale(-1, 1).translate(1, 0)
rect2.set_transform(transform + ax.transData)
ax.add_patch(rect2)

ax.text(0.5, 0.5, 'how2matplotlib.com', ha='center', va='center')
ax.set_xlim(0, 1)
ax.set_ylim(0, 1)
plt.show()
Output:
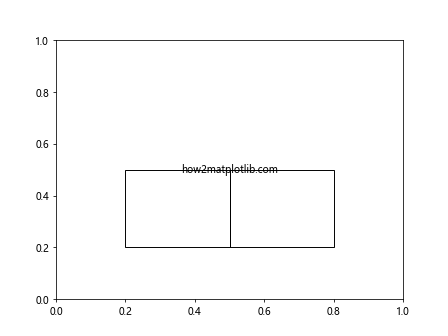
这个例子创建了一个矩形及其镜像。
19. 使用set_transform()创建透视效果
我们可以使用set_transform()方法创建简单的透视效果:
import matplotlib.pyplot as plt
from matplotlib.patches import Rectangle
from matplotlib.transforms import Affine2D

fig, ax = plt.subplots()

for i in range(5):
    rect = Rectangle((0.1, 0.1), 0.8, 0.8, fill=False)
    scale = 1 - i * 0.1
    transform = Affine2D().scale(scale).translate(i*0.05, i*0.05)
    rect.set_transform(transform + ax.transData)
    ax.add_patch(rect)

ax.text(0.5, 0.5, 'how2matplotlib.com', ha='center', va='center')
ax.set_xlim(0, 1)
ax.set_ylim(0, 1)
plt.show()
Output:
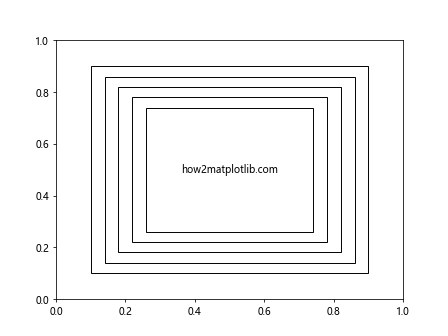
这个例子创建了一系列逐渐缩小和平移的矩形,产生简单的透视效果。
20. 在子图中使用不同的变换
我们可以在不同的子图中使用不同的变换:
import matplotlib.pyplot as plt
from matplotlib.patches import Rectangle
from matplotlib.transforms import Affine2D

fig, (ax1, ax2, ax3) = plt.subplots(1, 3, figsize=(15, 5))

rect1 = Rectangle((0.1, 0.1), 0.5, 0.5, fill=False)
ax1.add_patch(rect1)
ax1.text(0.5, 0.5, 'how2matplotlib.com\nOriginal', ha='center', va='center')

rect2 = Rectangle((0.1, 0.1), 0.5, 0.5, fill=False)
transform2 = Affine2D().rotate_deg(45)
rect2.set_transform(transform2 + ax2.transData)
ax2.add_patch(rect2)
ax2.text(0.5, 0.5, 'how2matplotlib.com\nRotated', ha='center', va='center')

rect3 = Rectangle((0.1, 0.1), 0.5, 0.5, fill=False)
transform3 = Affine2D().scale(1.5, 0.7)
rect3.set_transform(transform3 + ax3.transData)
ax3.add_patch(rect3)
ax3.text(0.5, 0.5, 'how2matplotlib.com\nScaled', ha='center', va='center')

for ax in (ax1, ax2, ax3):
    ax.set_xlim(0, 1)
    ax.set_ylim(0, 1)

plt.show()
Output:
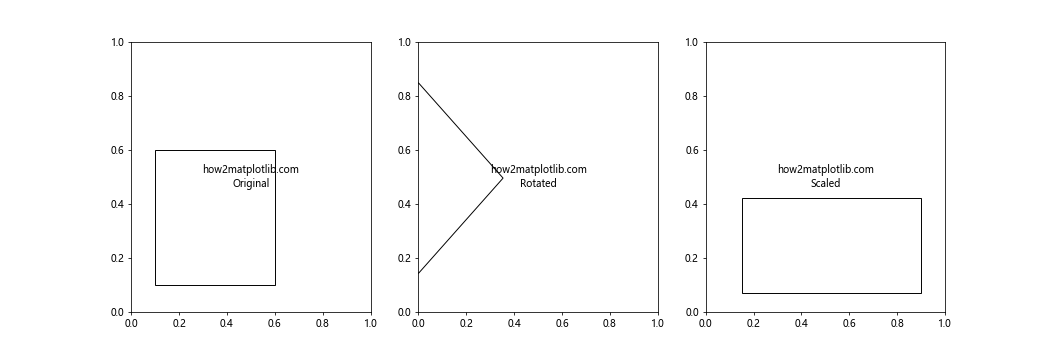
这个例子创建了三个子图,分别展示了原始矩形、旋转后的矩形和缩放后的矩形。
总结:
通过本文,我们深入探讨了Matplotlib中Artist.set_transform()方法的使用。我们学习了如何使用各种Transform对象,如何在不同的坐标系统中应用变换,如何创建复合变换,以及如何在各种图形元素(包括矩形、文本、图像等)上应用变换。我们还探讨了在3D图形、极坐标系、动画和自定义Artist中使用set_transform()方法的方法。
set_transform()方法为Matplotlib用户提供了强大的工具,使他们能够精确控制图形元素的位置、大小和形状。通过灵活运用这个方法,我们可以创建出更加复杂和动态的可视化效果,从而更好地展示和分析数据。
无论是创建简单的图表还是复杂的数据可视化,掌握set_transform()方法都将大大提升您的Matplotlib使用技能。希望本文能够帮助您更好地理解和应用这个强大的工具。
 极客教程
极客教程