Matplotlib中Artist对象的可见性控制:深入理解get_visible()方法
参考:Matplotlib.artist.Artist.get_visible() in Python
Matplotlib是Python中最流行的数据可视化库之一,它提供了丰富的绘图功能和灵活的自定义选项。在Matplotlib的架构中,Artist对象扮演着至关重要的角色,它们是构成图形的基本元素。本文将深入探讨Matplotlib中Artist对象的可见性控制,特别是get_visible()方法的使用和应用。
1. Artist对象简介
在Matplotlib中,几乎所有可以在图形中看到的元素都是Artist对象。这包括线条、文本、刻度标记、图例等。Artist对象是Matplotlib绘图系统的核心,理解它们的属性和方法对于创建高质量的可视化图表至关重要。
Artist对象可以分为两类:
1. 基本Artist:如Line2D、Rectangle、Text等,用于绘制基本图形元素。
2. 容器Artist:如Axis、Axes、Figure等,用于组织和管理其他Artist对象。
2. get_visible()方法概述
get_visible()是Artist类的一个方法,用于获取Artist对象的可见性状态。这个方法返回一个布尔值,表示当前Artist对象是否可见。
基本用法示例:
import matplotlib.pyplot as plt

fig, ax = plt.subplots()
line, = ax.plot([1, 2, 3, 4], [1, 4, 2, 3], label='how2matplotlib.com')
visibility = line.get_visible()
print(f"Line visibility: {visibility}")

plt.title("Visibility Example - how2matplotlib.com")
plt.show()
Output:
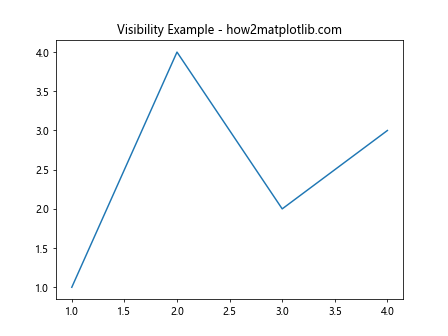
在这个例子中,我们创建了一个简单的线图,然后使用get_visible()方法检查线条的可见性状态。默认情况下,新创建的Artist对象是可见的,所以这里会返回True。
3. 可见性控制的重要性
控制Artist对象的可见性对于创建交互式和动态图表非常重要。通过改变对象的可见性,我们可以实现以下功能:
- 动态显示或隐藏图表元素
- 创建图例开关
- 实现图层控制
- 优化复杂图表的性能
4. 与set_visible()方法的配合使用
get_visible()方法通常与set_visible()方法配合使用。set_visible()方法允许我们改变Artist对象的可见性状态。
示例代码:
import matplotlib.pyplot as plt

fig, ax = plt.subplots()
line, = ax.plot([1, 2, 3, 4], [1, 4, 2, 3], label='how2matplotlib.com')

# 检查初始可见性
print(f"Initial visibility: {line.get_visible()}")

# 隐藏线条
line.set_visible(False)
print(f"After hiding: {line.get_visible()}")

# 重新显示线条
line.set_visible(True)
print(f"After showing: {line.get_visible()}")

plt.title("Visibility Control - how2matplotlib.com")
plt.show()
Output:
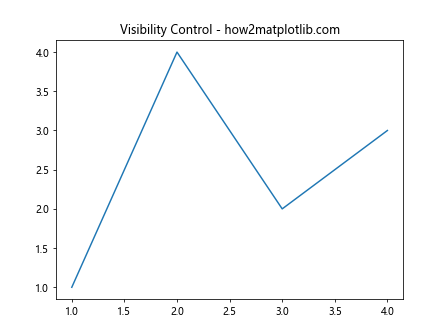
这个例子展示了如何使用get_visible()和set_visible()方法来检查和改变线条的可见性状态。
5. 在不同类型的Artist对象上使用get_visible()
get_visible()方法可以应用于各种类型的Artist对象。让我们看一些不同类型的例子:
5.1 文本对象
import matplotlib.pyplot as plt

fig, ax = plt.subplots()
text = ax.text(0.5, 0.5, 'how2matplotlib.com', ha='center', va='center')

print(f"Text visibility: {text.get_visible()}")

ax.set_title("Text Visibility - how2matplotlib.com")
plt.show()
Output:
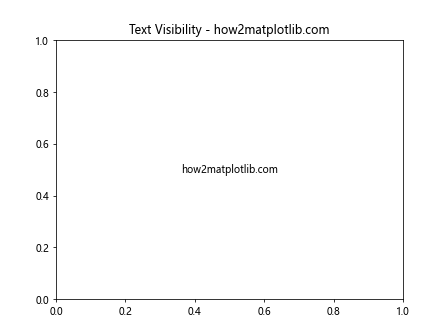
这个例子展示了如何检查文本对象的可见性。
5.2 刻度标签
import matplotlib.pyplot as plt

fig, ax = plt.subplots()
ax.plot([1, 2, 3, 4], [1, 4, 2, 3])

x_labels = ax.get_xticklabels()
y_labels = ax.get_yticklabels()

print(f"X-axis label visibility: {x_labels[0].get_visible()}")
print(f"Y-axis label visibility: {y_labels[0].get_visible()}")

plt.title("Tick Label Visibility - how2matplotlib.com")
plt.show()
Output:
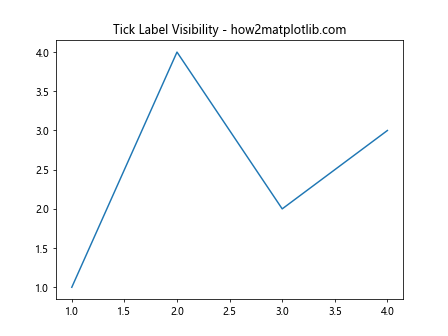
这个例子展示了如何检查x轴和y轴刻度标签的可见性。
5.3 图例
import matplotlib.pyplot as plt

fig, ax = plt.subplots()
line, = ax.plot([1, 2, 3, 4], [1, 4, 2, 3], label='how2matplotlib.com')
legend = ax.legend()

print(f"Legend visibility: {legend.get_visible()}")

plt.title("Legend Visibility - how2matplotlib.com")
plt.show()
Output:
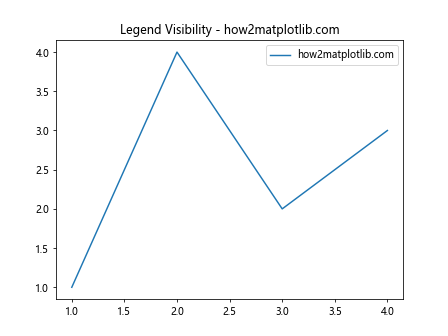
这个例子展示了如何检查图例的可见性。
6. 在交互式图表中使用get_visible()
get_visible()方法在创建交互式图表时特别有用。例如,我们可以使用它来创建一个切换图表元素可见性的按钮。
import matplotlib.pyplot as plt
from matplotlib.widgets import Button

fig, ax = plt.subplots()
line, = ax.plot([1, 2, 3, 4], [1, 4, 2, 3], label='how2matplotlib.com')

def toggle_visibility(event):
    line.set_visible(not line.get_visible())
    fig.canvas.draw()

ax_button = plt.axes([0.81, 0.05, 0.1, 0.075])
button = Button(ax_button, 'Toggle')
button.on_clicked(toggle_visibility)

plt.title("Interactive Visibility - how2matplotlib.com")
plt.show()
Output:
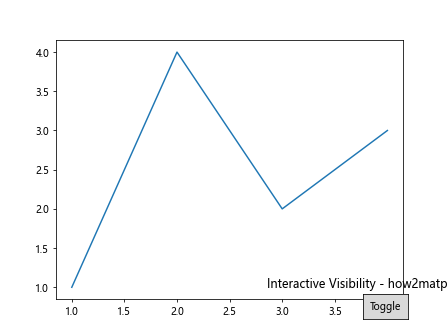
这个例子创建了一个按钮,点击它可以切换线条的可见性。get_visible()方法用于检查当前的可见性状态,然后决定是显示还是隐藏线条。
7. 在动画中使用get_visible()
get_visible()方法也可以在创建动画时使用,例如创建闪烁效果:
import matplotlib.pyplot as plt
import matplotlib.animation as animation

fig, ax = plt.subplots()
line, = ax.plot([1, 2, 3, 4], [1, 4, 2, 3], label='how2matplotlib.com')

def update(frame):
    line.set_visible(not line.get_visible())
    return line,

ani = animation.FuncAnimation(fig, update, frames=10, interval=500, blit=True)

plt.title("Blinking Animation - how2matplotlib.com")
plt.show()
Output:
这个动画每500毫秒切换一次线条的可见性,创造出闪烁效果。
8. 在子图中使用get_visible()
当处理多个子图时,get_visible()方法可以用来检查每个子图中元素的可见性:
import matplotlib.pyplot as plt

fig, (ax1, ax2) = plt.subplots(1, 2, figsize=(10, 4))

line1, = ax1.plot([1, 2, 3, 4], [1, 4, 2, 3], label='how2matplotlib.com')
line2, = ax2.plot([1, 2, 3, 4], [3, 2, 4, 1], label='how2matplotlib.com')

print(f"Subplot 1 line visibility: {line1.get_visible()}")
print(f"Subplot 2 line visibility: {line2.get_visible()}")

ax1.set_title("Subplot 1 - how2matplotlib.com")
ax2.set_title("Subplot 2 - how2matplotlib.com")
plt.tight_layout()
plt.show()
Output:
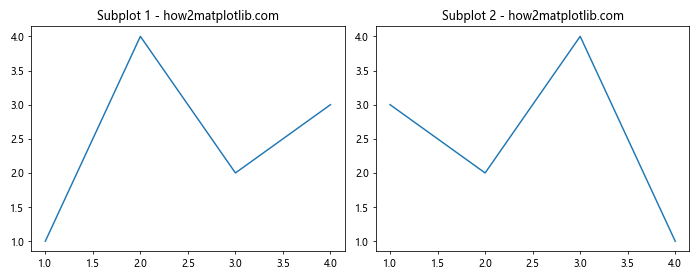
这个例子创建了两个子图,并检查每个子图中线条的可见性。
9. 在自定义Artist对象中使用get_visible()
我们也可以在自定义的Artist对象中使用get_visible()方法:
import matplotlib.pyplot as plt
import matplotlib.patches as patches

class CustomRectangle(patches.Rectangle):
    def __init__(self, *args, **kwargs):
        super().__init__(*args, **kwargs)
        self.set_label('how2matplotlib.com')

fig, ax = plt.subplots()
custom_rect = CustomRectangle((0.2, 0.2), 0.6, 0.6, fill=False)
ax.add_patch(custom_rect)

print(f"Custom rectangle visibility: {custom_rect.get_visible()}")

plt.title("Custom Artist - how2matplotlib.com")
plt.show()
Output:
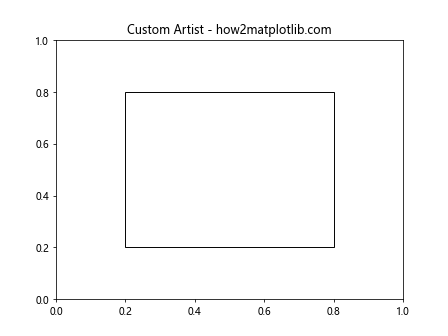
这个例子创建了一个自定义的Rectangle对象,并使用get_visible()方法检查其可见性。
10. 在图形保存过程中使用get_visible()
当保存图形时,get_visible()方法可以用来决定哪些元素应该被包含在保存的图像中:
import matplotlib.pyplot as plt

fig, ax = plt.subplots()
line1, = ax.plot([1, 2, 3, 4], [1, 4, 2, 3], label='Line 1 - how2matplotlib.com')
line2, = ax.plot([1, 2, 3, 4], [3, 2, 4, 1], label='Line 2 - how2matplotlib.com')

line2.set_visible(False)

visible_artists = [artist for artist in ax.get_children() if artist.get_visible()]
fig.savefig('visible_only.png', additional_artists=visible_artists)

plt.title("Saving Visible Elements - how2matplotlib.com")
plt.show()
这个例子中,我们只保存可见的Artist对象到图像文件中。
11. 在图例控制中使用get_visible()
get_visible()方法可以用于创建交互式图例控制:
import matplotlib.pyplot as plt

fig, ax = plt.subplots()
line1, = ax.plot([1, 2, 3, 4], [1, 4, 2, 3], label='Line 1 - how2matplotlib.com')
line2, = ax.plot([1, 2, 3, 4], [3, 2, 4, 1], label='Line 2 - how2matplotlib.com')

leg = ax.legend()

def on_pick(event):
    legline = event.artist
    origline = lined[legline]
    visible = not origline.get_visible()
    origline.set_visible(visible)
    legline.set_alpha(1.0 if visible else 0.2)
    fig.canvas.draw()

lined = {}
for legline, origline in zip(leg.get_lines(), ax.get_lines()):
    legline.set_picker(True)
    lined[legline] = origline

fig.canvas.mpl_connect('pick_event', on_pick)

plt.title("Interactive Legend - how2matplotlib.com")
plt.show()
Output:
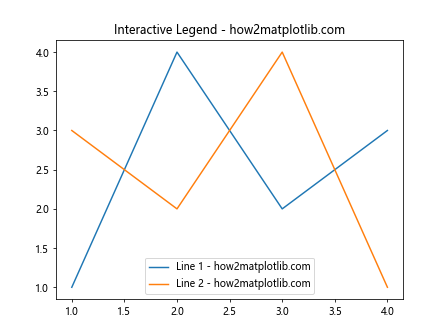
这个例子创建了一个交互式图例,点击图例项可以切换相应线条的可见性。
12. 在3D图形中使用get_visible()
get_visible()方法同样适用于3D图形:
import matplotlib.pyplot as plt
from mpl_toolkits.mplot3d import Axes3D
import numpy as np

fig = plt.figure()
ax = fig.add_subplot(111, projection='3d')

x = np.linspace(-5, 5, 100)
y = np.linspace(-5, 5, 100)
X, Y = np.meshgrid(x, y)
Z = np.sin(np.sqrt(X**2 + Y**2))

surface = ax.plot_surface(X, Y, Z, label='how2matplotlib.com')

print(f"3D surface visibility: {surface.get_visible()}")

ax.set_title("3D Surface Visibility - how2matplotlib.com")
plt.show()
Output:
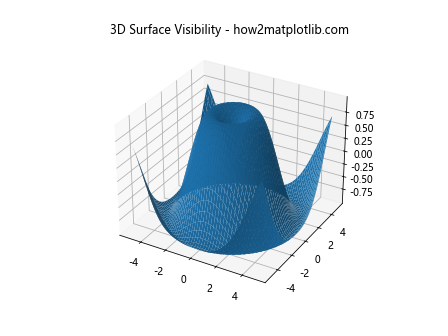
这个例子展示了如何在3D图形中使用get_visible()方法。
13. 在动态更新图表中使用get_visible()
在实时更新的图表中,get_visible()方法可以用来控制哪些元素需要更新:
import matplotlib.pyplot as plt
import numpy as np

fig, ax = plt.subplots()
line1, = ax.plot([], [], label='Line 1 - how2matplotlib.com')
line2, = ax.plot([], [], label='Line 2 - how2matplotlib.com')

ax.set_xlim(0, 100)
ax.set_ylim(-1, 1)

def update(frame):
    if line1.get_visible():
        line1.set_data(range(frame), np.sin(np.linspace(0, 4*np.pi, frame)))
    if line2.get_visible():
        line2.set_data(range(frame), np.cos(np.linspace(0, 4*np.pi, frame)))
    return line1, line2

plt.title("Dynamic Update - how2matplotlib.com")
plt.legend()
plt.show()
Output:
这个例子创建了一个动态更新的图表,只有可见的线条会被更新。
14. 在极坐标图中使用get_visible()
get_visible()方法也可以应用于极坐标图:
import matplotlib.pyplot as plt
import numpy as np

fig, ax = plt.subplots(subplot_kw=dict(projection='polar'))
theta = np.linspace(0, 2*np.pi, 100)
r = np.abs(np.sin(2*theta))

line, = ax.plot(theta, r, label='how2matplotlib.com')
print(f"Polar plot line visibility: {line.get_visible()}")

ax.set_title("Polar Plot Visibility - how2matplotlib.com")
plt.show()
Output:
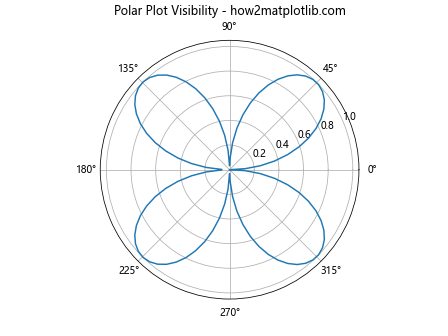
这个例子展示了如何在极坐标图中使用get_visible()方法。
15. 在误差线图中使用get_visible()
get_visible()方法可以用于控制误差线的可见性:
“`python“`python
import matplotlib.pyplot as plt
import numpy as np
fig, ax = plt.subplots()
x = np.linspace(0, 10, 50)
y = np.sin(x)
yerr = 0.1 + 0.2 * np.random.rand(len(x))
errorbar = ax.errorbar(x, y, yerr, label=’how2matplotlib.com’)
print(f”Error bar visibility: {errorbar[0].get_visible()}”)
ax.set_title(“Error Bar Visibility – how2matplotlib.com”)
plt.show()
Output:
方法")
这个例子展示了如何在误差线图中使用`get_visible()`方法。
## 16. 在热图中使用get_visible()
`get_visible()`方法同样适用于热图:
```python
import matplotlib.pyplot as plt
import numpy as np
fig, ax = plt.subplots()
data = np.random.rand(10, 10)
heatmap = ax.imshow(data, cmap='viridis')
print(f"Heatmap visibility: {heatmap.get_visible()}")
ax.set_title("Heatmap Visibility - how2matplotlib.com")
plt.colorbar(heatmap)
plt.show()
Output:
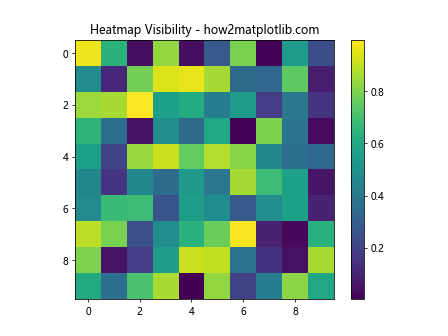
这个例子展示了如何在热图中使用get_visible()方法。
17. 在箱线图中使用get_visible()
get_visible()方法可以用于控制箱线图的各个组件:
import matplotlib.pyplot as plt
import numpy as np

fig, ax = plt.subplots()
data = [np.random.normal(0, std, 100) for std in range(1, 4)]
box_plot = ax.boxplot(data, labels=['A', 'B', 'C'])

for element in ['boxes', 'whiskers', 'fliers', 'means', 'medians', 'caps']:
    if element in box_plot:
        print(f"{element} visibility: {box_plot[element][0].get_visible()}")

ax.set_title("Box Plot Visibility - how2matplotlib.com")
plt.show()
这个例子展示了如何在箱线图中使用get_visible()方法检查各个组件的可见性。
18. 在条形图中使用get_visible()
get_visible()方法可以用于控制条形图的可见性:
import matplotlib.pyplot as plt
import numpy as np

fig, ax = plt.subplots()
x = np.arange(5)
y = np.random.rand(5)

bars = ax.bar(x, y, label='how2matplotlib.com')
for bar in bars:
    print(f"Bar visibility: {bar.get_visible()}")

ax.set_title("Bar Plot Visibility - how2matplotlib.com")
plt.show()
Output:
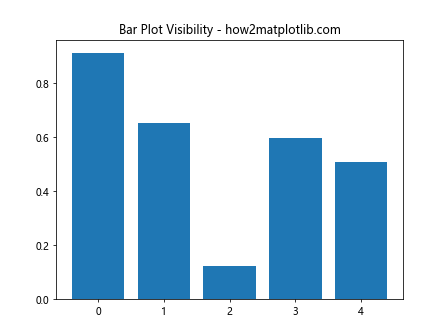
这个例子展示了如何在条形图中使用get_visible()方法。
19. 在饼图中使用get_visible()
get_visible()方法也可以应用于饼图的各个扇区:
import matplotlib.pyplot as plt

fig, ax = plt.subplots()
sizes = [15, 30, 45, 10]
labels = ['A', 'B', 'C', 'D']

wedges, texts = ax.pie(sizes, labels=labels)

for wedge in wedges:
    print(f"Wedge visibility: {wedge.get_visible()}")

ax.set_title("Pie Chart Visibility - how2matplotlib.com")
plt.show()
Output:
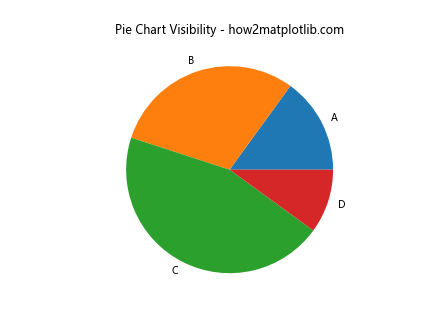
这个例子展示了如何在饼图中使用get_visible()方法检查各个扇区的可见性。
20. 在等高线图中使用get_visible()
最后,让我们看看如何在等高线图中使用get_visible()方法:
import matplotlib.pyplot as plt
import numpy as np

fig, ax = plt.subplots()
x = np.linspace(-3, 3, 100)
y = np.linspace(-3, 3, 100)
X, Y = np.meshgrid(x, y)
Z = np.sin(X) * np.cos(Y)

contours = ax.contour(X, Y, Z)
for collection in contours.collections:
    print(f"Contour collection visibility: {collection.get_visible()}")

ax.set_title("Contour Plot Visibility - how2matplotlib.com")
plt.colorbar(contours)
plt.show()
Output:
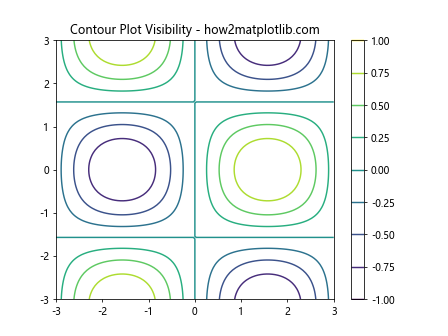
这个例子展示了如何在等高线图中使用get_visible()方法检查等高线集合的可见性。
总结
通过以上详细的探讨和丰富的示例,我们深入了解了Matplotlib中Artist.get_visible()方法的使用和应用。这个方法在创建交互式图表、动态可视化和复杂图形时特别有用。它允许我们检查和控制图形中各个元素的可见性,从而实现更灵活和动态的数据可视化效果。
get_visible()方法可以应用于各种类型的Artist对象,包括线条、文本、图例、刻度标签等。它通常与set_visible()方法配合使用,以实现对图形元素可见性的动态控制。
在实际应用中,get_visible()方法可以用于:
1. 创建交互式图例
2. 实现图层控制
3. 优化复杂图表的性能
4. 创建动画效果
5. 在保存图形时选择性地包含某些元素
通过掌握get_visible()方法的使用,我们可以创建更加灵活、交互性更强的数据可视化图表,从而更好地展示和分析数据。无论是在科学研究、数据分析还是商业报告中,这个方法都能帮助我们创建出更加专业和吸引人的图表。
 极客教程
极客教程