Matplotlib中Artist对象的草图参数设置:深入理解get_sketch_params()方法
参考:Matplotlib.artist.Artist.get_sketch_params() in Python
Matplotlib是Python中最流行的数据可视化库之一,它提供了丰富的绘图功能和灵活的自定义选项。在Matplotlib的架构中,Artist对象扮演着重要的角色,它是所有可视化元素的基类。本文将深入探讨Artist对象中的get_sketch_params()方法,这个方法允许我们获取和操作图形元素的草图参数,从而实现独特的视觉效果。
1. Artist对象简介
在Matplotlib中,Artist是一个抽象基类,它是所有可绘制对象的父类。这些对象包括图形、轴、线条、文本等。Artist对象负责管理图形元素的属性,如颜色、线型、透明度等。get_sketch_params()方法就是Artist类中的一个重要方法,用于获取草图参数。
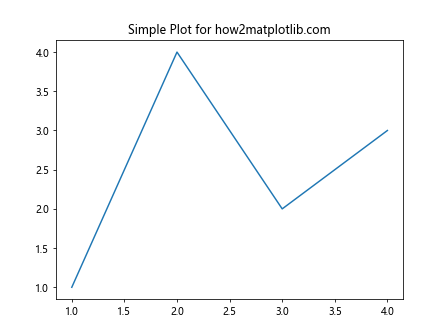
让我们从一个简单的例子开始,创建一个基本的图形并查看其Artist对象:
import matplotlib.pyplot as plt

fig, ax = plt.subplots()
line, = ax.plot([1, 2, 3, 4], [1, 4, 2, 3], label='how2matplotlib.com')
print(isinstance(line, plt.Artist))

plt.title('Simple Plot for how2matplotlib.com')
plt.show()
Output:

在这个例子中,我们创建了一个简单的线图。line对象是一个Line2D实例,它继承自Artist类。我们可以使用isinstance()函数来验证这一点。
2. get_sketch_params()方法概述
get_sketch_params()方法是Artist类的一个方法,用于获取当前Artist对象的草图参数。草图参数用于创建一种手绘或草图效果,这可以为图形添加一种独特的视觉风格。
这个方法返回一个包含三个元素的元组:
- scale:控制草图效果的整体强度
- length:控制草图线条的长度
- randomness:控制草图效果的随机程度
让我们看一个使用get_sketch_params()的简单例子:
import matplotlib.pyplot as plt

fig, ax = plt.subplots()
line, = ax.plot([1, 2, 3, 4], [1, 4, 2, 3], label='how2matplotlib.com', sketch_params=(100, 1.0, 2))

sketch_params = line.get_sketch_params()
print(f"Sketch parameters: {sketch_params}")

plt.title('Sketch Effect Demo for how2matplotlib.com')
plt.show()
在这个例子中,我们首先创建了一个带有草图效果的线条,然后使用get_sketch_params()方法获取其草图参数。这些参数将被打印出来,让我们了解当前的草图设置。
3. 草图参数的含义和影响
让我们详细探讨草图参数的含义和它们对图形外观的影响:
3.1 scale参数
scale参数控制草图效果的整体强度。较大的值会产生更明显的草图效果,而较小的值则会使效果更加微妙。
import matplotlib.pyplot as plt

fig, (ax1, ax2) = plt.subplots(1, 2, figsize=(10, 4))

# Low scale
ax1.plot([1, 2, 3, 4], [1, 4, 2, 3], sketch_params=(10, 1, 1), label='how2matplotlib.com')
ax1.set_title('Low Scale (10)')

# High scale
ax2.plot([1, 2, 3, 4], [1, 4, 2, 3], sketch_params=(100, 1, 1), label='how2matplotlib.com')
ax2.set_title('High Scale (100)')

plt.suptitle('Scale Effect Comparison for how2matplotlib.com')
plt.tight_layout()
plt.show()
在这个例子中,我们创建了两个子图,分别使用低scale值和高scale值。你可以观察到,高scale值的图形会有更明显的手绘效果。
3.2 length参数
length参数控制草图线条的长度。较大的值会产生更长的草图线条,而较小的值则会产生更短的线条。
import matplotlib.pyplot as plt

fig, (ax1, ax2) = plt.subplots(1, 2, figsize=(10, 4))

# Short length
ax1.plot([1, 2, 3, 4], [1, 4, 2, 3], sketch_params=(100, 0.5, 1), label='how2matplotlib.com')
ax1.set_title('Short Length (0.5)')

# Long length
ax2.plot([1, 2, 3, 4], [1, 4, 2, 3], sketch_params=(100, 2.0, 1), label='how2matplotlib.com')
ax2.set_title('Long Length (2.0)')

plt.suptitle('Length Effect Comparison for how2matplotlib.com')
plt.tight_layout()
plt.show()
在这个例子中,我们比较了短length和长length的效果。你可以看到,较长的length值会使草图线条更加延伸。
3.3 randomness参数
randomness参数控制草图效果的随机程度。较高的值会产生更不规则的线条,而较低的值则会产生更均匀的线条。
import matplotlib.pyplot as plt

fig, (ax1, ax2) = plt.subplots(1, 2, figsize=(10, 4))

# Low randomness
ax1.plot([1, 2, 3, 4], [1, 4, 2, 3], sketch_params=(100, 1, 0.5), label='how2matplotlib.com')
ax1.set_title('Low Randomness (0.5)')

# High randomness
ax2.plot([1, 2, 3, 4], [1, 4, 2, 3], sketch_params=(100, 1, 2.0), label='how2matplotlib.com')
ax2.set_title('High Randomness (2.0)')

plt.suptitle('Randomness Effect Comparison for how2matplotlib.com')
plt.tight_layout()
plt.show()
这个例子展示了低randomness和高randomness的对比。高randomness值会使线条看起来更加不规则和手绘风格。
4. 在不同类型的图表中使用get_sketch_params()
get_sketch_params()方法可以应用于多种类型的图表。让我们探索一些常见的图表类型,并了解如何在它们中使用和获取草图参数。
4.1 折线图
折线图是最常见的图表类型之一。我们可以为折线添加草图效果,然后使用get_sketch_params()获取参数:
import matplotlib.pyplot as plt

fig, ax = plt.subplots()

line, = ax.plot([1, 2, 3, 4, 5], [2, 4, 1, 3, 5], sketch_params=(80, 1.5, 1.5), label='how2matplotlib.com')
ax.set_title('Line Plot with Sketch Effect for how2matplotlib.com')

params = line.get_sketch_params()
print(f"Sketch parameters: scale={params[0]}, length={params[1]}, randomness={params[2]}")

plt.legend()
plt.show()
在这个例子中,我们创建了一个带有草图效果的折线图,然后使用get_sketch_params()获取并打印出草图参数。
4.2 散点图
散点图也可以应用草图效果,尽管效果可能不如线条那么明显:
import matplotlib.pyplot as plt
import numpy as np

fig, ax = plt.subplots()

x = np.random.rand(50)
y = np.random.rand(50)

scatter = ax.scatter(x, y, s=100, sketch_params=(100, 1, 2), label='how2matplotlib.com')
ax.set_title('Scatter Plot with Sketch Effect for how2matplotlib.com')

params = scatter.get_sketch_params()
print(f"Sketch parameters: scale={params[0]}, length={params[1]}, randomness={params[2]}")

plt.legend()
plt.show()
这个例子创建了一个带有草图效果的散点图。虽然散点图的草图效果可能不太明显,但我们仍然可以使用get_sketch_params()获取设置的参数。
4.3 柱状图
柱状图也可以应用草图效果,这可以给图表一种独特的手绘风格:
import matplotlib.pyplot as plt

fig, ax = plt.subplots()

categories = ['A', 'B', 'C', 'D']
values = [3, 7, 2, 5]

bars = ax.bar(categories, values, sketch_params=(60, 1, 1.5), label='how2matplotlib.com')
ax.set_title('Bar Plot with Sketch Effect for how2matplotlib.com')

params = bars[0].get_sketch_params()
print(f"Sketch parameters: scale={params[0]}, length={params[1]}, randomness={params[2]}")

plt.legend()
plt.show()
在这个例子中,我们为柱状图添加了草图效果,并使用get_sketch_params()获取第一个柱子的草图参数。
5. 动态调整草图参数
get_sketch_params()方法不仅可以用于获取当前的草图参数,还可以与set_sketch_params()方法配合使用,实现草图参数的动态调整。这在创建交互式图表或动画时特别有用。
让我们看一个例子,展示如何动态调整草图参数:
import matplotlib.pyplot as plt
from matplotlib.widgets import Slider

fig, ax = plt.subplots()
plt.subplots_adjust(bottom=0.25)

t = range(0, 100)
line, = ax.plot(t, t, sketch_params=(50, 1, 1), label='how2matplotlib.com')
ax.set_title('Dynamic Sketch Params Adjustment for how2matplotlib.com')

ax_scale = plt.axes([0.1, 0.1, 0.8, 0.03])
scale_slider = Slider(ax_scale, 'Scale', 0, 100, valinit=50)

def update(val):
    current_params = line.get_sketch_params()
    new_params = (val, current_params[1], current_params[2])
    line.set_sketch_params(*new_params)
    fig.canvas.draw_idle()

scale_slider.on_changed(update)

plt.show()
在这个例子中,我们创建了一个带有滑块的交互式图表。滑块控制草图效果的scale参数。当滑块移动时,我们首先使用get_sketch_params()获取当前的参数,然后创建一个新的参数元组,最后使用set_sketch_params()更新草图效果。
6. 在复杂图表中使用get_sketch_params()
当我们处理更复杂的图表时,get_sketch_params()方法可以帮助我们管理多个元素的草图效果。让我们看一个包含多个元素的复杂图表例子:
import matplotlib.pyplot as plt
import numpy as np

fig, ax = plt.subplots(figsize=(10, 6))

# Line plot
x = np.linspace(0, 10, 100)
line, = ax.plot(x, np.sin(x), label='Sine', sketch_params=(80, 1, 1.5))

# Scatter plot
scatter = ax.scatter(x[::10], np.cos(x[::10]), c='r', label='Cosine', sketch_params=(60, 0.5, 2))

# Bar plot
bar_x = [1, 3, 5, 7, 9]
bar_heights = [0.5, 0.3, 0.7, 0.4, 0.6]
bars = ax.bar(bar_x, bar_heights, width=0.5, alpha=0.5, label='Bars', sketch_params=(100, 1.5, 1))

ax.set_title('Complex Plot with Various Sketch Effects for how2matplotlib.com')
ax.legend()

# Get and print sketch params for each element
print("Line sketch params:", line.get_sketch_params())
print("Scatter sketch params:", scatter.get_sketch_params())
print("Bar sketch params:", bars[0].get_sketch_params())

plt.show()
在这个复杂的例子中,我们在同一个图表中包含了线图、散点图和柱状图,每个元素都有不同的草图效果。我们使用get_sketch_params()方法获取并打印每个元素的草图参数,这样我们可以清楚地了解每个元素的草图设置。
7. 草图效果在不同样式中的应用
Matplotlib提供了多种预定义的样式,我们可以在这些样式中应用草图效果,并使用get_sketch_params()来查看和管理参数。让我们探索一些常见的样式:
7.1 在’ggplot’样式中使用草图效果
import matplotlib.pyplot as plt
plt.style.use('ggplot')

fig, ax = plt.subplots()

line, = ax.plot([1, 2, 3, 4], [1, 4, 2, 3], sketch_params=(70, 1.2, 1.8), label='how2matplotlib.com')
ax.set_title('Sketch Effect in ggplot Style for how2matplotlib.com')

params = line.get_sketch_params()
print(f"Sketch parameters: scale={params[0]}, length={params[1]}, randomness={params[2]}")

plt.legend()
plt.show()
在这个例子中,我们在’ggplot’样式下应用了草图效果,并使用get_sketch_params()获取参数。
7.2 在’seaborn’样式中使用草图效果
import matplotlib.pyplot as plt
plt.style.use('seaborn')

fig, ax = plt.subplots()

line, = ax.plot([1, 2, 3, 4], [1, 4, 2, 3], sketch_params=(90, 0.8, 1.5), label='how2matplotlib.com')
ax.set_title('Sketch Effect in Seaborn Style for how2matplotlib.com')

params = line.get_sketch_params()
print(f"Sketch parameters: scale={params[0]}, length={params[1]}, randomness={params[2]}")

plt.legend()
plt.show()
这个例子展示了在’seaborn’样式下应用草图效果,并使用get_sketch_params()获取参数。
8. 在子图中使用get_sketch_params()
当我们使用子图时,可以为每个子图设置不同的草图效果,并使用get_sketch_params()来管理这些效果:
import matplotlib.pyplot as plt

fig, (ax1, ax2) = plt.subplots(1, 2, figsize=(12, 5))

line1, = ax1.plot([1, 2, 3, 4], [1, 4, 2, 3], sketch_params=(60, 1, 1.5), label='how2matplotlib.com')
ax1.set_title('Subplot 1')

line2, = ax2.plot([1, 2, 3, 4], [3, 1, 4, 2], sketch_params=(100, 0.8, 2), label='how2matplotlib.com')
ax2.set_title('Subplot 2')

params1 = line1.get_sketch_params()
params2 = line2.get_sketch_params()

print("Subplot 1 sketch params:", params1)
print("Subplot 2 sketch params:", params2)

plt.suptitle('Sketch Effects in Subplots for how2matplotlib.com')
plt.tight_layout()
plt.show()
在这个例子中,我们创建了两个子图,每个子图都有不同的草图效果。我们使用get_sketch_params()获取并打印每个子图的草图参数。
9. 在3D图表中使用get_sketch_params()
虽然草图效果主要用于2D图表,但我们也可以在3D图表中应用它,并使用get_sketch_params()来管理参数:
import matplotlib.pyplot as plt
from mpl_toolkits.mplot3d import Axes3D
import numpy as np

fig = plt.figure()
ax = fig.add_subplot(111, projection='3d')

theta = np.linspace(-4 * np.pi, 4 * np.pi, 100)
z = np.linspace(-2, 2, 100)
r = z**2 + 1
x = r * np.sin(theta)
y = r * np.cos(theta)

line, = ax.plot(x, y, z, sketch_params=(80, 1.2, 1.8), label='how2matplotlib.com')
ax.set_title('3D Plot with Sketch Effect for how2matplotlib.com')

params = line.get_sketch_params()
print(f"3D plot sketch parameters: scale={params[0]}, length={params[1]}, randomness={params[2]}")

plt.legend()
plt.show()
这个例子展示了如何在3D图表中应用草图效果,并使用get_sketch_params()获取参数。
10. 在动画中使用get_sketch_params()
get_sketch_params()方法在创建动画时也非常有用,可以帮助我们动态调整草图效果:
import matplotlib.pyplot as plt
import matplotlib.animation as animation
import numpy as np

fig, ax = plt.subplots()
x = np.linspace(0, 2*np.pi, 100)
line, = ax.plot(x, np.sin(x), sketch_params=(50, 1, 1), label='how2matplotlib.com')
ax.set_title('Animated Sketch Effect for how2matplotlib.com')

def animate(frame):
    line.set_ydata(np.sin(x + frame/10))
    current_params = line.get_sketch_params()
    new_scale = 50 + 50 * np.sin(frame/10)
    line.set_sketch_params(new_scale, current_params[1], current_params[2])
    return line,

ani = animation.FuncAnimation(fig, animate, frames=100, interval=50, blit=True)

plt.legend()
plt.show()
Output:

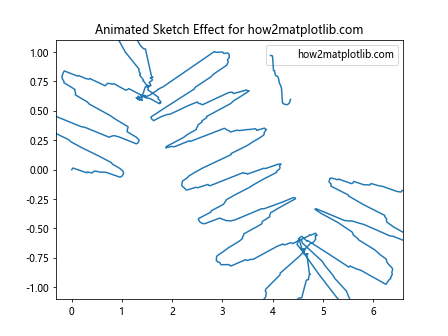
在这个动画例子中,我们使用get_sketch_params()获取当前的草图参数,然后动态调整scale参数来创建一个变化的草图效果。
11. 错误处理和边界情况
在使用get_sketch_params()方法时,我们也需要考虑可能的错误和边界情况:
import matplotlib.pyplot as plt

fig, ax = plt.subplots()

# 创建一个没有草图效果的线
line, = ax.plot([1, 2, 3, 4], [1, 4, 2, 3], label='how2matplotlib.com')

# 尝试获取草图参数
try:
    params = line.get_sketch_params()
    print(f"Sketch parameters: {params}")
except AttributeError:
    print("This line does not have sketch parameters set.")

# 设置草图参数并再次尝试
line.set_sketch_params(scale=100, length=1, randomness=2)
params = line.get_sketch_params()
print(f"After setting: Sketch parameters: {params}")

plt.title('Error Handling Demo for how2matplotlib.com')
plt.show()
Output:

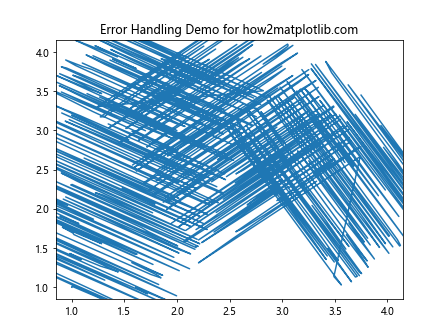
这个例子展示了如何处理没有设置草图参数的情况,以及如何在设置参数后使用get_sketch_params()。
12. 结合其他Artist属性
get_sketch_params()方法可以与其他Artist属性结合使用,以创建更复杂的视觉效果:
import matplotlib.pyplot as plt

fig, ax = plt.subplots()

line, = ax.plot([1, 2, 3, 4], [1, 4, 2, 3], sketch_params=(80, 1.2, 1.5),
                 linewidth=2, color='red', alpha=0.7, linestyle='--', label='how2matplotlib.com')

ax.set_title('Combined Artist Properties for how2matplotlib.com')

sketch_params = line.get_sketch_params()
print(f"Sketch parameters: {sketch_params}")
print(f"Line width: {line.get_linewidth()}")
print(f"Color: {line.get_color()}")
print(f"Alpha: {line.get_alpha()}")
print(f"Linestyle: {line.get_linestyle()}")

plt.legend()
plt.show()
这个例子展示了如何将草图效果与其他线条属性(如线宽、颜色、透明度和线型)结合使用,并使用各种get方法获取这些属性。
总结
通过本文,我们深入探讨了Matplotlib中Artist对象的get_sketch_params()方法。我们了解了这个方法的基本用法、参数含义,以及如何在各种图表类型和场景中应用它。我们还探讨了如何结合其他Artist属性,处理错误情况,以及在动画中使用get_sketch_params()。
get_sketch_params()方法为我们提供了一种灵活的方式来管理和调整图形元素的草图效果,使我们能够创建独特的视觉风格。无论是在简单的线图还是复杂的多元素图表中,这个方法都能帮助我们精确控制草图效果,从而增强数据可视化的表现力和艺术性。
在实际应用中,合理使用草图效果可以为你的数据可视化添加独特的风格,使图表更加生动有趣。然而,也要注意不要过度使用,以免影响数据的清晰度和可读性。通过平衡艺术效果和数据呈现,你可以创建既美观又有效的数据可视化作品。
 极客教程
极客教程