Matplotlib中Artist对象的get_picker()方法详解与应用
参考:Matplotlib.artist.Artist.get_picker() in Python
Matplotlib是Python中最流行的数据可视化库之一,它提供了丰富的绘图功能和灵活的自定义选项。在Matplotlib中,Artist是所有可视化元素的基类,包括线条、文本、图像等。本文将深入探讨Artist类中的get_picker()方法,这是一个用于获取可拾取性设置的重要函数。我们将详细介绍get_picker()方法的用法、参数、返回值以及在实际应用中的各种场景。
1. get_picker()方法简介
get_picker()方法是Matplotlib中Artist类的一个成员函数,用于获取当前Artist对象的可拾取性设置。可拾取性是指用户是否可以通过鼠标点击或其他交互方式选择(拾取)该Artist对象。这个方法不接受任何参数,返回当前的picker设置,可能是一个布尔值、浮点数或可调用对象。
以下是一个简单的示例,展示如何使用get_picker()方法:
import matplotlib.pyplot as plt

fig, ax = plt.subplots()
line, = ax.plot([1, 2, 3, 4], [1, 4, 2, 3], label='how2matplotlib.com')
picker_setting = line.get_picker()
print(f"Current picker setting: {picker_setting}")

plt.title("get_picker() Example")
plt.show()
Output:

在这个例子中,我们创建了一个简单的线图,然后使用get_picker()方法获取线条对象的当前picker设置。默认情况下,大多数Artist对象的picker设置为None,表示不可拾取。
2. get_picker()方法的返回值类型
get_picker()方法可能返回以下几种类型的值:
- None:表示Artist对象不可拾取。
- 布尔值:True表示可拾取,False表示不可拾取。
- 浮点数:表示拾取容差,即鼠标点击位置与Artist对象之间的最大允许距离。
- 可调用对象:一个自定义的picker函数,用于确定是否拾取成功。
让我们通过一些示例来详细了解这些不同类型的返回值:
2.1 返回None
import matplotlib.pyplot as plt

fig, ax = plt.subplots()
circle = plt.Circle((0.5, 0.5), 0.2, color='blue')
ax.add_artist(circle)

picker_setting = circle.get_picker()
print(f"Circle picker setting: {picker_setting}")

plt.title("get_picker() Returning None - how2matplotlib.com")
plt.show()
Output:

在这个例子中,我们创建了一个圆形对象,并使用get_picker()方法获取其picker设置。由于我们没有设置picker,默认返回None,表示该圆形不可拾取。
2.2 返回布尔值
import matplotlib.pyplot as plt

fig, ax = plt.subplots()
text = ax.text(0.5, 0.5, 'how2matplotlib.com', ha='center', va='center')
text.set_picker(True)

picker_setting = text.get_picker()
print(f"Text picker setting: {picker_setting}")

plt.title("get_picker() Returning Boolean - how2matplotlib.com")
plt.show()
Output:

这个例子中,我们创建了一个文本对象,并将其picker设置为True。使用get_picker()方法获取picker设置时,返回True,表示该文本对象可拾取。
2.3 返回浮点数
import matplotlib.pyplot as plt

fig, ax = plt.subplots()
line, = ax.plot([1, 2, 3, 4], [1, 4, 2, 3], label='how2matplotlib.com')
line.set_picker(5.0)

picker_setting = line.get_picker()
print(f"Line picker setting: {picker_setting}")

plt.title("get_picker() Returning Float - how2matplotlib.com")
plt.legend()
plt.show()
Output:

在这个例子中,我们创建了一条线,并将其picker设置为5.0。使用get_picker()方法获取picker设置时,返回5.0,表示鼠标点击位置与线条之间的最大允许距离为5个像素。
2.4 返回可调用对象
import matplotlib.pyplot as plt

def custom_picker(artist, mouse_event):
    return mouse_event.xdata > 2 and mouse_event.ydata > 2

fig, ax = plt.subplots()
scatter = ax.scatter([1, 2, 3, 4], [1, 4, 2, 3], label='how2matplotlib.com')
scatter.set_picker(custom_picker)

picker_setting = scatter.get_picker()
print(f"Scatter picker setting: {picker_setting}")

plt.title("get_picker() Returning Callable - how2matplotlib.com")
plt.legend()
plt.show()
Output:

这个例子中,我们定义了一个自定义的picker函数custom_picker,并将其设置为散点图的picker。使用get_picker()方法获取picker设置时,返回这个自定义函数对象。
3. get_picker()方法在交互式绘图中的应用
get_picker()方法在创建交互式绘图时非常有用,特别是当我们需要根据当前的picker设置来动态调整交互行为时。以下是一些实际应用场景:
3.1 动态切换可拾取性
import matplotlib.pyplot as plt

fig, ax = plt.subplots()
line, = ax.plot([1, 2, 3, 4], [1, 4, 2, 3], label='how2matplotlib.com')

def toggle_picker(event):
    if line.get_picker():
        line.set_picker(None)
        print("Line is now not pickable")
    else:
        line.set_picker(5)
        print("Line is now pickable")
    fig.canvas.draw()

fig.canvas.mpl_connect('button_press_event', toggle_picker)

plt.title("Toggle Picker - how2matplotlib.com")
plt.legend()
plt.show()
Output:

在这个例子中,我们创建了一个线图,并添加了一个鼠标点击事件处理函数。每次点击图表时,都会切换线条的可拾取性。我们使用get_picker()方法来检查当前的picker设置,然后相应地更新它。
3.2 多对象拾取管理
import matplotlib.pyplot as plt

fig, ax = plt.subplots()
circles = [plt.Circle((i/5, i/5), 0.1, color=f'C{i}') for i in range(5)]
for circle in circles:
    ax.add_artist(circle)
    circle.set_picker(True)

def on_pick(event):
    artist = event.artist
    if artist.get_picker():
        artist.set_picker(False)
        artist.set_alpha(0.5)
    else:
        artist.set_picker(True)
        artist.set_alpha(1.0)
    fig.canvas.draw()

fig.canvas.mpl_connect('pick_event', on_pick)

plt.title("Multi-object Picker Management - how2matplotlib.com")
plt.xlim(0, 1)
plt.ylim(0, 1)
plt.show()
Output:
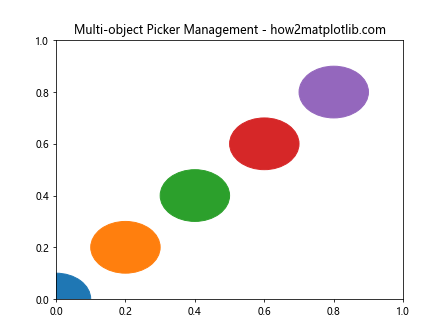
这个例子展示了如何管理多个可拾取对象。我们创建了5个圆形,初始时都是可拾取的。当用户点击一个圆形时,我们使用get_picker()方法检查其当前状态,然后切换其可拾取性和透明度。
3.3 自适应拾取容差
import matplotlib.pyplot as plt
import numpy as np

fig, ax = plt.subplots()
x = np.linspace(0, 10, 100)
line, = ax.plot(x, np.sin(x), label='how2matplotlib.com')

def update_picker(event):
    if event.button == 1:  # Left click
        current_picker = line.get_picker()
        if current_picker is None or isinstance(current_picker, bool):
            line.set_picker(5.0)
        else:
            line.set_picker(current_picker + 1.0)
    elif event.button == 3:  # Right click
        current_picker = line.get_picker()
        if isinstance(current_picker, (int, float)) and current_picker > 1.0:
            line.set_picker(current_picker - 1.0)

    print(f"Current picker setting: {line.get_picker()}")
    fig.canvas.draw()

fig.canvas.mpl_connect('button_press_event', update_picker)

plt.title("Adaptive Picker Tolerance - how2matplotlib.com")
plt.legend()
plt.show()
Output:

这个例子演示了如何实现自适应的拾取容差。用户可以通过左键点击增加拾取容差,右键点击减少拾取容差。我们使用get_picker()方法获取当前的picker设置,然后根据用户的操作进行调整。
4. get_picker()方法与其他Artist属性的结合使用
get_picker()方法常常与其他Artist属性和方法结合使用,以创建更复杂和有趣的交互式可视化。以下是一些示例:
4.1 结合zorder属性
import matplotlib.pyplot as plt
import numpy as np

fig, ax = plt.subplots()
x = np.linspace(0, 10, 100)
lines = [ax.plot(x, np.sin(x + i), label=f'Line {i+1} - how2matplotlib.com')[0] for i in range(3)]

for i, line in enumerate(lines):
    line.set_picker(True)
    line.set_zorder(i)

def on_pick(event):
    line = event.artist
    current_zorder = line.get_zorder()
    if line.get_picker():
        line.set_zorder(len(lines))
        for other_line in lines:
            if other_line != line:
                other_line.set_zorder(other_line.get_zorder() - 1)
    fig.canvas.draw()

fig.canvas.mpl_connect('pick_event', on_pick)

plt.title("Combining get_picker() with zorder - how2matplotlib.com")
plt.legend()
plt.show()
Output:
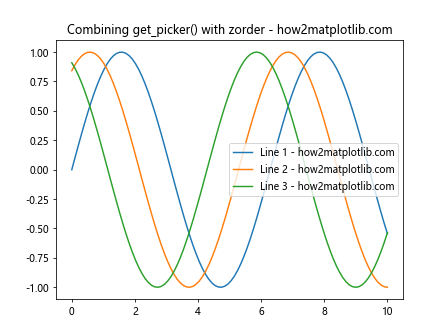
在这个例子中,我们创建了三条正弦曲线,并将它们设置为可拾取。当用户点击一条线时,我们检查其可拾取性,然后将其移到最上层(增加zorder),同时降低其他线条的zorder。
4.2 结合颜色属性
import matplotlib.pyplot as plt
import numpy as np

fig, ax = plt.subplots()
x = np.linspace(0, 10, 100)
y = np.sin(x)
line, = ax.plot(x, y, color='blue', label='how2matplotlib.com')
line.set_picker(True)

def on_pick(event):
    line = event.artist
    if line.get_picker():
        current_color = line.get_color()
        if current_color == 'blue':
            line.set_color('red')
        else:
            line.set_color('blue')
    fig.canvas.draw()

fig.canvas.mpl_connect('pick_event', on_pick)

plt.title("Combining get_picker() with color - how2matplotlib.com")
plt.legend()
plt.show()
Output:

这个例子展示了如何结合get_picker()方法和颜色属性。当用户点击线条时,我们检查其可拾取性,然后在蓝色和红色之间切换线条的颜色。
4.3 结合标签属性
import matplotlib.pyplot as plt
import numpy as np

fig, ax = plt.subplots()
x = np.linspace(0, 10, 100)
y = np.sin(x)
line, = ax.plot(x, y, label='Sin curve - how2matplotlib.com')
line.set_picker(True)

def on_pick(event):
    line = event.artist
    if line.get_picker():
        current_label = line.get_label()
        if 'Selected' not in current_label:
            line.set_label(current_label + ' (Selected)')
        else:
            line.set_label(current_label.replace(' (Selected)', ''))
        plt.legend()
    fig.canvas.draw()

fig.canvas.mpl_connect('pick_event', on_pick)

plt.title("Combining get_picker() with label - how2matplotlib.com")
plt.legend()
plt.show()
Output:

在这个例子中,我们结合了get_picker()方法和标签属性。当用户点击线条时,我们检查其可拾取性,然后在标签中添加或删除”(Selected)”文本,并更新图例。
5. get_picker()方法在自定义Artist类中的应用
当我们创建自定义的Artist类时,get_picker()方法也可以派上用场。以下是一个示例,展示如何在自定义Artist类中使用get_picker()方法:
import matplotlib.pyplot as plt
from matplotlib.patches import Circle
from matplotlib.artist import Artist

class HighlightableCircle(Circle):
    def __init__(self, *args, **kwargs):
        super().__init__(*args, **kwargs)
        self.highlight = False
        self.set_picker(True)

    def get_highlight(self):
        return self.highlight

    def set_highlight(self, highlight):
        self.highlight = highlight
        self.set_edgecolor('red' if highlight else 'black')

    def contains(self, mouseevent):
        inside, info = super().contains(mouseevent)
        if inside and self.get_picker():
            self.set_highlight(not self.get_highlight())
        return inside, info

fig, ax = plt.subplots()
circle = HighlightableCircle((0.5, 0.5), 0.2, facecolor='lightblue')
ax.add_artist(circle)

def on_pick(event):
    if isinstance(event.artist, HighlightableCircle):
        event.artist.set_highlight(not event.artist.get_highlight())
        fig.canvas.draw()

fig.canvas.mpl_connect('pick_event', on_pick)

plt.title("Custom Artist with get_picker() - how2matplotlib.com")
plt.xlim(0, 1)
plt.ylim(0, 1)
plt.show()
Output:

在这个例子中,我们创建了一个名为HighlightableCircle的自定义Artist类,它继承自Circle类。我们重写了contains方法,并使用get_picker()方法来检查圆是否可拾取。当用户点击圆时,我们切换其高亮状态。
6. get_picker()方法在动画中的应用
get_picker()方法也可以在动画中使用,以创建交互式动画。以下是一个示例:
import matplotlib.pyplot as plt
import matplotlib.animation as animation
import numpy as np

fig, ax = plt.subplots()
x = np.linspace(0, 2*np.pi, 100)
line, = ax.plot(x, np.sin(x), label='how2matplotlib.com')
line.set_picker(True)

pause = False

def animate(frame):
    if not pause:
        line.set_ydata(np.sin(x + frame/10))
    return line,

def on_pick(event):
    global pause
    if event.artist.get_picker():
        pause = not pause
        event.artist.set_color('red' if pause else 'blue')

fig.canvas.mpl_connect('pick_event', on_pick)

ani = animation.FuncAnimation(fig, animate, frames=200, interval=50, blit=True)

plt.title("Animated Plot with get_picker() - how2matplotlib.com")
plt.legend()
plt.show()
Output:
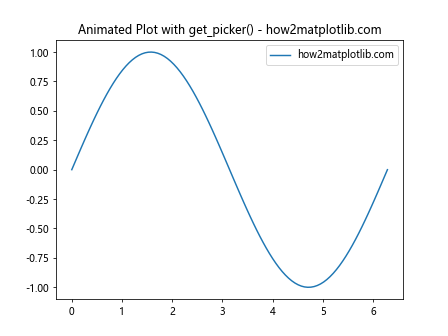
在这个例子中,我们创建了一个动画的正弦曲线。我们使用get_picker()方法来检查线条是否可拾取。当用户点击线条时,动画会暂停或继续,并且线条颜色会相应地改变。
7. get_picker()方法在子图中的应用
get_picker()方法也可以在包含多个子图的复杂图表中使用。以下是一个示例:
import matplotlib.pyplot as plt
import numpy as np

fig, (ax1, ax2) = plt.subplots(1, 2, figsize=(10, 5))

x = np.linspace(0, 10, 100)
line1, = ax1.plot(x, np.sin(x), label='Sin - how2matplotlib.com')
line2, = ax2.plot(x, np.cos(x), label='Cos - how2matplotlib.com')

line1.set_picker(True)
line2.set_picker(True)

def on_pick(event):
    line = event.artist
    ax = line.axes
    if line.get_picker():
        current_color = line.get_color()
        new_color = 'red' if current_color != 'red' else 'blue'
        line.set_color(new_color)
        ax.set_facecolor('lightgray' if new_color == 'red' else 'white')
    fig.canvas.draw()

fig.canvas.mpl_connect('pick_event', on_pick)

ax1.set_title("Sine Wave")
ax2.set_title("Cosine Wave")
ax1.legend()
ax2.legend()
plt.suptitle("Subplots with get_picker() - how2matplotlib.com")
plt.tight_layout()
plt.show()
Output:
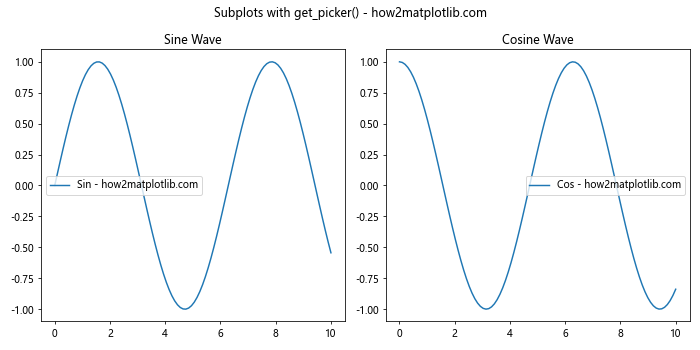
在这个例子中,我们创建了两个子图,分别显示正弦和余弦曲线。我们使用get_picker()方法来检查每条线是否可拾取。当用户点击任一条线时,该线的颜色会改变,并且相应子图的背景色也会更新。
8. get_picker()方法在3D图形中的应用
get_picker()方法不仅适用于2D图形,还可以在3D图形中使用。以下是一个示例:
import matplotlib.pyplot as plt
from mpl_toolkits.mplot3d import Axes3D
import numpy as np

fig = plt.figure()
ax = fig.add_subplot(111, projection='3d')

theta = np.linspace(-4 * np.pi, 4 * np.pi, 100)
z = np.linspace(-2, 2, 100)
r = z**2 + 1
x = r * np.sin(theta)
y = r * np.cos(theta)

line, = ax.plot(x, y, z, label='3D curve - how2matplotlib.com')
line.set_picker(True)

def on_pick(event):
    if event.artist.get_picker():
        current_linewidth = event.artist.get_linewidth()
        new_linewidth = 4 if current_linewidth == 1 else 1
        event.artist.set_linewidth(new_linewidth)
    fig.canvas.draw()

fig.canvas.mpl_connect('pick_event', on_pick)

ax.set_xlabel('X axis')
ax.set_ylabel('Y axis')
ax.set_zlabel('Z axis')
ax.legend()
plt.title("3D Plot with get_picker() - how2matplotlib.com")
plt.show()
Output:
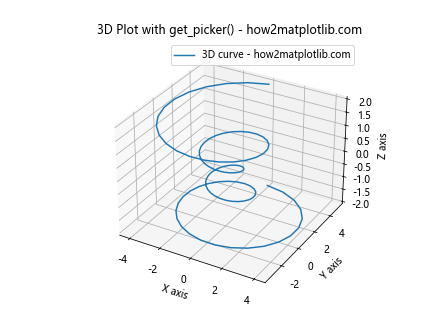
在这个例子中,我们创建了一个3D螺旋线。我们使用get_picker()方法来检查线条是否可拾取。当用户点击线条时,线条的宽度会在粗细之间切换。
9. get_picker()方法与事件处理的结合
get_picker()方法经常与Matplotlib的事件处理系统结合使用,以创建更复杂的交互式可视化。以下是一个结合鼠标移动事件的示例:
import matplotlib.pyplot as plt
import numpy as np

fig, ax = plt.subplots()
x = np.linspace(0, 10, 100)
y = np.sin(x)
line, = ax.plot(x, y, label='how2matplotlib.com')
line.set_picker(True)

annotation = ax.annotate('', xy=(0, 0), xytext=(10, 10), textcoords='offset points',
                         bbox=dict(boxstyle='round,pad=0.5', fc='yellow', alpha=0.5),
                         arrowprops=dict(arrowstyle='->'))
annotation.set_visible(False)

def on_motion(event):
    if event.inaxes == ax:
        if line.get_picker() and line.contains(event)[0]:
            x, y = event.xdata, event.ydata
            annotation.xy = (x, y)
            annotation.set_text(f'({x:.2f}, {y:.2f})')
            annotation.set_visible(True)
        else:
            annotation.set_visible(False)
        fig.canvas.draw_idle()

def on_pick(event):
    if event.artist == line:
        line.set_picker(5 if line.get_picker() is True else True)

fig.canvas.mpl_connect('motion_notify_event', on_motion)
fig.canvas.mpl_connect('pick_event', on_pick)

plt.title("get_picker() with Event Handling - how2matplotlib.com")
plt.legend()
plt.show()
Output:
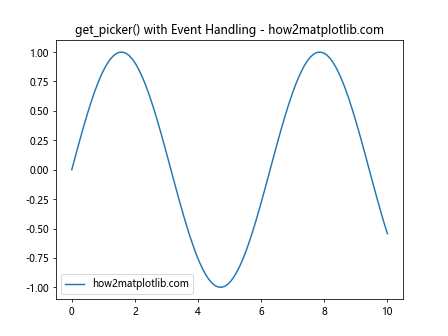
在这个例子中,我们创建了一个正弦曲线,并添加了一个注释对象。我们使用get_picker()方法来检查线条是否可拾取。当鼠标移动到线条上时,会显示当前坐标的注释。点击线条可以切换picker设置between True和一个数值。
10. get_picker()方法在交互式工具中的应用
get_picker()方法可以用于创建自定义的交互式工具,例如数据点选择器。以下是一个示例:
import matplotlib.pyplot as plt
import numpy as np
from matplotlib.widgets import Button

class PointSelector:
    def __init__(self, ax, x, y):
        self.ax = ax
        self.x = x
        self.y = y
        self.line, = ax.plot(x, y, 'o', picker=5, label='how2matplotlib.com')
        self.selected, = ax.plot([], [], 'ro', markersize=12, alpha=0.5)
        self.selected_points = set()

    def on_pick(self, event):
        if event.artist != self.line:
            return
        ind = event.ind[0]
        if ind in self.selected_points:
            self.selected_points.remove(ind)
        else:
            self.selected_points.add(ind)
        self.update()

    def update(self):
        if self.selected_points:
            selected_x = [self.x[i] for i in self.selected_points]
            selected_y = [self.y[i] for i in self.selected_points]
            self.selected.set_data(selected_x, selected_y)
        else:
            self.selected.set_data([], [])
        self.ax.figure.canvas.draw_idle()

    def clear(self, event):
        self.selected_points.clear()
        self.update()

fig, ax = plt.subplots()
x = np.random.rand(20)
y = np.random.rand(20)
selector = PointSelector(ax, x, y)

fig.canvas.mpl_connect('pick_event', selector.on_pick)

ax_clear = plt.axes([0.81, 0.05, 0.1, 0.075])
btn_clear = Button(ax_clear, 'Clear')
btn_clear.on_clicked(selector.clear)

plt.title("Interactive Point Selector - how2matplotlib.com")
plt.legend()
plt.show()
在这个例子中,我们创建了一个PointSelector类,它允许用户通过点击来选择或取消选择数据点。我们使用get_picker()方法(隐含在picker参数中)来设置点的可拾取性。选中的点会用更大的红色圆圈标记。我们还添加了一个”Clear”按钮来清除所有选择。
总结
通过本文的详细介绍和丰富的示例,我们深入探讨了Matplotlib中Artist对象的get_picker()方法。我们了解了该方法的基本用法、返回值类型、以及在各种场景下的应用,包括交互式绘图、动画、3D图形和自定义工具等。
get_picker()方法是实现交互式可视化的重要工具,它允许我们检查和控制Artist对象的可拾取性,从而创建响应用户输入的动态图表。通过与其他Matplotlib功能和事件处理系统的结合,我们可以构建复杂而强大的数据可视化应用。
在实际应用中,get_picker()方法常常与set_picker()方法配合使用,以动态调整对象的可拾取性。它还可以与其他Artist属性(如颜色、大小、标签等)结合,创造出丰富的交互效果。
掌握get_picker()方法及其相关技巧,将帮助你在使用Matplotlib时创建更加灵活和交互性强的数据可视化作品。无论是简单的点击响应,还是复杂的数据探索工具,get_picker()方法都是不可或缺的重要组成部分。
 极客教程
极客教程