Matplotlib中的Artist.get_rasterized()方法详解与应用
参考:Matplotlib.artist.Artist.get_rasterized() in Python
Matplotlib是Python中最流行的数据可视化库之一,它提供了丰富的绘图功能和灵活的自定义选项。在Matplotlib的架构中,Artist类是一个重要的基础类,它是所有可视化元素的父类。本文将深入探讨Artist类中的get_rasterized()方法,这个方法用于获取图形元素是否被栅格化的状态。
1. Artist类简介
在深入了解get_rasterized()方法之前,我们需要先了解Artist类的基本概念。Artist类是Matplotlib中所有可视化元素的基类,包括图形、轴、线条、文本等。它定义了这些元素的共同属性和方法,如颜色、线型、透明度等。
以下是一个简单的示例,展示了如何创建一个Artist对象:
import matplotlib.pyplot as plt
import matplotlib.patches as patches

fig, ax = plt.subplots()
circle = patches.Circle((0.5, 0.5), 0.2, fill=False)
ax.add_patch(circle)
ax.set_title("how2matplotlib.com - Simple Artist Example")
plt.show()
Output:
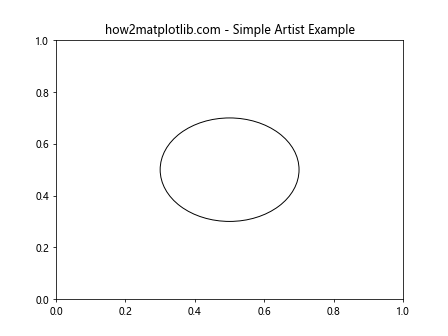
在这个例子中,我们创建了一个Circle对象,它是Artist的一个子类。我们可以通过调用各种方法来修改这个圆的属性。
2. 栅格化概念
栅格化是将矢量图形转换为像素图像的过程。在Matplotlib中,某些图形元素可以被栅格化,以提高渲染性能或实现特定的视觉效果。
栅格化的优点包括:
– 提高渲染速度,特别是对于复杂的图形
– 减少文件大小,特别是在保存为位图格式时
– 实现某些特殊的视觉效果
缺点包括:
– 放大时可能会出现像素化
– 无法进行无损缩放
3. get_rasterized()方法介绍
get_rasterized()是Artist类的一个方法,用于获取当前Artist对象是否被栅格化。这个方法不接受任何参数,返回一个布尔值:
– 如果返回True,表示该Artist对象被栅格化
– 如果返回False,表示该Artist对象未被栅格化
以下是一个使用get_rasterized()方法的简单示例:
import matplotlib.pyplot as plt
import matplotlib.patches as patches

fig, ax = plt.subplots()
circle = patches.Circle((0.5, 0.5), 0.2, fill=False)
ax.add_patch(circle)

is_rasterized = circle.get_rasterized()
print(f"how2matplotlib.com - Is the circle rasterized? {is_rasterized}")

ax.set_title("how2matplotlib.com - get_rasterized() Example")
plt.show()
Output:
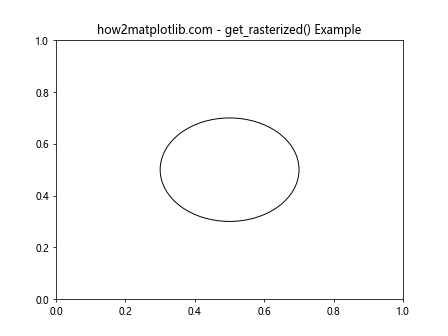
在这个例子中,我们创建了一个圆形对象,然后使用get_rasterized()方法检查它是否被栅格化。默认情况下,大多数Artist对象是不被栅格化的。
4. 设置栅格化状态
虽然get_rasterized()方法用于获取栅格化状态,但我们也可以使用set_rasterized()方法来设置栅格化状态。这允许我们控制特定Artist对象的渲染方式。
以下是一个设置栅格化状态的示例:
import matplotlib.pyplot as plt
import matplotlib.patches as patches

fig, (ax1, ax2) = plt.subplots(1, 2, figsize=(10, 5))

circle1 = patches.Circle((0.5, 0.5), 0.2, fill=False)
ax1.add_patch(circle1)
ax1.set_title("how2matplotlib.com - Non-rasterized")

circle2 = patches.Circle((0.5, 0.5), 0.2, fill=False)
circle2.set_rasterized(True)
ax2.add_patch(circle2)
ax2.set_title("how2matplotlib.com - Rasterized")

print(f"Circle 1 rasterized: {circle1.get_rasterized()}")
print(f"Circle 2 rasterized: {circle2.get_rasterized()}")

plt.show()
Output:
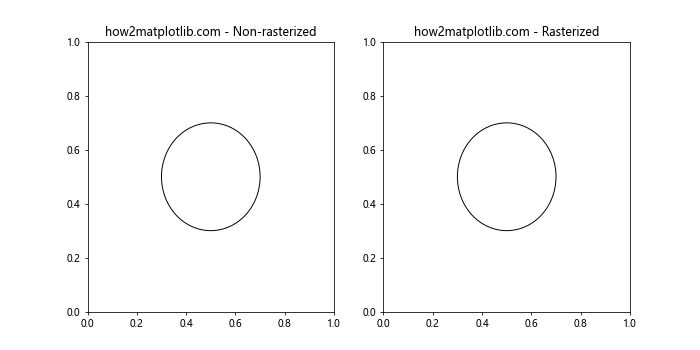
在这个例子中,我们创建了两个圆形对象,一个保持默认的非栅格化状态,另一个被设置为栅格化。然后我们使用get_rasterized()方法检查它们的状态。
5. 栅格化对不同类型Artist的影响
栅格化对不同类型的Artist对象可能有不同的影响。让我们看看它如何影响线条、标记和文本。
5.1 线条的栅格化
import matplotlib.pyplot as plt
import numpy as np

fig, (ax1, ax2) = plt.subplots(1, 2, figsize=(10, 5))

x = np.linspace(0, 10, 1000)
y = np.sin(x)

line1, = ax1.plot(x, y, linewidth=2)
ax1.set_title("how2matplotlib.com - Non-rasterized Line")

line2, = ax2.plot(x, y, linewidth=2, rasterized=True)
ax2.set_title("how2matplotlib.com - Rasterized Line")

print(f"Line 1 rasterized: {line1.get_rasterized()}")
print(f"Line 2 rasterized: {line2.get_rasterized()}")

plt.show()
Output:
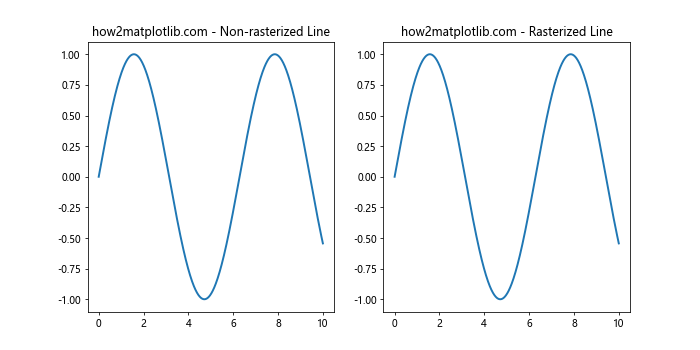
在这个例子中,我们绘制了两条正弦曲线,一条是非栅格化的,另一条是栅格化的。栅格化的线条在放大时可能会显示像素化效果。
5.2 标记的栅格化
import matplotlib.pyplot as plt
import numpy as np

fig, (ax1, ax2) = plt.subplots(1, 2, figsize=(10, 5))

x = np.linspace(0, 10, 20)
y = np.sin(x)

scatter1 = ax1.scatter(x, y, s=100)
ax1.set_title("how2matplotlib.com - Non-rasterized Markers")

scatter2 = ax2.scatter(x, y, s=100, rasterized=True)
ax2.set_title("how2matplotlib.com - Rasterized Markers")

print(f"Scatter 1 rasterized: {scatter1.get_rasterized()}")
print(f"Scatter 2 rasterized: {scatter2.get_rasterized()}")

plt.show()
Output:
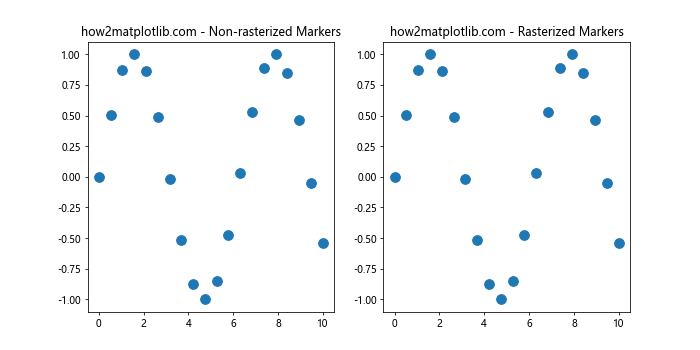
这个例子展示了标记(散点图)的栅格化。栅格化的标记在放大时可能会失去清晰度。
5.3 文本的栅格化
import matplotlib.pyplot as plt

fig, (ax1, ax2) = plt.subplots(1, 2, figsize=(10, 5))

text1 = ax1.text(0.5, 0.5, "how2matplotlib.com\nNon-rasterized Text",
                 ha='center', va='center', fontsize=16)
ax1.set_title("Non-rasterized Text")

text2 = ax2.text(0.5, 0.5, "how2matplotlib.com\nRasterized Text",
                 ha='center', va='center', fontsize=16, rasterized=True)
ax2.set_title("Rasterized Text")

print(f"Text 1 rasterized: {text1.get_rasterized()}")
print(f"Text 2 rasterized: {text2.get_rasterized()}")

plt.show()
Output:
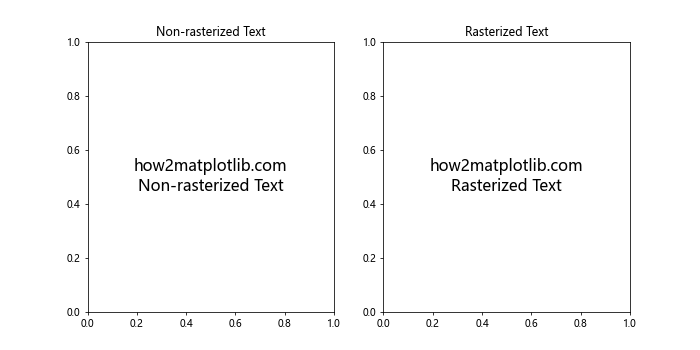
这个例子展示了文本的栅格化。栅格化的文本在放大时可能会变得模糊。
6. 栅格化在保存图像时的应用
栅格化在保存图像时特别有用,尤其是当你需要控制文件大小或者处理复杂的图形时。
import matplotlib.pyplot as plt
import numpy as np

fig, ax = plt.subplots(figsize=(8, 6))

# 创建复杂的背景
x = np.linspace(0, 10, 1000)
y = np.sin(x) * np.exp(-x/10)
background = ax.plot(x, y, linewidth=0.5, color='lightgray', zorder=0)

# 添加主要数据点
main_data = ax.scatter(np.linspace(0, 10, 20), np.random.rand(20),
                       s=100, color='red', zorder=1)

# 设置标题和标签
ax.set_title("how2matplotlib.com - Rasterized Background Example")
ax.set_xlabel("X-axis")
ax.set_ylabel("Y-axis")

# 栅格化背景,保持主要数据点为矢量
background[0].set_rasterized(True)

# 保存图像
plt.savefig('rasterized_example.pdf', dpi=300, bbox_inches='tight')
plt.show()
Output:
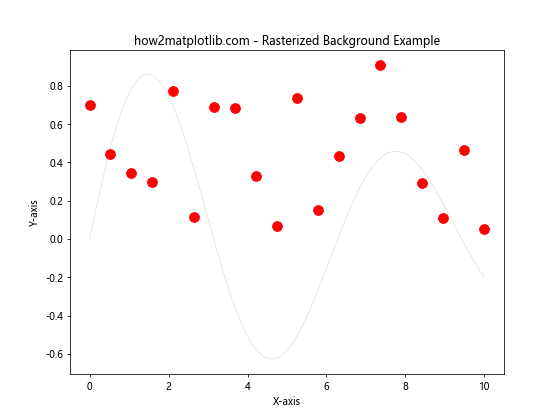
在这个例子中,我们创建了一个复杂的背景和一些主要的数据点。我们将背景栅格化以减小文件大小,同时保持主要数据点为矢量格式以保证清晰度。
7. 栅格化与分辨率的关系
栅格化的效果与图像的分辨率密切相关。高分辨率可以在一定程度上减轻栅格化带来的质量损失。
import matplotlib.pyplot as plt
import numpy as np

def create_plot(dpi):
    fig, ax = plt.subplots(figsize=(6, 4), dpi=dpi)
    x = np.linspace(0, 10, 1000)
    y = np.sin(x)
    line = ax.plot(x, y, linewidth=2, rasterized=True)[0]
    ax.set_title(f"how2matplotlib.com - Rasterized at {dpi} DPI")
    return fig, line

# 创建不同分辨率的图
dpi_values = [72, 150, 300]
for dpi in dpi_values:
    fig, line = create_plot(dpi)
    print(f"DPI: {dpi}, Rasterized: {line.get_rasterized()}")
    plt.savefig(f'rasterized_{dpi}dpi.png', dpi=dpi, bbox_inches='tight')
    plt.close(fig)

print("Images saved with different resolutions.")
这个例子创建了三个不同分辨率的图像,所有图像中的线条都被栅格化。你可以比较不同分辨率下栅格化的效果。
8. 栅格化与图层顺序
在Matplotlib中,图层的顺序(zorder)也会影响栅格化的效果。通常,我们希望将栅格化的元素放在底层,而将需要保持清晰的元素放在上层。
import matplotlib.pyplot as plt
import numpy as np

fig, ax = plt.subplots(figsize=(8, 6))

# 创建背景
x = np.linspace(0, 10, 1000)
y1 = np.sin(x)
y2 = np.cos(x)
background1 = ax.plot(x, y1, linewidth=1, color='lightblue', zorder=0, rasterized=True)
background2 = ax.plot(x, y2, linewidth=1, color='lightgreen', zorder=1, rasterized=True)

# 添加主要数据点
main_data = ax.scatter(np.linspace(0, 10, 20), np.random.rand(20),
                       s=100, color='red', zorder=2)

ax.set_title("how2matplotlib.com - Rasterization and Layer Order")
ax.set_xlabel("X-axis")
ax.set_ylabel("Y-axis")

print(f"Background 1 rasterized: {background1[0].get_rasterized()}")
print(f"Background 2 rasterized: {background2[0].get_rasterized()}")
print(f"Main data rasterized: {main_data.get_rasterized()}")

plt.show()
Output:
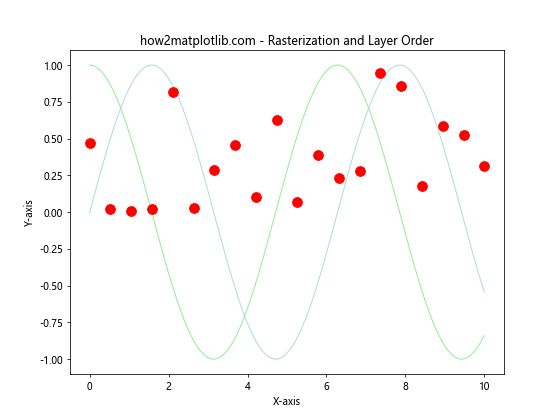
在这个例子中,我们创建了两个栅格化的背景层和一个非栅格化的主数据层。背景层的zorder较低,确保它们位于主数据层之下。
9. 栅格化与透明度
栅格化还可能影响透明度的渲染。在某些情况下,栅格化可能会改变透明元素的外观。
import matplotlib.pyplot as plt
import numpy as np

fig, (ax1, ax2) = plt.subplots(1, 2, figsize=(12, 5))

x = np.linspace(0, 10, 100)
y = np.sin(x)

# 非栅格化的透明线条
line1 = ax1.plot(x, y, linewidth=10, alpha=0.5, color='blue')
ax1.set_title("how2matplotlib.com - Non-rasterized Transparent Line")

# 栅格化的透明线条
line2 = ax2.plot(x, y, linewidth=10, alpha=0.5, color='blue', rasterized=True)
ax2.set_title("how2matplotlib.com - Rasterized Transparent Line")

print(f"Line 1 rasterized: {line1[0].get_rasterized()}")
print(f"Line 2 rasterized: {line2[0].get_rasterized()}")

plt.show()
Output:
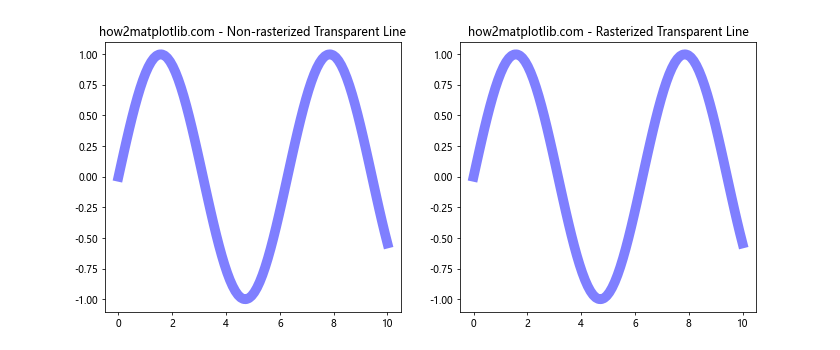
这个例子展示了栅格化如何影响透明线条的渲染。你可能会注意到栅格化版本的透明度看起来略有不同。
10. 栅格化与矢量图形导出
当导出矢量格式(如PDF或SVG)时,栅格化的元素会被转换为位图,而非栅格化的元素则保持为矢量格式。这可能会影响文件大小和图像质量。
import matplotlib.pyplot as plt
import numpy as np

def create_complex_plot(rasterized=False):
    fig, ax = plt.subplots(figsize=(8,6))

    # 创建复杂背景
    x = np.linspace(0, 10, 1000)
    y = np.sin(x) * np.exp(-x/10)
    background = ax.plot(x, y, linewidth=0.5, color='lightgray', zorder=0, rasterized=rasterized)

    # 添加主要数据点
    main_data = ax.scatter(np.linspace(0, 10, 20), np.random.rand(20),
                           s=100, color='red', zorder=1)

    ax.set_title(f"how2matplotlib.com - {'Rasterized' if rasterized else 'Non-rasterized'} Complex Plot")
    ax.set_xlabel("X-axis")
    ax.set_ylabel("Y-axis")

    return fig, background[0], main_data

# 创建栅格化和非栅格化版本
fig_non_raster, bg_non_raster, data_non_raster = create_complex_plot(rasterized=False)
fig_raster, bg_raster, data_raster = create_complex_plot(rasterized=True)

print(f"Background (non-rasterized) rasterized: {bg_non_raster.get_rasterized()}")
print(f"Background (rasterized) rasterized: {bg_raster.get_rasterized()}")

# 保存为PDF
fig_non_raster.savefig('non_rasterized_complex.pdf', dpi=300, bbox_inches='tight')
fig_raster.savefig('rasterized_complex.pdf', dpi=300, bbox_inches='tight')

plt.close(fig_non_raster)
plt.close(fig_raster)

print("PDF files saved. Compare their sizes and quality.")
这个例子创建了两个版本的复杂图形:一个完全矢量化,另一个背景被栅格化。将它们保存为PDF后,你可以比较文件大小和图像质量的差异。
11. 栅格化与图形性能
在处理大量数据或复杂图形时,栅格化可以显著提高渲染性能。这在创建交互式图形或动画时特别有用。
import matplotlib.pyplot as plt
import numpy as np
import time

def plot_performance_test(rasterized=False):
    fig, ax = plt.subplots(figsize=(8, 6))

    start_time = time.time()

    for _ in range(100):
        x = np.random.rand(1000)
        y = np.random.rand(1000)
        ax.plot(x, y, alpha=0.1, rasterized=rasterized)

    end_time = time.time()

    ax.set_title(f"how2matplotlib.com - {'Rasterized' if rasterized else 'Non-rasterized'} Performance Test")

    return fig, end_time - start_time

# 测试非栅格化性能
fig_non_raster, time_non_raster = plot_performance_test(rasterized=False)
plt.close(fig_non_raster)

# 测试栅格化性能
fig_raster, time_raster = plot_performance_test(rasterized=True)
plt.close(fig_raster)

print(f"Non-rasterized plotting time: {time_non_raster:.4f} seconds")
print(f"Rasterized plotting time: {time_raster:.4f} seconds")
这个例子比较了绘制大量线条时栅格化和非栅格化的性能差异。通常,栅格化版本会更快,特别是在处理复杂图形时。
12. 栅格化与图形编辑
栅格化还会影响图形的后期编辑能力。非栅格化(矢量)图形更容易在图形编辑软件中进行修改。
import matplotlib.pyplot as plt
import numpy as np

fig, (ax1, ax2) = plt.subplots(1, 2, figsize=(12, 5))

# 创建复杂图形
x = np.linspace(0, 10, 1000)
y = np.sin(x) * np.exp(-x/10)

# 非栅格化版本
line1 = ax1.plot(x, y, linewidth=2, color='blue')
ax1.set_title("how2matplotlib.com - Non-rasterized (Editable)")

# 栅格化版本
line2 = ax2.plot(x, y, linewidth=2, color='blue', rasterized=True)
ax2.set_title("how2matplotlib.com - Rasterized (Less Editable)")

print(f"Line 1 rasterized: {line1[0].get_rasterized()}")
print(f"Line 2 rasterized: {line2[0].get_rasterized()}")

# 保存为SVG格式
plt.savefig('editable_comparison.svg', format='svg', dpi=300, bbox_inches='tight')
plt.close(fig)

print("SVG file saved. Open in a vector graphics editor to compare editability.")
这个例子创建了两个版本的图形,一个是非栅格化的,另一个是栅格化的。将它们保存为SVG格式后,你可以在矢量图形编辑器中打开,比较它们的可编辑性。
13. 栅格化与图形缩放
栅格化对图形的缩放行为有显著影响。矢量图形可以无损放大,而栅格化图形在放大时会失真。
import matplotlib.pyplot as plt
import numpy as np

def create_scalable_plot(rasterized=False):
    fig, ax = plt.subplots(figsize=(8, 6))

    x = np.linspace(0, 10, 1000)
    y = np.sin(x)

    line = ax.plot(x, y, linewidth=2, color='blue', rasterized=rasterized)[0]
    ax.set_title(f"how2matplotlib.com - {'Rasterized' if rasterized else 'Non-rasterized'} Scalable Plot")

    return fig, line

# 创建非栅格化和栅格化版本
fig_vector, line_vector = create_scalable_plot(rasterized=False)
fig_raster, line_raster = create_scalable_plot(rasterized=True)

print(f"Vector line rasterized: {line_vector.get_rasterized()}")
print(f"Raster line rasterized: {line_raster.get_rasterized()}")

# 保存为PDF以便于缩放
fig_vector.savefig('vector_scalable.pdf', dpi=300, bbox_inches='tight')
fig_raster.savefig('raster_scalable.pdf', dpi=300, bbox_inches='tight')

plt.close(fig_vector)
plt.close(fig_raster)

print("PDF files saved. Open and zoom in to compare scaling quality.")
这个例子创建了两个版本的图形,一个是矢量的,另一个是栅格化的。将它们保存为PDF后,你可以打开并放大来比较缩放质量的差异。
14. 栅格化与文件格式兼容性
不同的文件格式对栅格化的支持程度不同。矢量格式(如PDF、SVG)可以保留栅格化和非栅格化元素的区别,而位图格式(如PNG、JPG)会将所有内容转换为像素。
import matplotlib.pyplot as plt
import numpy as np

fig, ax = plt.subplots(figsize=(8, 6))

# 创建部分栅格化的图形
x = np.linspace(0, 10, 1000)
y1 = np.sin(x)
y2 = np.cos(x)

line1 = ax.plot(x, y1, linewidth=2, color='blue', label='Vector')
line2 = ax.plot(x, y2, linewidth=2, color='red', label='Rasterized', rasterized=True)

ax.set_title("how2matplotlib.com - Mixed Rasterization")
ax.legend()

print(f"Line 1 rasterized: {line1[0].get_rasterized()}")
print(f"Line 2 rasterized: {line2[0].get_rasterized()}")

# 保存为不同格式
formats = ['pdf', 'svg', 'png', 'jpg']
for fmt in formats:
    plt.savefig(f'format_comparison.{fmt}', format=fmt, dpi=300, bbox_inches='tight')

plt.close(fig)

print("Files saved in different formats. Compare their appearance and file sizes.")
这个例子创建了一个混合了栅格化和非栅格化元素的图形,并将其保存为不同的文件格式。你可以比较这些文件的外观和大小,以了解不同格式如何处理栅格化。
15. 结论
Matplotlib的Artist.get_rasterized()方法是一个强大的工具,允许我们检查和控制图形元素的栅格化状态。通过合理使用栅格化,我们可以在文件大小、渲染性能和图像质量之间取得平衡。
栅格化适用于:
– 复杂的背景图形
– 大量重复的元素
– 需要控制文件大小的情况
– 提高渲染性能
非栅格化适用于:
– 需要保持清晰度的主要图形元素
– 可能需要后期编辑的元素
– 需要无损缩放的图形
在实际应用中,我们often需要权衡这些因素,根据具体需求选择是否栅格化特定的图形元素。通过灵活运用get_rasterized()和set_rasterized()方法,我们可以创建既美观又高效的数据可视化作品。
总之,理解和掌握栅格化技术可以帮助我们在Matplotlib中创建更加优化和专业的图形。无论是为了学术论文、数据报告还是交互式应用,合理使用栅格化都能为我们的可视化工作带来显著的改进。
 极客教程
极客教程