Matplotlib中如何设置绘图背景颜色:全面指南
参考:How to Set Plot Background Color in Matplotlib
Matplotlib是Python中最流行的数据可视化库之一,它提供了丰富的功能来创建各种类型的图表和绘图。在创建图表时,设置适当的背景颜色不仅可以增强图表的视觉吸引力,还可以提高数据的可读性和整体美观度。本文将详细介绍如何在Matplotlib中设置绘图背景颜色,包括不同的方法、技巧和最佳实践。
1. 基本概念
在深入探讨如何设置背景颜色之前,我们需要了解Matplotlib中的一些基本概念:
1.1 Figure和Axes
- Figure:整个图形窗口
- Axes:图形中的单个绘图区域
理解这两个概念对于正确设置背景颜色至关重要,因为我们可以分别为整个Figure和单个Axes设置背景颜色。
1.2 颜色表示方法
Matplotlib支持多种颜色表示方法:
- 颜色名称:如’red’、’blue’、’green’等
- RGB元组:如(1, 0, 0)表示红色
- RGBA元组:如(1, 0, 0, 0.5)表示半透明红色
- 十六进制颜色代码:如’#FF0000’表示红色
了解这些表示方法可以帮助我们更灵活地设置背景颜色。
2. 设置Figure背景颜色
设置整个Figure的背景颜色是最常见的需求之一。以下是几种实现方法:
2.1 使用figure.patch.set_facecolor()方法
import matplotlib.pyplot as plt

fig = plt.figure(figsize=(8, 6))
fig.patch.set_facecolor('#E6E6FA')  # 设置浅紫色背景

plt.plot([1, 2, 3, 4], [1, 4, 2, 3], label='how2matplotlib.com')
plt.title('Figure Background Color Example')
plt.legend()
plt.show()
Output:
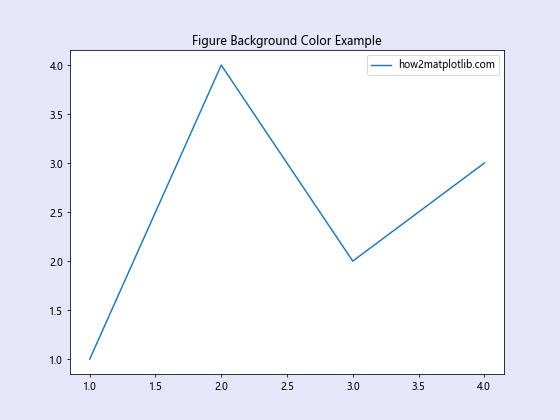
在这个例子中,我们创建了一个Figure对象,然后使用fig.patch.set_facecolor()方法设置背景颜色为浅紫色。这种方法直接作用于Figure对象,适用于需要精确控制Figure属性的情况。
2.2 使用plt.figure()的facecolor参数
import matplotlib.pyplot as plt

plt.figure(figsize=(8, 6), facecolor='#FFF0F5')  # 设置浅粉红色背景

plt.plot([1, 2, 3, 4], [1, 4, 2, 3], label='how2matplotlib.com')
plt.title('Figure Background Color Example')
plt.legend()
plt.show()
Output:
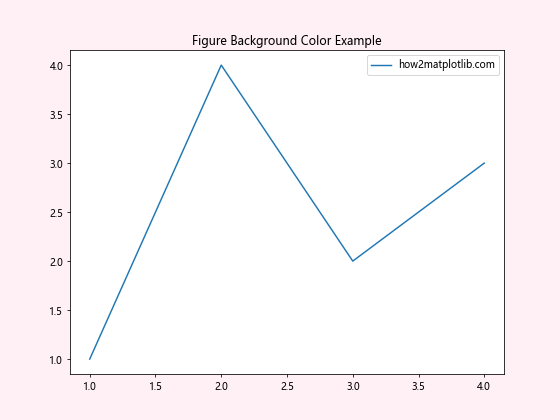
这个例子展示了如何在创建Figure时直接设置背景颜色。通过plt.figure()函数的facecolor参数,我们可以一步完成Figure创建和背景颜色设置。这种方法更加简洁,适合快速设置背景颜色的场景。
2.3 使用rcParams全局设置
import matplotlib.pyplot as plt
import matplotlib as mpl

mpl.rcParams['figure.facecolor'] = '#F0FFF0'  # 设置蜜瓜色背景

plt.figure(figsize=(8, 6))
plt.plot([1, 2, 3, 4], [1, 4, 2, 3], label='how2matplotlib.com')
plt.title('Figure Background Color Example')
plt.legend()
plt.show()
Output:
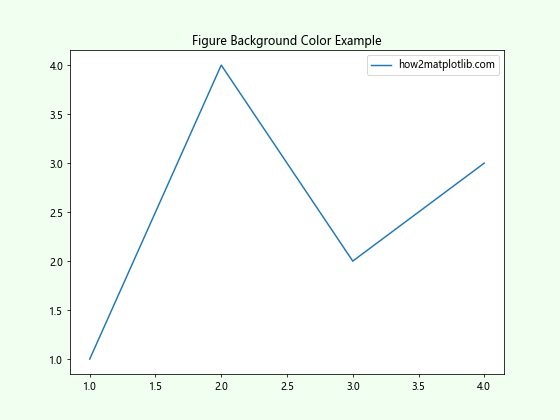
通过修改rcParams,我们可以全局设置Figure的背景颜色。这种方法适用于需要在整个项目中保持一致背景颜色的情况。需要注意的是,这种设置会影响之后创建的所有Figure,除非被局部设置覆盖。
3. 设置Axes背景颜色
除了设置整个Figure的背景颜色,我们还可以单独设置Axes(绘图区域)的背景颜色。这在创建复杂的多子图布局时特别有用。
3.1 使用set_facecolor()方法
import matplotlib.pyplot as plt

fig, ax = plt.subplots(figsize=(8, 6))
ax.set_facecolor('#E6E6FA')  # 设置Axes背景为浅紫色

ax.plot([1, 2, 3, 4], [1, 4, 2, 3], label='how2matplotlib.com')
ax.set_title('Axes Background Color Example')
ax.legend()
plt.show()
Output:
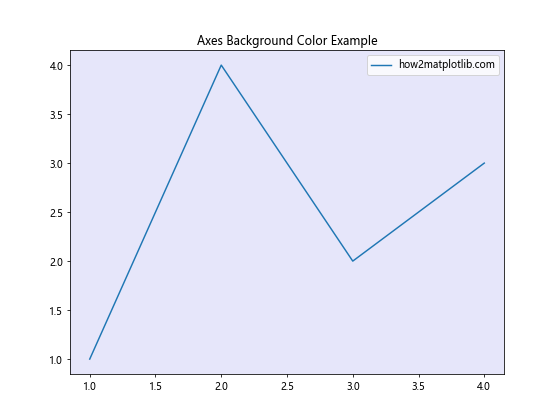
这个例子展示了如何使用set_facecolor()方法设置Axes的背景颜色。这种方法直接作用于Axes对象,允许我们精确控制单个绘图区域的背景颜色。
3.2 使用plt.axes()的facecolor参数
import matplotlib.pyplot as plt

fig = plt.figure(figsize=(8, 6))
ax = plt.axes([0.1, 0.1, 0.8, 0.8], facecolor='#FFF0F5')  # 设置Axes背景为浅粉红色

ax.plot([1, 2, 3, 4], [1, 4, 2, 3], label='how2matplotlib.com')
ax.set_title('Axes Background Color Example')
ax.legend()
plt.show()
Output:
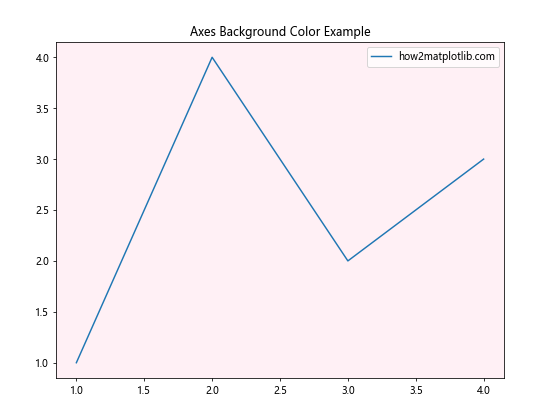
在这个例子中,我们使用plt.axes()函数创建Axes对象时直接设置背景颜色。这种方法适合在创建自定义布局的图表时使用。
3.3 使用add_subplot()方法
import matplotlib.pyplot as plt

fig = plt.figure(figsize=(8, 6))
ax = fig.add_subplot(111, facecolor='#F0FFF0')  # 设置Axes背景为蜜瓜色

ax.plot([1, 2, 3, 4], [1, 4, 2, 3], label='how2matplotlib.com')
ax.set_title('Axes Background Color Example')
ax.legend()
plt.show()
Output:
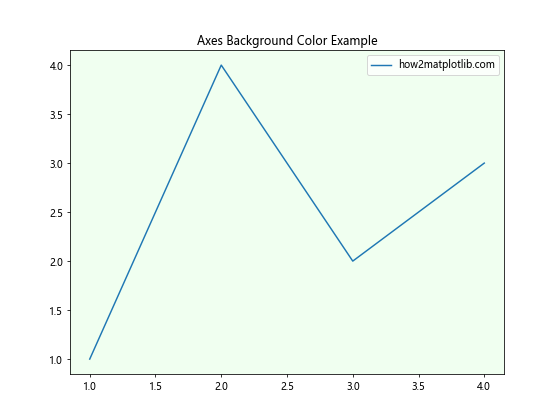
add_subplot()方法是创建子图的常用方法,我们可以通过其facecolor参数设置Axes的背景颜色。这种方法特别适合创建多子图布局时使用。
4. 设置透明背景
有时,我们可能需要创建透明背景的图表,以便将其嵌入到其他图像或文档中。
4.1 设置Figure透明背景
import matplotlib.pyplot as plt

fig = plt.figure(figsize=(8, 6), facecolor='none')
fig.patch.set_alpha(0.0)

plt.plot([1, 2, 3, 4], [1, 4, 2, 3], label='how2matplotlib.com')
plt.title('Transparent Figure Background Example')
plt.legend()
plt.show()
Output:
在这个例子中,我们通过设置facecolor='none'和alpha=0.0来创建一个完全透明的Figure背景。这对于创建可以无缝集成到其他设计中的图表非常有用。
4.2 设置Axes透明背景
import matplotlib.pyplot as plt

fig, ax = plt.subplots(figsize=(8, 6))
ax.set_facecolor('none')
ax.patch.set_alpha(0.0)

ax.plot([1, 2, 3, 4], [1, 4, 2, 3], label='how2matplotlib.com')
ax.set_title('Transparent Axes Background Example')
ax.legend()
plt.show()
Output:
类似地,我们可以为Axes设置透明背景。这在创建复杂的图表布局时特别有用,可以让不同层次的元素更好地融合。
5. 渐变背景
创建渐变背景可以为图表添加更多视觉吸引力。虽然Matplotlib没有直接提供设置渐变背景的方法,但我们可以通过一些技巧来实现这个效果。
5.1 使用imshow()创建简单渐变背景
import matplotlib.pyplot as plt
import numpy as np

fig, ax = plt.subplots(figsize=(8, 6))

# 创建渐变数组
gradient = np.linspace(0, 1, 256).reshape(1, -1)
gradient = np.repeat(gradient, 256, axis=0)

# 使用imshow()显示渐变
ax.imshow(gradient, cmap='Blues', aspect='auto', extent=[0, 10, 0, 10])

# 绘制数据
ax.plot([2, 5, 8], [3, 7, 4], 'ro-', label='how2matplotlib.com')
ax.set_title('Gradient Background Example')
ax.legend()

plt.show()
Output:
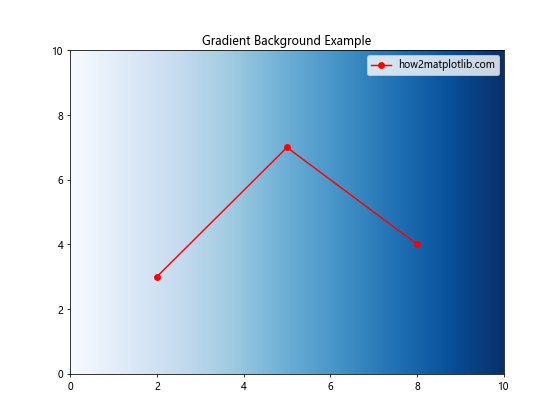
这个例子展示了如何使用imshow()函数创建一个简单的渐变背景。我们首先创建一个渐变数组,然后使用imshow()将其显示为背景。这种方法可以创建各种颜色的渐变效果。
5.2 创建径向渐变背景
import matplotlib.pyplot as plt
import numpy as np

fig, ax = plt.subplots(figsize=(8, 6))

# 创建径向渐变
x, y = np.meshgrid(np.linspace(-1, 1, 256), np.linspace(-1, 1, 256))
r = np.sqrt(x*x + y*y)
z = np.exp(-r**2)

# 使用imshow()显示径向渐变
ax.imshow(z, cmap='coolwarm', extent=[-10, 10, -10, 10], aspect='auto')

# 绘制数据
ax.plot([-5, 0, 5], [-3, 7, 2], 'ko-', label='how2matplotlib.com')
ax.set_title('Radial Gradient Background Example')
ax.legend()

plt.show()
Output:
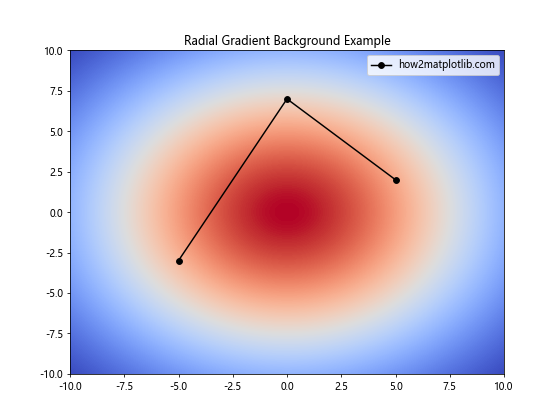
这个例子展示了如何创建径向渐变背景。我们使用meshgrid()函数创建一个二维网格,然后计算每个点到中心的距离,最后使用指数函数创建渐变效果。这种方法可以创建出更复杂和有趣的背景效果。
6. 自定义背景图案
除了纯色和渐变背景,我们还可以创建自定义的背景图案来增加图表的视觉趣味性。
6.1 使用hatch创建简单图案背景
import matplotlib.pyplot as plt

fig, ax = plt.subplots(figsize=(8, 6))

# 创建一个覆盖整个Axes的矩形,并设置hatch图案
ax.add_patch(plt.Rectangle((0, 0), 1, 1, transform=ax.transAxes, fill=False, hatch='//'))

ax.plot([0.2, 0.5, 0.8], [0.3, 0.7, 0.4], 'ro-', label='how2matplotlib.com')
ax.set_title('Hatch Pattern Background Example')
ax.legend()

plt.show()
Output:
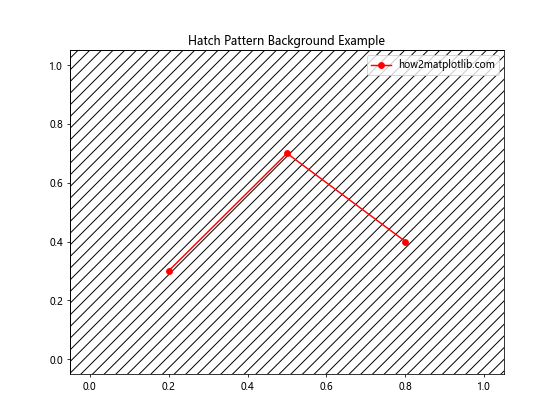
这个例子展示了如何使用hatch参数创建简单的背景图案。我们添加了一个覆盖整个Axes的矩形,并设置其hatch属性来创建斜线图案。这种方法可以创建各种简单的重复图案背景。
6.2 使用自定义图案填充背景
import matplotlib.pyplot as plt
import numpy as np

def create_circle_pattern(size=20):
    pattern = np.zeros((size, size))
    y, x = np.ogrid[-size//2:size//2, -size//2:size//2]
    mask = x**2 + y**2 <= (size//4)**2
    pattern[mask] = 1
    return pattern

fig, ax = plt.subplots(figsize=(8, 6))

# 创建自定义图案
pattern = create_circle_pattern()
ax.imshow(np.tile(pattern, (13, 17)), cmap='Blues', alpha=0.3, extent=[0, 10, 0, 10])

# 绘制数据
ax.plot([2, 5, 8], [3, 7, 4], 'ro-', label='how2matplotlib.com')
ax.set_title('Custom Pattern Background Example')
ax.legend()

plt.show()
Output:
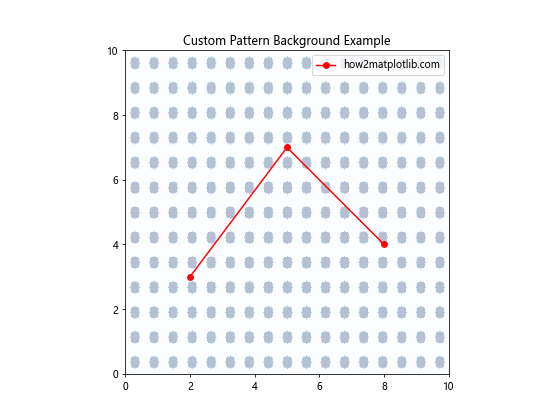
这个例子展示了如何创建和使用自定义图案作为背景。我们定义了一个函数来创建圆形图案,然后使用np.tile()函数将这个图案重复铺满整个背景。这种方法允许我们创建更复杂和独特的背景图案。
7. 多子图背景设置
在创建包含多个子图的复杂图表时,我们可能需要为不同的子图设置不同的背景颜色或图案。
7.1 为不同子图设置不同背景颜色
import matplotlib.pyplot as plt

fig, axs = plt.subplots(2, 2, figsize=(10, 10))

colors = ['#FFE4E1', '#E6E6FA', '#F0FFF0', '#FFF0F5']
titles = ['Spring', 'Summer', 'Autumn', 'Winter']

for ax, color, title in zip(axs.flat, colors, titles):
    ax.set_facecolor(color)
    ax.plot([1, 2, 3, 4], np.random.rand(4), label='how2matplotlib.com')
    ax.set_title(title)
    ax.legend()

plt.tight_layout()
plt.show()
这个例子展示了如何为2×2的子图布局中的每个子图设置不同的背景颜色。我们使用zip()函数来同时遍历子图、颜色和标题,为每个子图设置独特的背景和内容。### 7.2 创建复杂的多子图背景布局
import matplotlib.pyplot as plt
import matplotlib.gridspec as gridspec

fig = plt.figure(figsize=(12, 8))
gs = gridspec.GridSpec(2, 3, figure=fig)

ax1 = fig.add_subplot(gs[0, :2])
ax2 = fig.add_subplot(gs[0, 2])
ax3 = fig.add_subplot(gs[1, :])

ax1.set_facecolor('#E6E6FA')
ax2.set_facecolor('#FFF0F5')
ax3.set_facecolor('#F0FFF0')

ax1.plot([1, 2, 3, 4], [1, 4, 2, 3], label='how2matplotlib.com')
ax2.scatter([1, 2, 3], [3, 1, 2], label='how2matplotlib.com')
ax3.bar([1, 2, 3], [2, 3, 1], label='how2matplotlib.com')

for ax in [ax1, ax2, ax3]:
    ax.legend()
    ax.set_title(f'Subplot {ax.get_geometry()[2]}')

plt.tight_layout()
plt.show()
这个例子展示了如何创建一个更复杂的多子图布局,并为每个子图设置不同的背景颜色。我们使用GridSpec来创建一个非均匀的子图布局,然后为每个子图设置不同的背景颜色和内容。这种方法允许我们创建更灵活和复杂的图表布局。
8. 动态背景颜色
有时,我们可能需要根据数据或其他条件动态设置背景颜色。以下是一些实现动态背景颜色的方法:
8.1 基于数据值设置背景颜色
import matplotlib.pyplot as plt
import numpy as np

def get_color(value):
    if value < 0:
        return '#FFE4E1'  # 浅红色
    elif value < 50:
        return '#E6E6FA'  # 浅紫色
    else:
        return '#F0FFF0'  # 蜜瓜色

data = [30, -10, 60, 40, -20, 80]
colors = [get_color(x) for x in data]

fig, ax = plt.subplots(figsize=(10, 6))

bars = ax.bar(range(len(data)), data, color=colors)

for i, (bar, color) in enumerate(zip(bars, colors)):
    ax.text(bar.get_x() + bar.get_width()/2, bar.get_height(),
            f'how2matplotlib.com\n{data[i]}', ha='center', va='bottom')

ax.set_title('Dynamic Background Color Based on Data')
ax.set_xlabel('Data Points')
ax.set_ylabel('Values')

plt.show()
Output:
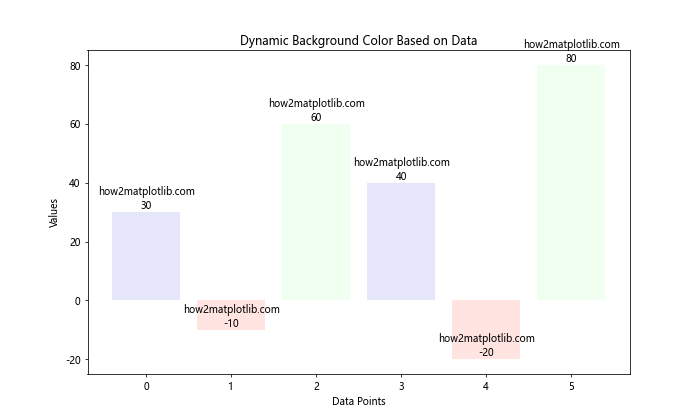
这个例子展示了如何根据数据值动态设置条形图的颜色。我们定义了一个get_color()函数,根据数值返回不同的颜色。这种方法可以直观地反映数据的不同范围或类别。
8.2 使用颜色映射动态设置背景
import matplotlib.pyplot as plt
import numpy as np

fig, ax = plt.subplots(figsize=(10, 6))

x = np.linspace(0, 10, 100)
y = np.sin(x)

points = ax.scatter(x, y, c=y, cmap='viridis', s=50)
fig.colorbar(points)

ax.set_facecolor('#F5F5F5')  # 设置浅灰色背景
ax.set_title('Dynamic Color Mapping Example')
ax.set_xlabel('X-axis')
ax.set_ylabel('Y-axis')

plt.text(5, 0.5, 'how2matplotlib.com', ha='center', va='center', fontsize=12)

plt.show()
Output:
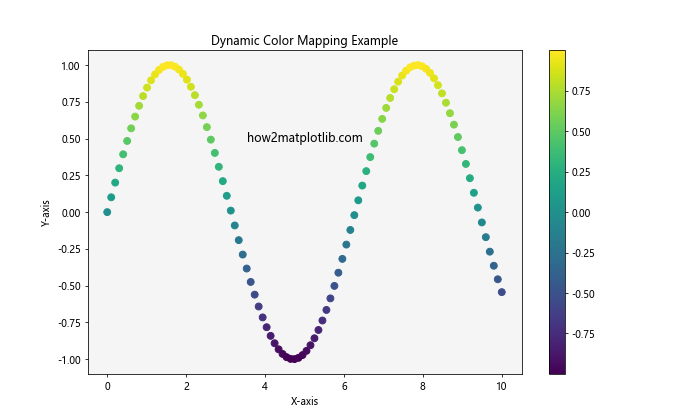
这个例子展示了如何使用颜色映射来动态设置散点图中点的颜色。我们使用scatter()函数的c参数来指定颜色映射的依据,并使用cmap参数选择颜色映射方案。这种方法可以有效地展示数据的第三个维度。
9. 背景颜色与数据可视化的最佳实践
选择合适的背景颜色不仅关乎美观,更重要的是要确保数据的清晰可读。以下是一些最佳实践:
9.1 对比度
确保背景颜色和数据颜色之间有足够的对比度。例如,在深色背景上使用浅色数据线,或者反之。
import matplotlib.pyplot as plt
import numpy as np

fig, (ax1, ax2) = plt.subplots(1, 2, figsize=(12, 5))

x = np.linspace(0, 10, 100)
y1 = np.sin(x)
y2 = np.cos(x)

# 深色背景,浅色线
ax1.set_facecolor('#1E1E1E')
ax1.plot(x, y1, color='#FF9999', label='Sin')
ax1.plot(x, y2, color='#99FF99', label='Cos')
ax1.set_title('Dark Background', color='white')
ax1.tick_params(colors='white')
ax1.legend()

# 浅色背景,深色线
ax2.set_facecolor('#F0F0F0')
ax2.plot(x, y1, color='#990000', label='Sin')
ax2.plot(x, y2, color='#009900', label='Cos')
ax2.set_title('Light Background')
ax2.legend()

for ax in [ax1, ax2]:
    ax.text(5, 0, 'how2matplotlib.com', ha='center', va='center', color='gray')

plt.tight_layout()
plt.show()
Output:
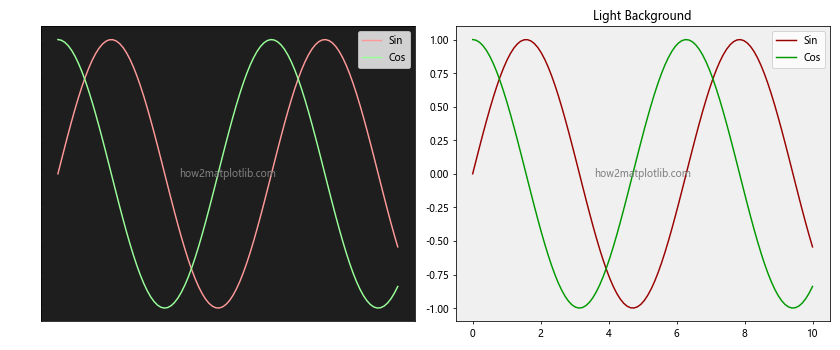
这个例子展示了如何在深色和浅色背景上分别使用浅色和深色线条,以确保良好的对比度和可读性。
9.2 色彩和谐
选择与数据颜色和整体设计相协调的背景颜色。避免使用过于鲜艳或分散注意力的背景颜色。
import matplotlib.pyplot as plt
import numpy as np

fig, ax = plt.subplots(figsize=(10, 6))

x = np.linspace(0, 10, 100)
y1 = np.sin(x)
y2 = np.cos(x)
y3 = np.tan(x)

ax.set_facecolor('#F0F8FF')  # 淡蓝色背景
ax.plot(x, y1, color='#4682B4', label='Sin')
ax.plot(x, y2, color='#20B2AA', label='Cos')
ax.plot(x, y3, color='#B0C4DE', label='Tan')

ax.set_title('Harmonious Color Scheme')
ax.legend()

plt.text(5, 0, 'how2matplotlib.com', ha='center', va='center', fontsize=12, color='gray')

plt.show()
Output:
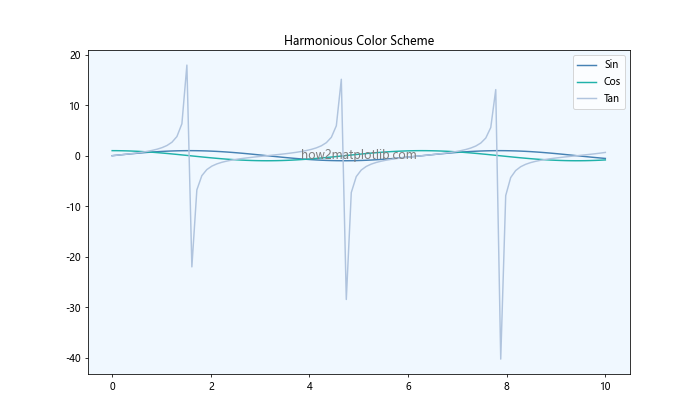
这个例子展示了如何选择和谐的颜色方案。背景色和数据线的颜色都在蓝色和绿色的范围内,创造出一种和谐的视觉效果。
9.3 简洁性
保持背景简单。复杂的背景图案可能会分散对数据的注意力。
import matplotlib.pyplot as plt
import numpy as np

fig, (ax1, ax2) = plt.subplots(1, 2, figsize=(12, 5))

x = np.linspace(0, 10, 100)
y = np.sin(x) * np.exp(-0.1 * x)

# 简单背景
ax1.set_facecolor('#F5F5F5')
ax1.plot(x, y, color='#4169E1')
ax1.set_title('Simple Background')

# 复杂背景(不推荐)
ax2.set_facecolor('#F5F5F5')
for i in range(50):
    ax2.axhline(y=i*0.04, color='lightgray', linestyle='--', linewidth=0.5)
    ax2.axvline(x=i*0.2, color='lightgray', linestyle='--', linewidth=0.5)
ax2.plot(x, y, color='#4169E1')
ax2.set_title('Complex Background (Not Recommended)')

for ax in [ax1, ax2]:
    ax.text(5, 0, 'how2matplotlib.com', ha='center', va='center', color='gray')

plt.tight_layout()
plt.show()
Output:
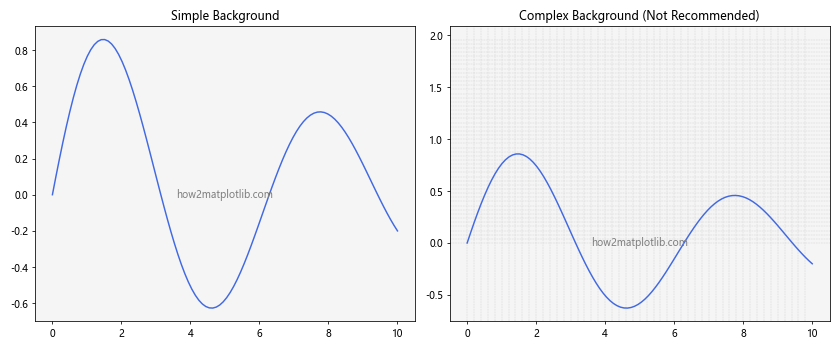
这个例子对比了简单背景和复杂背景。简单的背景更容易让观众关注数据本身,而复杂的背景可能会干扰数据的呈现。
10. 高级技巧和注意事项
10.1 使用alpha通道调整透明度
调整背景颜色的透明度可以创造出微妙的效果,同时不会过分干扰数据的展示。
import matplotlib.pyplot as plt
import numpy as np

fig, ax = plt.subplots(figsize=(10, 6))

x = np.linspace(0, 10, 100)
y1 = np.sin(x)
y2 = np.cos(x)

ax.plot(x, y1, label='Sin')
ax.plot(x, y2, label='Cos')

# 添加半透明背景
ax.add_patch(plt.Rectangle((0, 0), 1, 1, transform=ax.transAxes,
                           facecolor='yellow', alpha=0.2))

ax.set_title('Semi-transparent Background')
ax.legend()

plt.text(5, 0, 'how2matplotlib.com', ha='center', va='center', fontsize=12)

plt.show()
Output:
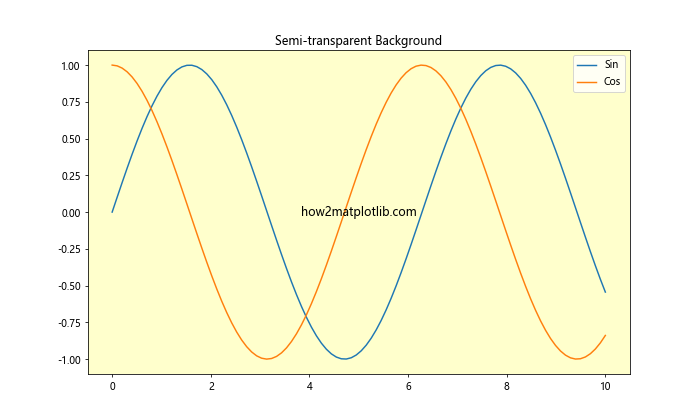
这个例子展示了如何添加一个半透明的背景。通过调整alpha值,我们可以控制背景的透明度,从而在不影响数据可读性的情况下增加视觉趣味。
10.2 考虑色盲友好的配色方案
在选择背景和数据颜色时,考虑色盲用户的需求是很重要的。
import matplotlib.pyplot as plt
import numpy as np

fig, ax = plt.subplots(figsize=(10, 6))

x = np.linspace(0, 10, 100)
y1 = np.sin(x)
y2 = np.cos(x)

ax.set_facecolor('#F0F0F0')  # 浅灰色背景
ax.plot(x, y1, color='#0072B2', label='Sin')  # 蓝色
ax.plot(x, y2, color='#D55E00', label='Cos')  # 橙色

ax.set_title('Color-blind Friendly Palette')
ax.legend()

plt.text(5, 0, 'how2matplotlib.com', ha='center', va='center', fontsize=12, color='gray')

plt.show()
Output:
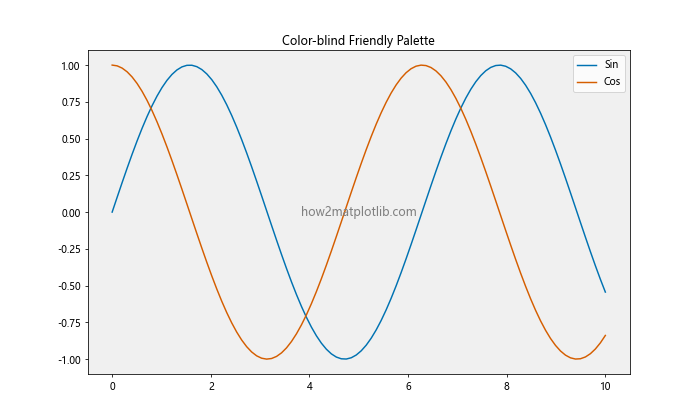
这个例子使用了一个色盲友好的配色方案。蓝色和橙色是大多数色盲人士都能区分的颜色对。
10.3 保存图片时的背景处理
在保存图片时,特别是使用透明背景时,需要注意文件格式的选择。
import matplotlib.pyplot as plt
import numpy as np

fig, ax = plt.subplots(figsize=(8, 6))

x = np.linspace(0, 10, 100)
y = np.sin(x)

ax.plot(x, y)
ax.set_facecolor('none')  # 透明背景
fig.patch.set_alpha(0.0)  # 确保Figure也是透明的

ax.set_title('Transparent Background for Saving')
plt.text(5, 0, 'how2matplotlib.com', ha='center', va='center', fontsize=12)

# 保存为PNG格式以保留透明度
plt.savefig('transparent_plot.png', transparent=True)
plt.show()
Output:
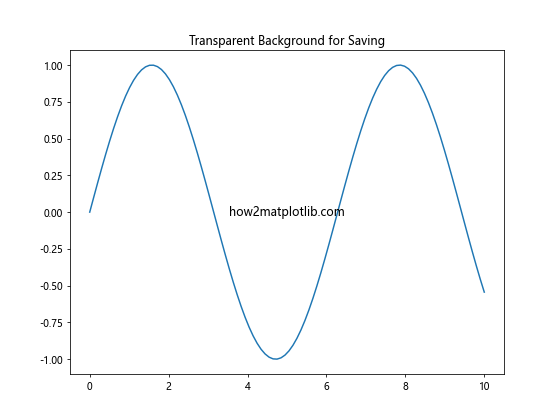
这个例子展示了如何创建一个带有透明背景的图表,并将其保存为PNG格式。使用transparent=True参数确保保存的图片保留透明背景。
结论
设置适当的背景颜色是创建有效和吸引人的数据可视化的重要一步。通过本文介绍的各种方法和技巧,你可以灵活地控制Matplotlib图表的背景颜色,从而增强数据的可读性和整体美观度。记住,背景颜色的选择应该始终服务于数据的清晰呈现这一主要目标。无论是选择简单的纯色背景,还是创建复杂的渐变或图案背景,都要确保它不会分散对数据本身的注意力。
通过实践和实验,你将能够找到最适合你的数据和目标受众的背景设置。不要忘记考虑对比度、色彩和谐以及可访问性等因素。随着经验的积累,你将能够创建既美观又有效的数据可视化,让你的数据故事更具说服力和吸引力。
最后,Matplotlib的灵活性意味着还有许多其他创新的方法来处理背景颜色和样式。继续探索和实验,你可能会发现更多独特和有效的方法来增强你的数据可视化。记住,最好的可视化是那些既能准确传达数据信息,又能吸引观众注意力的作品。
 极客教程
极客教程