Matplotlib中如何将图例放置在绘图区域外部
参考:How to Place Legend Outside of the Plot in Matplotlib
Matplotlib是Python中最流行的数据可视化库之一,它提供了丰富的绘图功能和灵活的自定义选项。在数据可视化中,图例(Legend)是一个重要的组成部分,它帮助读者理解图表中不同元素的含义。有时,为了保持绘图区域的整洁和可读性,我们需要将图例放置在绘图区域的外部。本文将详细介绍如何在Matplotlib中实现这一目标,并提供多个实用的示例代码。
1. 图例的基本概念
在深入探讨如何将图例放置在绘图区域外部之前,我们先来了解一下图例的基本概念。
图例是一个用于解释图表中各种元素含义的小框,通常包含了线条、标记和颜色等信息。在Matplotlib中,我们可以使用legend()方法来添加图例。
以下是一个简单的示例,展示了如何创建一个包含图例的基本折线图:
import matplotlib.pyplot as plt

# 创建数据
x = [1, 2, 3, 4, 5]
y1 = [2, 4, 6, 8, 10]
y2 = [1, 3, 5, 7, 9]

# 创建图表
plt.figure(figsize=(8, 6))
plt.plot(x, y1, label='Line 1')
plt.plot(x, y2, label='Line 2')

# 添加图例
plt.legend()

# 添加标题
plt.title('Basic Plot with Legend - how2matplotlib.com')

# 显示图表
plt.show()
Output:
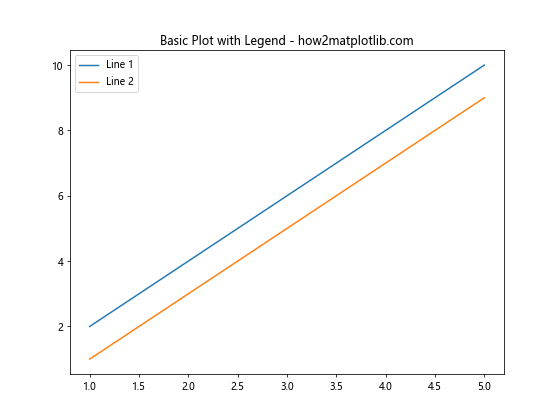
在这个示例中,我们创建了两条线,并为每条线设置了标签。通过调用plt.legend(),Matplotlib会自动创建一个包含这些标签的图例。
2. 将图例放置在绘图区域外部的方法
现在,让我们探讨几种将图例放置在绘图区域外部的方法。
2.1 使用bbox_to_anchor参数
bbox_to_anchor参数是控制图例位置的最灵活的方法之一。它允许我们精确地指定图例的位置。
以下是一个将图例放置在绘图区域右侧的示例:
import matplotlib.pyplot as plt

# 创建数据
x = [1, 2, 3, 4, 5]
y1 = [2, 4, 6, 8, 10]
y2 = [1, 3, 5, 7, 9]

# 创建图表
fig, ax = plt.subplots(figsize=(10, 6))
ax.plot(x, y1, label='Line 1')
ax.plot(x, y2, label='Line 2')

# 将图例放置在绘图区域外部
ax.legend(bbox_to_anchor=(1.05, 1), loc='upper left')

# 调整布局
plt.tight_layout()

# 添加标题
plt.title('Legend Outside Plot - how2matplotlib.com')

# 显示图表
plt.show()
Output:
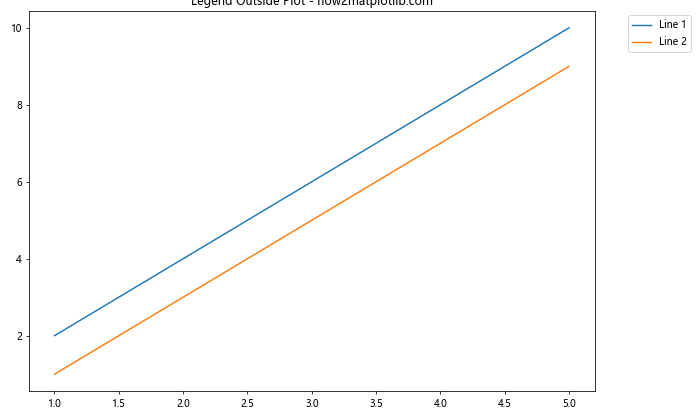
在这个示例中,我们使用bbox_to_anchor=(1.05, 1)将图例放置在绘图区域的右上角外部。loc='upper left'参数指定了图例的对齐方式。
2.2 使用fig.legend()方法
另一种将图例放置在绘图区域外部的方法是使用fig.legend()而不是ax.legend()。这允许我们将图例放置在整个图形的任何位置。
以下是一个示例:
import matplotlib.pyplot as plt

# 创建数据
x = [1, 2, 3, 4, 5]
y1 = [2, 4, 6, 8, 10]
y2 = [1, 3, 5, 7, 9]

# 创建图表
fig, ax = plt.subplots(figsize=(10, 6))
ax.plot(x, y1, label='Line 1')
ax.plot(x, y2, label='Line 2')

# 将图例放置在图形的底部中央
fig.legend(loc='lower center', bbox_to_anchor=(0.5, -0.1), ncol=2)

# 调整布局
plt.tight_layout()

# 添加标题
plt.title('Legend at Bottom - how2matplotlib.com')

# 显示图表
plt.show()
Output:
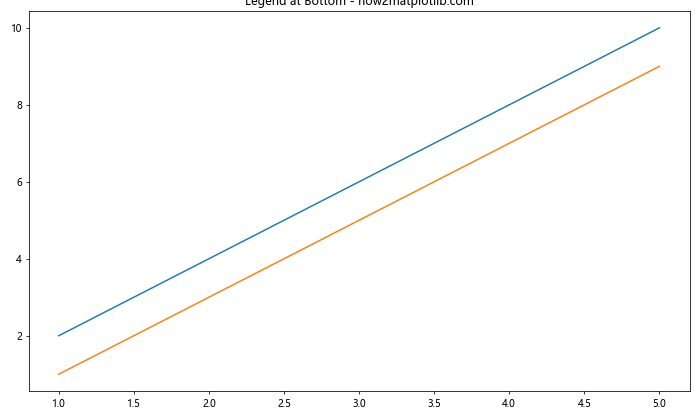
在这个示例中,我们使用fig.legend()将图例放置在整个图形的底部中央。ncol=2参数使图例以两列的形式显示。
2.3 使用constrained_layout
constrained_layout是Matplotlib中的一个自动布局管理器,它可以帮助我们更好地处理图例的位置。
以下是一个使用constrained_layout的示例:
import matplotlib.pyplot as plt

# 创建数据
x = [1, 2, 3, 4, 5]
y1 = [2, 4, 6, 8, 10]
y2 = [1, 3, 5, 7, 9]

# 创建图表,启用constrained_layout
fig, ax = plt.subplots(figsize=(10, 6), constrained_layout=True)
ax.plot(x, y1, label='Line 1')
ax.plot(x, y2, label='Line 2')

# 将图例放置在绘图区域外部
ax.legend(bbox_to_anchor=(1.05, 1), loc='upper left')

# 添加标题
plt.title('Legend with Constrained Layout - how2matplotlib.com')

# 显示图表
plt.show()
Output:
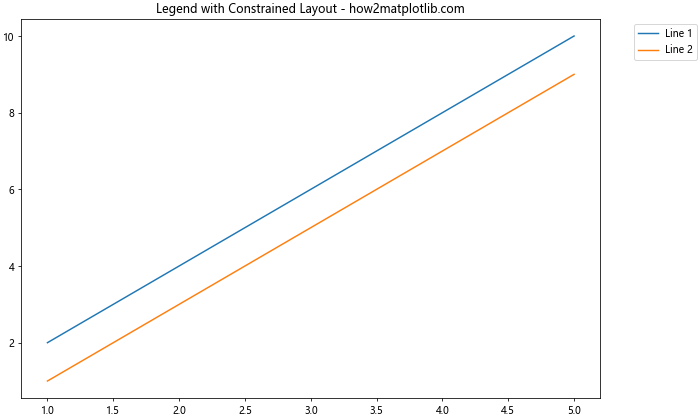
在这个示例中,我们在创建图表时启用了constrained_layout。这会自动调整图表的布局,以适应图例的位置。
3. 自定义图例的样式
除了位置,我们还可以自定义图例的样式,使其更加美观和易读。
3.1 更改图例的字体大小和样式
我们可以通过fontsize和fontweight参数来调整图例的字体大小和粗细:
import matplotlib.pyplot as plt

# 创建数据
x = [1, 2, 3, 4, 5]
y1 = [2, 4, 6, 8, 10]
y2 = [1, 3, 5, 7, 9]

# 创建图表
fig, ax = plt.subplots(figsize=(10, 6))
ax.plot(x, y1, label='Line 1')
ax.plot(x, y2, label='Line 2')

# 自定义图例样式
ax.legend(bbox_to_anchor=(1.05, 1), loc='upper left', fontsize=12, fontweight='bold')

# 调整布局
plt.tight_layout()

# 添加标题
plt.title('Custom Legend Style - how2matplotlib.com')

# 显示图表
plt.show()
在这个示例中,我们将图例的字体大小设置为12,并将字体粗细设置为粗体。
3.2 更改图例的背景色和边框
我们可以通过facecolor和edgecolor参数来更改图例的背景色和边框颜色:
import matplotlib.pyplot as plt

# 创建数据
x = [1, 2, 3, 4, 5]
y1 = [2, 4, 6, 8, 10]
y2 = [1, 3, 5, 7, 9]

# 创建图表
fig, ax = plt.subplots(figsize=(10, 6))
ax.plot(x, y1, label='Line 1')
ax.plot(x, y2, label='Line 2')

# 自定义图例样式
ax.legend(bbox_to_anchor=(1.05, 1), loc='upper left',
          facecolor='lightgray', edgecolor='black')

# 调整布局
plt.tight_layout()

# 添加标题
plt.title('Custom Legend Background - how2matplotlib.com')

# 显示图表
plt.show()
Output:
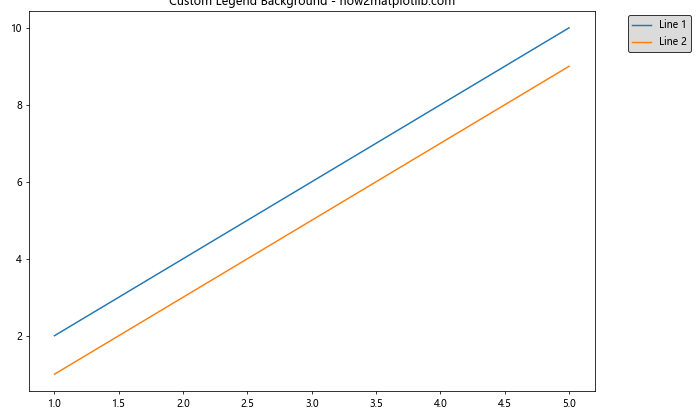
在这个示例中,我们将图例的背景色设置为浅灰色,边框颜色设置为黑色。
3.3 添加阴影效果
我们可以通过shadow参数为图例添加阴影效果:
import matplotlib.pyplot as plt

# 创建数据
x = [1, 2, 3, 4, 5]
y1 = [2, 4, 6, 8, 10]
y2 = [1, 3, 5, 7, 9]

# 创建图表
fig, ax = plt.subplots(figsize=(10, 6))
ax.plot(x, y1, label='Line 1')
ax.plot(x, y2, label='Line 2')

# 添加带阴影的图例
ax.legend(bbox_to_anchor=(1.05, 1), loc='upper left', shadow=True)

# 调整布局
plt.tight_layout()

# 添加标题
plt.title('Legend with Shadow - how2matplotlib.com')

# 显示图表
plt.show()
Output:
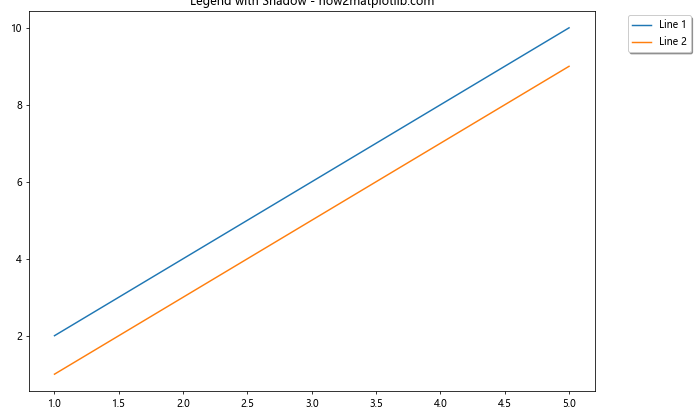
在这个示例中,我们通过设置shadow=True为图例添加了阴影效果。
4. 处理多个子图的图例
当我们有多个子图时,处理图例可能会变得更加复杂。以下是一些处理多个子图图例的方法。
4.1 为每个子图添加单独的图例
我们可以为每个子图添加单独的图例:
import matplotlib.pyplot as plt

# 创建数据
x = [1, 2, 3, 4, 5]
y1 = [2, 4, 6, 8, 10]
y2 = [1, 3, 5, 7, 9]

# 创建包含两个子图的图表
fig, (ax1, ax2) = plt.subplots(1, 2, figsize=(12, 5))

# 第一个子图
ax1.plot(x, y1, label='Line 1')
ax1.plot(x, y2, label='Line 2')
ax1.legend(bbox_to_anchor=(1.05, 1), loc='upper left')
ax1.set_title('Subplot 1 - how2matplotlib.com')

# 第二个子图
ax2.plot(x, y2, label='Line 3')
ax2.plot(x, y1, label='Line 4')
ax2.legend(bbox_to_anchor=(1.05, 1), loc='upper left')
ax2.set_title('Subplot 2 - how2matplotlib.com')

# 调整布局
plt.tight_layout()

# 显示图表
plt.show()
Output:
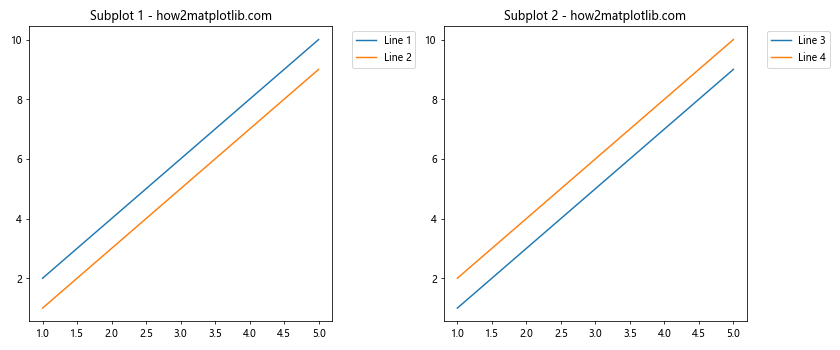
在这个示例中,我们创建了两个子图,并为每个子图添加了单独的图例。
4.2 创建一个共享的图例
有时,我们可能希望为多个子图创建一个共享的图例:
import matplotlib.pyplot as plt

# 创建数据
x = [1, 2, 3, 4, 5]
y1 = [2, 4, 6, 8, 10]
y2 = [1, 3, 5, 7, 9]

# 创建包含两个子图的图表
fig, (ax1, ax2) = plt.subplots(1, 2, figsize=(12, 5))

# 第一个子图
line1, = ax1.plot(x, y1, label='Line 1')
line2, = ax1.plot(x, y2, label='Line 2')
ax1.set_title('Subplot 1 - how2matplotlib.com')

# 第二个子图
line3, = ax2.plot(x, y2, label='Line 3')
line4, = ax2.plot(x, y1, label='Line 4')
ax2.set_title('Subplot 2 - how2matplotlib.com')

# 创建共享的图例
fig.legend([line1, line2, line3, line4], ['Line 1', 'Line 2', 'Line 3', 'Line 4'],
           loc='lower center', bbox_to_anchor=(0.5, -0.1), ncol=4)

# 调整布局
plt.tight_layout()

# 显示图表
plt.show()
Output:
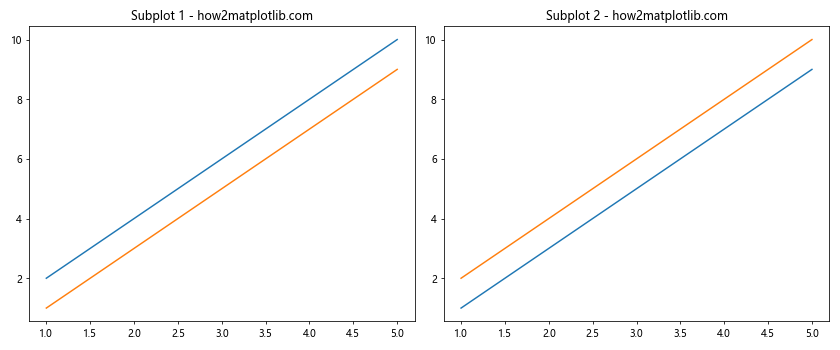
在这个示例中,我们使用fig.legend()创建了一个共享的图例,并将其放置在整个图形的底部。
5. 处理复杂图表的图例
对于更复杂的图表,如包含多种类型的绘图元素(如线条、散点、条形等),我们可能需要更高级的图例处理技巧。
5.1 创建包含多种绘图元素的图例
以下是一个包含线条、散点和条形的复杂图表示例:
import matplotlib.pyplot as plt
import numpy as np

# 创建数据
x = np.arange(1, 6)
y1 = [2, 4, 6, 8, 10]
y2 = [1, 3, 5, 7, 9]
y3 = [5, 4, 3, 2, 1]

# 创建图表
fig, ax = plt.subplots(figsize=(10, 6))

# 绘制线条
line, = ax.plot(x, y1, label='Line')

# 绘制散点
scatter = ax.scatter(x, y2, label='Scatter')

# 绘制条形
bars = ax.bar(x, y3, label='Bar')

# 创建图例
ax.legend(handles=[line, scatter, bars], bbox_to_anchor=(1.05, 1), loc='upper left')

# 调整布局
plt.tight_layout()

# 添加标题
plt.title('Complex Plot with Multiple Elements - how2matplotlib.com')

# 显示图表
plt.show()
Output:
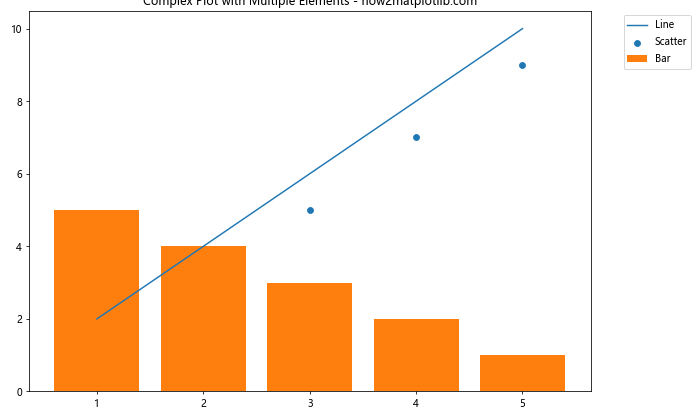
在这个示例中,我们创建了一个包含线条、散点和条形的复杂图表,并为这些不同类型的绘图元素创建了一个统一的图例。
5.2 使用自定义图例句柄
有时,我们可能需要创建自定义的图例句柄,以更好地表示复杂的图表元素:
import matplotlib.pyplot as plt
import matplotlib.patches as mpatches

# 创建数据
x = [1, 2, 3, 4, 5]
y1 = [2, 4, 6, 8, 10]
y2 = [1, 3, 5, 7, 9]

# 创建图表
fig, ax = plt.subplots(figsize=(10, 6))
ax.plot(x, y1, 'r-')
ax.plot(x, y2, 'b--')

# 创建自定义图例句柄
red_line = mpatches.Patch(color='red', label='Red Line')
blue_dash = mpatches.Patch(color='blue', label='Blue Dashed')

# 添加自定义图例
ax.legend(handles=[red_line, blue_dash], bbox_to_anchor=(1.05, 1), loc='upper left')

# 调整布局
plt.tight_layout()

# 添加标题
plt.title('Custom Legend Handles - how2matplotlib.com')

# 显示图表
plt.show()
Output:
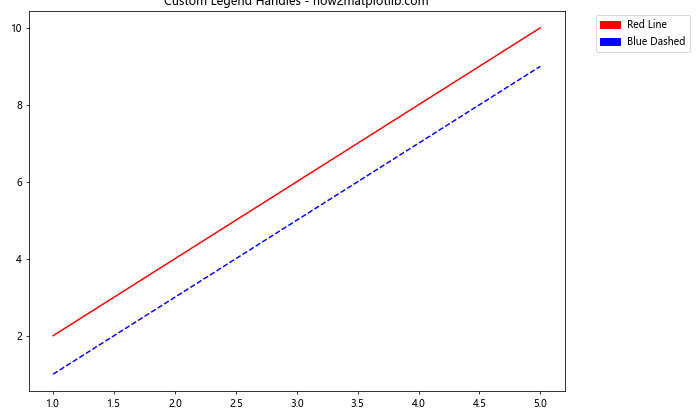
在这个示例中,我们使用matplotlib.patches.Patch创建了自定义的图例句柄,以更好地表示不同类型的线条。
6. 图例的交互性
Matplotlib还提供了一些交互性功能,可以让用户通过图例来控制图表的显示。
6.1 可点击的图例
我们可以创建可点击的图例,允许用户通过点击图例来切换相应数据的显示状态:
import matplotlib.pyplot as plt

# 创建数据
x = [1, 2, 3, 4, 5]
y1 = [2, 4, 6, 8, 10]
y2 = [1, 3, 5, 7, 9]

# 创建图表
fig, ax = plt.subplots(figsize=(10, 6))
line1, = ax.plot(x, y1, label='Line 1')
line2, = ax.plot(x, y2, label='Line 2')

# 创建可点击的图例
leg = ax.legend(bbox_to_anchor=(1.05, 1), loc='upper left')

# 添加点击事件
lined = {}  # 用于存储线条对象
for legline, origline in zip(leg.get_lines(), [line1, line2]):
    legline.set_picker(5)  # 5 pts tolerance
    lined[legline] = origline

def onpick(event):
    # 点击图例时触发
    legline = event.artist
    origline = lined[legline]
    vis = not origline.get_visible()
    origline.set_visible(vis)
    # 更改图例中线条的透明度
    if vis:
        legline.set_alpha(1.0)
    else:
        legline.set_alpha(0.2)
    fig.canvas.draw()

fig.canvas.mpl_connect('pick_event', onpick)

# 调整布局
plt.tight_layout()

# 添加标题
plt.title('Clickable Legend - how2matplotlib.com')

# 显示图表
plt.show()
Output:
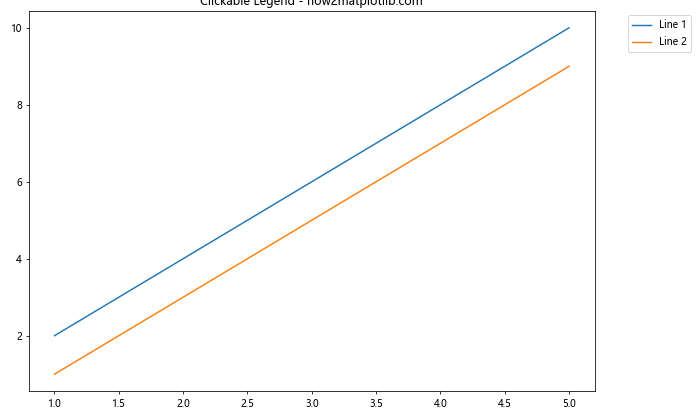
在这个示例中,我们创建了一个可点击的图例。用户可以通过点击图例中的项目来切换相应数据线的显示状态。
7. 处理大量图例项
当图表中包含大量需要在图例中显示的项目时,我们需要采取一些特殊的处理方法。
7.1 使用多列图例
对于大量的图例项,我们可以使用多列布局来节省空间:
import matplotlib.pyplot as plt
import numpy as np

# 创建大量数据
x = np.arange(0, 10, 0.1)
fig, ax = plt.subplots(figsize=(12, 8))

# 绘制多条线并添加到图例
for i in range(15):
    ax.plot(x, np.sin(x + i*0.5), label=f'Line {i+1}')

# 创建多列图例
ax.legend(bbox_to_anchor=(1.05, 1), loc='upper left', ncol=3)

# 调整布局
plt.tight_layout()

# 添加标题
plt.title('Multi-column Legend - how2matplotlib.com')

# 显示图表
plt.show()
Output:
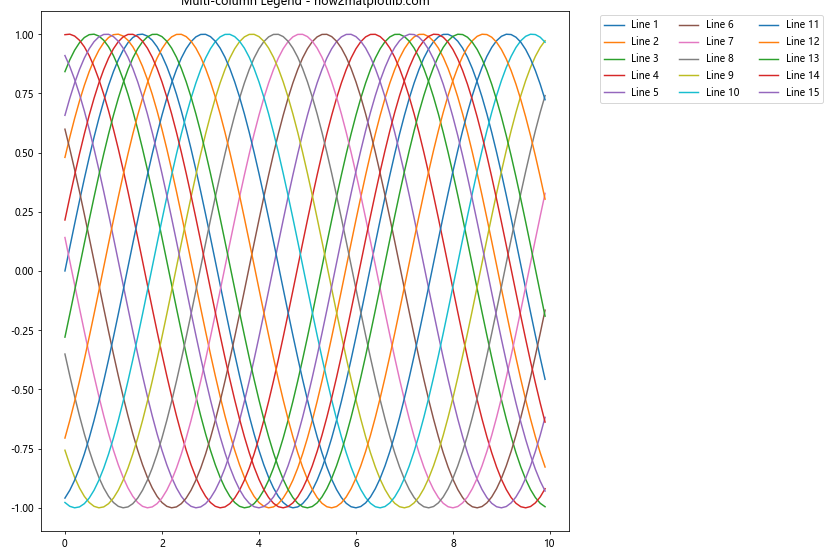
在这个示例中,我们创建了15条线,并使用ncol=3参数将图例分为3列显示。
7.2 使用图例分组
对于非常多的图例项,我们可以考虑将它们分组:
import matplotlib.pyplot as plt
import numpy as np

# 创建大量数据
x = np.arange(0, 10, 0.1)
fig, ax = plt.subplots(figsize=(12, 8))

# 绘制多条线并添加到图例
lines = []
labels = []
for i in range(20):
    line, = ax.plot(x, np.sin(x + i*0.5))
    lines.append(line)
    labels.append(f'Line {i+1}')

# 创建分组图例
group1 = plt.legend(lines[:10], labels[:10], loc='upper left', bbox_to_anchor=(1.05, 1), title='Group 1')
ax.add_artist(group1)
ax.legend(lines[10:], labels[10:], loc='lower left', bbox_to_anchor=(1.05, 0), title='Group 2')

# 调整布局
plt.tight_layout()

# 添加标题
plt.title('Grouped Legend - how2matplotlib.com')

# 显示图表
plt.show()
Output:
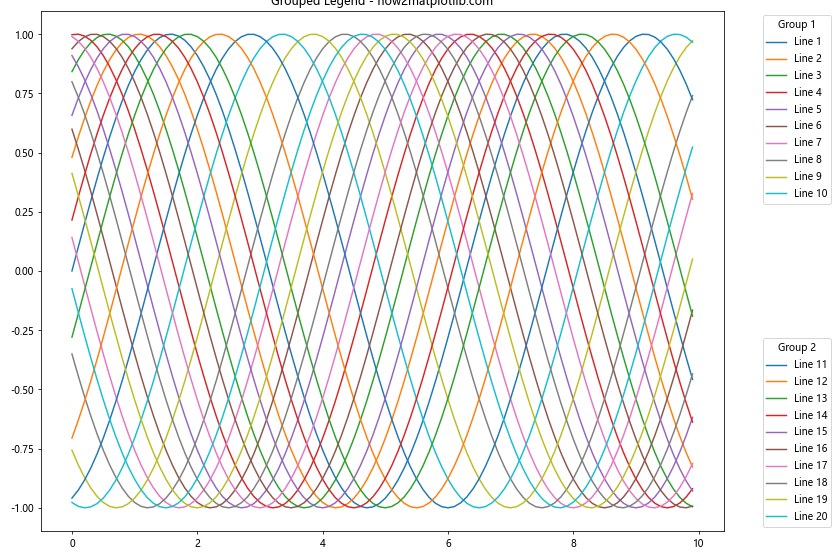
在这个示例中,我们将20个图例项分成了两组,分别放置在图表的右上角和右下角。
8. 图例的高级样式设置
除了基本的样式设置,Matplotlib还提供了一些高级的样式设置选项,可以让我们的图例更加美观和专业。
8.1 使用自定义字体
我们可以为图例设置自定义字体:
import matplotlib.pyplot as plt
from matplotlib import font_manager

# 创建数据
x = [1, 2, 3, 4, 5]
y1 = [2, 4, 6, 8, 10]
y2 = [1, 3, 5, 7, 9]

# 创建图表
fig, ax = plt.subplots(figsize=(10, 6))
ax.plot(x, y1, label='Line 1')
ax.plot(x, y2, label='Line 2')

# 设置自定义字体
font_path = '/path/to/your/font.ttf'  # 替换为你的字体文件路径
prop = font_manager.FontProperties(fname=font_path)

# 添加使用自定义字体的图例
ax.legend(bbox_to_anchor=(1.05, 1), loc='upper left', prop=prop)

# 调整布局
plt.tight_layout()

# 添加标题
plt.title('Legend with Custom Font - how2matplotlib.com')

# 显示图表
plt.show()
在这个示例中,我们使用font_manager.FontProperties来设置自定义字体。请确保将font_path替换为你实际的字体文件路径。
8.2 使用圆角边框
我们可以为图例添加圆角边框,使其看起来更加现代化:
import matplotlib.pyplot as plt
from matplotlib.patches import FancyBboxPatch

# 创建数据
x = [1, 2, 3, 4, 5]
y1 = [2, 4, 6, 8, 10]
y2 = [1, 3, 5, 7, 9]

# 创建图表
fig, ax = plt.subplots(figsize=(10, 6))
ax.plot(x, y1, label='Line 1')
ax.plot(x, y2, label='Line 2')

# 添加图例
legend = ax.legend(bbox_to_anchor=(1.05, 1), loc='upper left')

# 为图例添加圆角边框
frame = legend.get_frame()
frame.set_facecolor('white')
frame.set_edgecolor('gray')
frame.set_boxstyle("round,pad=0.1")

# 调整布局
plt.tight_layout()

# 添加标题
plt.title('Legend with Rounded Corners - how2matplotlib.com')

# 显示图表
plt.show()
Output:
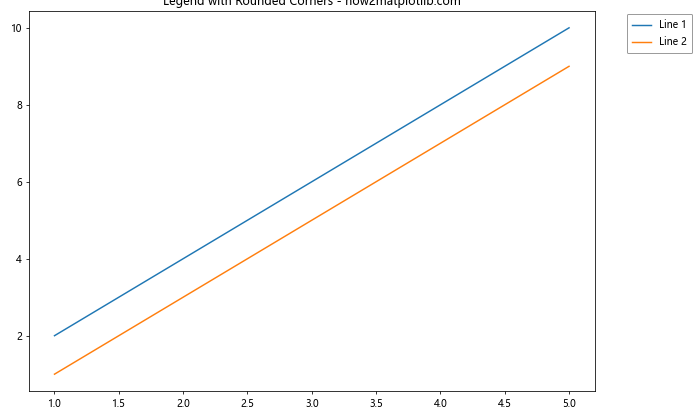
在这个示例中,我们使用FancyBboxPatch为图例添加了圆角边框。
9. 图例的动态更新
在一些交互式应用中,我们可能需要动态更新图例的内容。
9.1 动态添加图例项
以下是一个动态添加图例项的示例:
import matplotlib.pyplot as plt
import numpy as np

# 创建图表
fig, ax = plt.subplots(figsize=(10, 6))

# 初始化空图例
legend_elements = []

# 动态添加图例项的函数
def add_legend_item(label, color):
    line, = ax.plot(np.random.rand(10), color=color, label=label)
    legend_elements.append(line)
    ax.legend(handles=legend_elements, bbox_to_anchor=(1.05, 1), loc='upper left')
    plt.draw()

# 添加初始图例项
add_legend_item('Line 1', 'red')
add_legend_item('Line 2', 'blue')

# 模拟动态添加新的图例项
plt.pause(2)
add_legend_item('Line 3', 'green')
plt.pause(2)
add_legend_item('Line 4', 'orange')

# 添加标题
plt.title('Dynamic Legend Update - how2matplotlib.com')

# 调整布局
plt.tight_layout()

# 显示图表
plt.show()
Output:
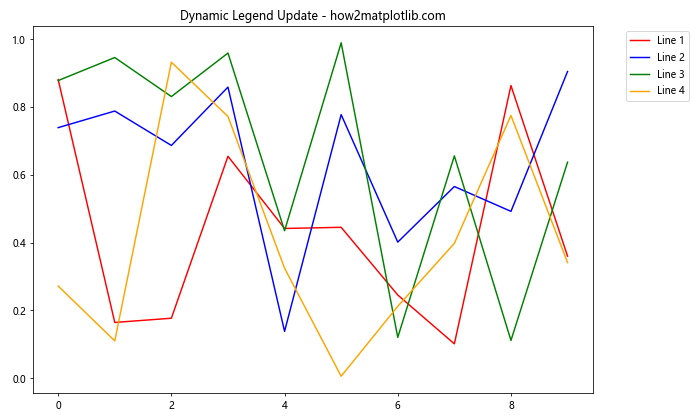
在这个示例中,我们创建了一个add_legend_item函数,它可以动态地向图表添加新的线条和相应的图例项。
10. 总结
将图例放置在绘图区域外部是提高图表可读性和美观度的有效方法。通过本文介绍的各种技巧和方法,你可以灵活地控制图例的位置、样式和内容,以适应不同的数据可视化需求。
关键点总结:
1. 使用bbox_to_anchor和loc参数可以精确控制图例的位置。
2. fig.legend()方法允许在整个图形上放置图例,特别适用于多子图的情况。
3. constrained_layout可以帮助自动调整布局以适应图例。
4. 可以通过各种参数自定义图例的样式,包括字体、颜色、阴影等。
5. 对于复杂的图表,可以使用自定义图例句柄或分组图例。
6. 可以创建交互式的可点击图例,增加图表的交互性。
7. 对于大量图例项,可以使用多列布局或分组方式。
8. 高级样式设置如自定义字体和圆角边框可以进一步提升图例的视觉效果。
9. 在需要的情况下,可以实现图例的动态更新。
通过掌握这些技巧,你将能够创建出既信息丰富又视觉吸引的数据可视化图表。记住,图例的设计应该始终服务于数据的清晰呈现和有效传达。根据具体的数据和目标受众,灵活运用这些方法,以达到最佳的可视化效果。
 极客教程
极客教程