如何在matplotlib中为散点图的每个点添加标签
参考:how to label each point in scatter plot matplotlib
在数据可视化中,散点图是一种常用的图表类型,用于展示两个变量之间的关系。有时候我们希望在散点图中标记每个点的具体数值或者标签,以便更清晰地表达数据。在matplotlib中,我们可以通过一些方法来实现为散点图中的每个点添加标签。本文将介绍如何使用matplotlib为散点图的每个点添加标签。
方法一:使用annotate方法
annotate方法可以在图中的特定位置添加带箭头的注释。我们可以利用这个方法在散点图的每个点周围添加标签。下面是一个示例代码:
import matplotlib.pyplot as plt

# 生成示例数据
x = [1, 2, 3, 4, 5]
y = [2, 3, 5, 7, 6]
labels = ['A', 'B', 'C', 'D', 'E']

plt.scatter(x, y)

for i, label in enumerate(labels):
    plt.annotate(label, (x[i], y[i]), textcoords="offset points", xytext=(0,10), ha='center')

plt.show()
Output:
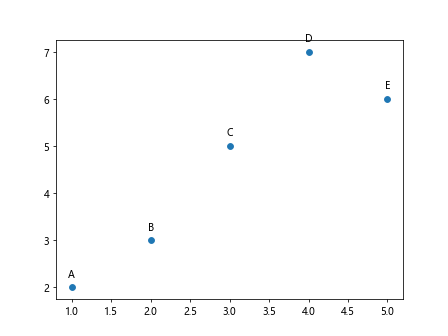
在这段代码中,我们先生成了一组示例数据x和y,以及一组对应的标签labels。然后使用scatter方法绘制散点图,并利用for循环和annotate方法在每个点周围添加标签。
方法二:使用text方法
除了annotate方法,我们还可以使用text方法在图中添加文本。下面是一个示例代码:
import matplotlib.pyplot as plt

# 生成示例数据
x = [1, 2, 3, 4, 5]
y = [2, 3, 5, 7, 6]
labels = ['A', 'B', 'C', 'D', 'E']

plt.scatter(x, y)

for i, label in enumerate(labels):
    plt.text(x[i], y[i], label, ha='center')

plt.show()
Output:
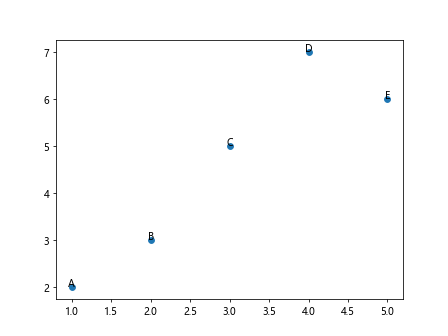
这段代码中,我们同样先生成了示例数据,然后使用scatter方法绘制散点图。接着利用for循环和text方法在每个点的位置添加标签。
方法三:使用annotate和arrowprops方法
如果想要为标签添加箭头指向对应的散点,可以使用annotate方法的arrowprops参数。下面是一个示例代码:
import matplotlib.pyplot as plt

# 生成示例数据
x = [1, 2, 3, 4, 5]
y = [2, 3, 5, 7, 6]
labels = ['A', 'B', 'C', 'D', 'E']

plt.scatter(x, y)

for i, label in enumerate(labels):
    plt.annotate(label, (x[i], y[i]), textcoords="offset points", xytext=(0,10), ha='center', arrowprops=dict(arrowstyle='->'))

plt.show()
Output:
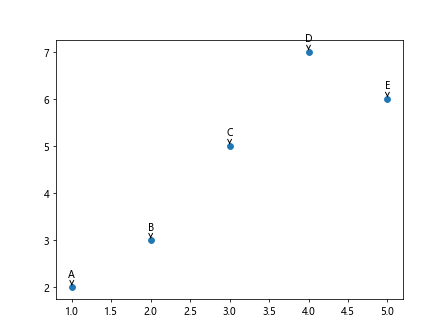
在这段代码中,我们在annotate方法中添加了arrowprops参数,并指定了箭头的样式,这样就可以在标签和对应的散点之间添加箭头。
方法四:使用for循环按照一定规律添加标签
有时候我们可能希望按照一定的规律为散点图添加标签,比如每隔几个点添加一个标签。下面是一个示例代码:
import matplotlib.pyplot as plt

# 生成示例数据
x = [1, 2, 3, 4, 5, 6, 7, 8, 9, 10]
y = [2, 3, 5, 7, 6, 4, 8, 9, 10, 12]
labels = ['A', 'B', 'C', 'D', 'E']

plt.scatter(x, y)

for i in range(0, len(x), 2):
    plt.text(x[i], y[i], labels[i%len(labels)], ha='center')

plt.show()
Output:
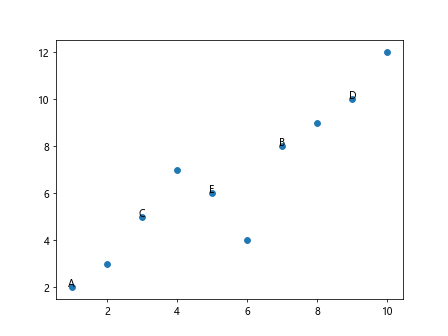
在这段代码中,我们使用range函数生成了一个按照一定规律递增的序列,然后在循环中根据规律添加标签。
方法五:使用pandas的DataFrame添加标签
如果数据是以pandas的DataFrame形式存在,我们也可以利用DataFrame的iterrows方法来遍历每一行数据并为散点图添加标签。下面是一个示例代码:
import matplotlib.pyplot as plt
import pandas as pd

# 生成示例数据
data = {'x': [1, 2, 3, 4, 5],
        'y': [2, 3, 5, 7, 6],
        'labels': ['A', 'B', 'C', 'D', 'E']}
df = pd.DataFrame(data)

plt.scatter(df['x'], df['y'])

for index, row in df.iterrows():
    plt.text(row['x'], row['y'], row['labels'], ha='center')

plt.show()
Output:
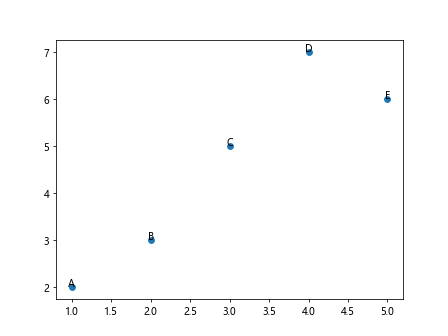
这段代码中,我们先将数据存储在一个DataFrame中,然后使用iterrows方法遍历每一行数据,并在循环中为散点图添加标签。
方法六:使用颜色标签区分不同类别
有时候我们可能希望以不同的颜色标签来区分散点图中的不同类别。下面是一个示例代码:
import matplotlib.pyplot as plt

# 生成示例数据
x1 = [1, 2, 3, 4, 5]
y1 = [2, 3, 5, 7, 6]
x2 = [2, 3, 4, 5, 6]
y2 = [3, 4, 6, 8, 7]

plt.scatter(x1, y1, c='blue', label='Group 1')
plt.scatter(x2, y2, c='red', label='Group 2')

plt.legend()

plt.show()
Output:
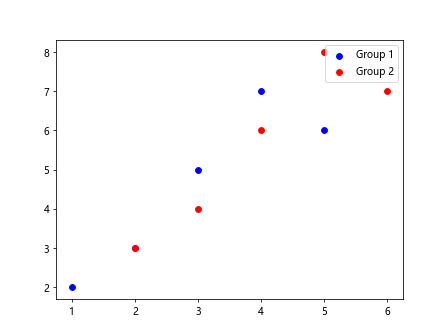
在这段代码中,我们生成了两组示例数据,并分别使用不同颜色的散点图表示。通过label参数和legend方法可以在图中添加颜色标签,从而清晰地区分不同类别。
方法七:使用多个子图同时展示不同类别
除了将不同类别的散点图叠加在一起表示之外,我们也可以使用多个子图同时展示不同类别。下面是一个示例代码:
import matplotlib.pyplot as plt

# 生成示例数据
x1 = [1, 2, 3, 4, 5]
y1 = [2, 3, 5, 7, 6]
x2 = [2, 3, 4, 5, 6]
y2 = [3, 4, 6, 8, 7]

fig, axs = plt.subplots(1, 2)
axs[0].scatter(x1, y1, c='blue')
axs[0].set_title('Group 1')

axs[1].scatter(x2, y2, c='red')
axs[1].set_title('Group 2')

plt.show()
Output:
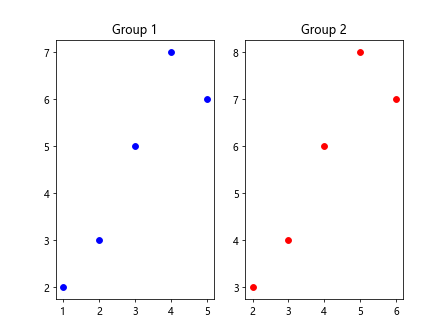
这段代码中,我们使用subplots方法创建了1行2列的子图,然后分别在子图中绘制了不同类别的散点图,并在每个子图的标题上添加了相应的标签。
方法八:使用不同形状标记不同类别
除了颜色标签之外,我们还可以使用不同形状的散点标记来区分不同类别。下面是一个示例代码:
import matplotlib.pyplot as plt

# 生成示例数据
x1 = [1, 2, 3, 4, 5]
y1 = [2, 3, 5, 7, 6]
x2 = [2, 3, 4, 5, 6]
y2 = [3, 4, 6, 8, 7]

plt.scatter(x1, y1, marker='o', label='Group 1')
plt.scatter(x2, y2, marker='x', label='Group 2')

plt.legend()

plt.show()
Output:
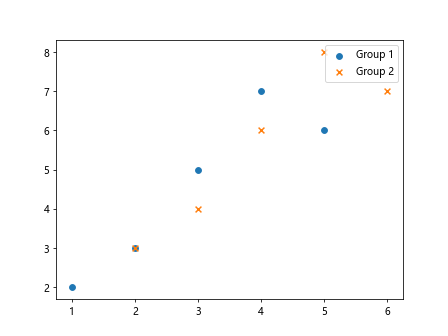
在这段代码中,我们分别使用了圆形(o)和叉形(x)的标记来表示不同类别的散点图,并通过label参数和legend方法添加对应的标签。
方法九:使用不同大小标记不同类别
除了颜色和形状之外,我们还可以利用散点的大小来区分不同类别。下面是一个示例代码:
import matplotlib.pyplot as plt

# 生成示例数据
x1 = [1, 2, 3, 4, 5]
y1 = [2, 3, 5, 7, 6]
x2 = [2, 3, 4, 5, 6]
y2 = [3, 4, 6, 8, 7]
sizes1 = [100, 150, 200, 250, 300]
sizes2 = [50, 100, 150, 200, 250]

plt.scatter(x1, y1, s=sizes1, label='Group 1')
plt.scatter(x2, y2, s=sizes2, label='Group 2')

plt.legend()

plt.show()
Output:
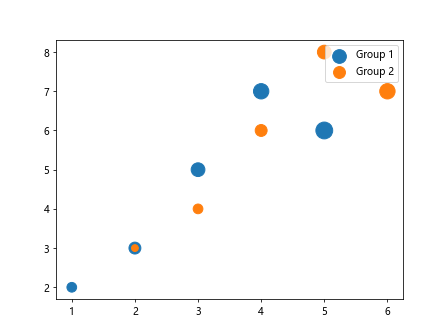
这段代码中,我们分别指定了不同类别散点的大小,并通过s参数来表示。通过设置不同大小的散点可以更直观地区分不同类别。
方法十:使用透明度标记不同类别
除了颜色、形状和大小之外,我们还可以利用透明度来区分不同类别的散点图。下面是一个示例代码:
import matplotlib.pyplot as plt

# 生成示例数据
x1 = [1, 2, 3, 4, 5]
y1 = [2, 3, 5, 7, 6]
x2 = [2, 3, 4, 5, 6]
y2 = [3, 4, 6, 8, 7]

plt.scatter(x1, y1, c='blue', alpha=0.5, label='Group 1')
plt.scatter(x2, y2, c='red', alpha=0.8, label='Group 2')

plt.legend()

plt.show()
Output:
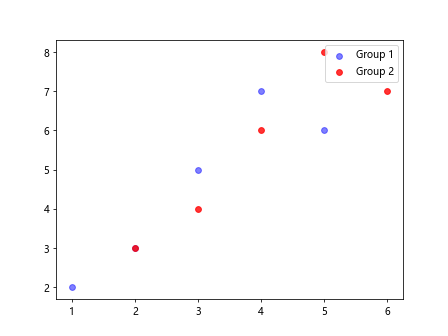
在这段代码中,我们通过设置alpha参数来控制不同类别散点的透明度。透明度较低的散点会更加隐约,从而能够更清晰地看到不同类别的叠加。
通过以上示例代码,我们介绍了如何在matplotlib中为散点图的每个点添加标签,并探讨了不同方式来区分散点图中的不同类别。
 极客教程
极客教程