Matplotlib中如何正确在一个图形中显示多个图像
参考:How to Display Multiple Images in One Figure Correctly in Matplotlib
Matplotlib是Python中最流行的数据可视化库之一,它提供了强大的功能来创建各种类型的图表和图形。在数据分析和科学研究中,经常需要在同一个图形中显示多个图像,以便进行比较或展示不同的数据集。本文将详细介绍如何使用Matplotlib在一个图形中正确显示多个图像,包括不同的布局方式、自定义设置以及常见的陷阱和解决方案。
1. 基础知识:Figure和Axes
在开始学习如何在一个图形中显示多个图像之前,我们需要了解Matplotlib中的两个重要概念:Figure和Axes。
- Figure:整个图形窗口,可以包含一个或多个子图(Axes)。
- Axes:图形中的一个绘图区域,通常包含坐标轴和数据。
理解这两个概念对于正确布局和显示多个图像至关重要。
让我们从一个简单的例子开始,创建一个包含两个子图的Figure:
import matplotlib.pyplot as plt
import numpy as np

# 创建一个Figure对象,包含两个子图
fig, (ax1, ax2) = plt.subplots(1, 2, figsize=(10, 5))

# 在第一个子图中绘制正弦曲线
x = np.linspace(0, 2*np.pi, 100)
ax1.plot(x, np.sin(x))
ax1.set_title('Sine Curve - how2matplotlib.com')

# 在第二个子图中绘制余弦曲线
ax2.plot(x, np.cos(x))
ax2.set_title('Cosine Curve - how2matplotlib.com')

plt.tight_layout()
plt.show()
Output:
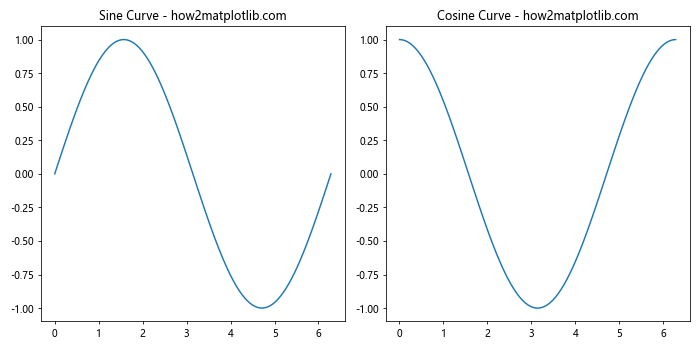
在这个例子中,我们创建了一个包含两个并排的子图的Figure。plt.subplots(1, 2)创建了一行两列的子图布局。我们使用ax1和ax2分别引用这两个子图,并在其中绘制了正弦和余弦曲线。
2. 使用subplot()函数创建多个子图
subplot()函数是创建多个子图的最基本方法之一。它允许你指定行数、列数和子图的位置。
以下是使用subplot()函数创建2×2布局的示例:
import matplotlib.pyplot as plt
import numpy as np

plt.figure(figsize=(10, 8))

# 创建2x2的子图布局
for i in range(4):
    plt.subplot(2, 2, i+1)
    x = np.linspace(0, 10, 100)
    y = np.sin(x + i*np.pi/2)
    plt.plot(x, y)
    plt.title(f'Subplot {i+1} - how2matplotlib.com')

plt.tight_layout()
plt.show()
Output:
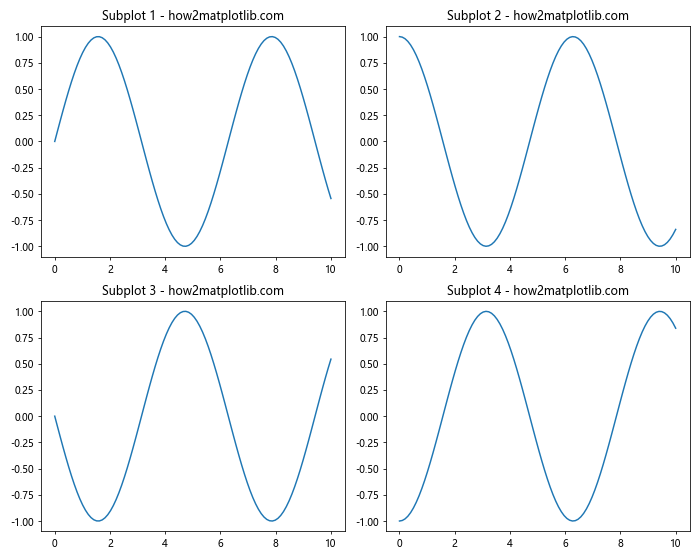
在这个例子中,我们使用一个循环创建了四个子图。subplot(2, 2, i+1)指定了2行2列的布局,i+1表示当前子图的位置(从1开始计数)。
3. 使用add_subplot()方法添加子图
add_subplot()方法提供了更灵活的方式来添加子图。它允许你在已有的Figure对象上添加新的子图。
下面是一个使用add_subplot()方法创建不同大小子图的例子:
import matplotlib.pyplot as plt
import numpy as np

fig = plt.figure(figsize=(12, 8))

# 添加一个占据左半部分的大子图
ax1 = fig.add_subplot(121)
x = np.linspace(0, 10, 100)
ax1.plot(x, np.sin(x))
ax1.set_title('Large Subplot - how2matplotlib.com')

# 在右半部分添加两个小子图
ax2 = fig.add_subplot(222)
ax2.plot(x, np.cos(x))
ax2.set_title('Small Subplot 1 - how2matplotlib.com')

ax3 = fig.add_subplot(224)
ax3.plot(x, np.tan(x))
ax3.set_title('Small Subplot 2 - how2matplotlib.com')

plt.tight_layout()
plt.show()
Output:
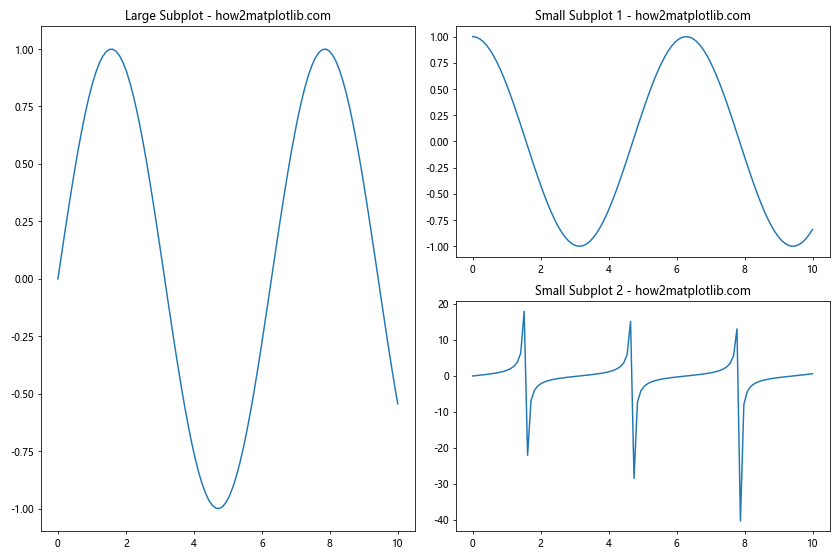
在这个例子中,我们创建了一个大的子图占据左半部分(121表示1行2列的第1个位置),然后在右半部分创建了两个小的子图(222和224分别表示2行2列的第2和第4个位置)。
4. 使用GridSpec进行复杂布局
对于更复杂的布局,Matplotlib提供了GridSpec类,它允许你创建灵活的网格来放置子图。
以下是使用GridSpec创建不规则布局的示例:
import matplotlib.pyplot as plt
import matplotlib.gridspec as gridspec
import numpy as np

fig = plt.figure(figsize=(12, 8))
gs = gridspec.GridSpec(3, 3)

# 创建一个占据左上角2x2空间的大子图
ax1 = fig.add_subplot(gs[0:2, 0:2])
x = np.linspace(0, 10, 100)
ax1.plot(x, np.sin(x))
ax1.set_title('Large Subplot - how2matplotlib.com')

# 创建右侧的两个小子图
ax2 = fig.add_subplot(gs[0, 2])
ax2.plot(x, np.cos(x))
ax2.set_title('Small Subplot 1 - how2matplotlib.com')

ax3 = fig.add_subplot(gs[1, 2])
ax3.plot(x, np.tan(x))
ax3.set_title('Small Subplot 2 - how2matplotlib.com')

# 创建底部的长条子图
ax4 = fig.add_subplot(gs[2, :])
ax4.plot(x, np.exp(x))
ax4.set_title('Bottom Subplot - how2matplotlib.com')

plt.tight_layout()
plt.show()
Output:
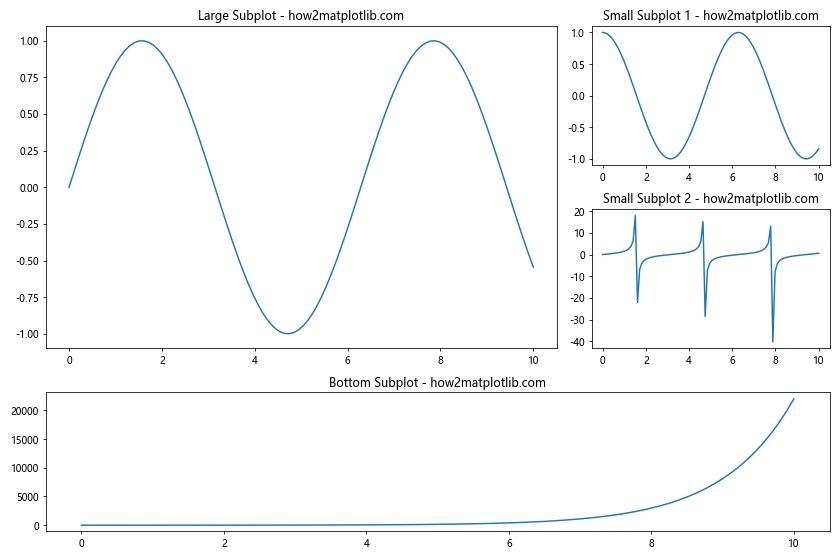
在这个例子中,我们使用GridSpec创建了一个3×3的网格,然后通过指定网格的范围来创建不同大小和位置的子图。
5. 在子图中显示图像
到目前为止,我们主要关注了如何创建子图布局。现在,让我们看看如何在这些子图中显示实际的图像。
以下是一个在多个子图中显示不同图像的例子:
import matplotlib.pyplot as plt
import numpy as np

# 创建一些示例图像
image1 = np.random.rand(10, 10)
image2 = np.random.rand(10, 10)
image3 = np.random.rand(10, 10)
image4 = np.random.rand(10, 10)

fig, axes = plt.subplots(2, 2, figsize=(10, 10))

# 在每个子图中显示一个图像
axes[0, 0].imshow(image1, cmap='viridis')
axes[0, 0].set_title('Image 1 - how2matplotlib.com')

axes[0, 1].imshow(image2, cmap='plasma')
axes[0, 1].set_title('Image 2 - how2matplotlib.com')

axes[1, 0].imshow(image3, cmap='inferno')
axes[1, 0].set_title('Image 3 - how2matplotlib.com')

axes[1, 1].imshow(image4, cmap='magma')
axes[1, 1].set_title('Image 4 - how2matplotlib.com')

# 调整子图之间的间距
plt.tight_layout()
plt.show()
Output:
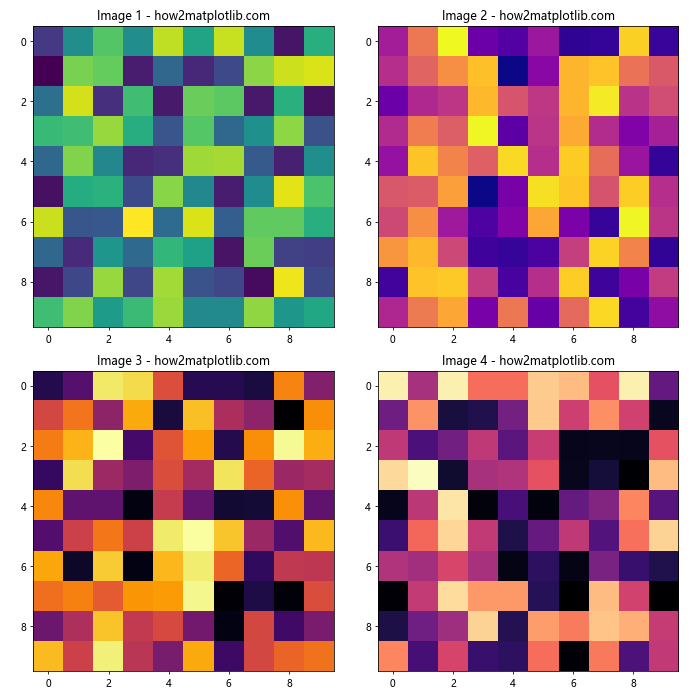
在这个例子中,我们创建了四个随机的10×10图像,并在2×2的子图布局中显示它们。每个图像使用不同的颜色映射(colormap)来增加视觉差异。
6. 调整子图之间的间距
当显示多个图像时,适当调整子图之间的间距可以改善整体布局。Matplotlib提供了几种方法来实现这一点:
使用tight_layout()
tight_layout()函数是最简单的方法,它会自动调整子图之间的间距:
import matplotlib.pyplot as plt
import numpy as np

fig, axes = plt.subplots(2, 2, figsize=(10, 10))

for i in range(2):
    for j in range(2):
        axes[i, j].imshow(np.random.rand(10, 10))
        axes[i, j].set_title(f'Image {i*2+j+1} - how2matplotlib.com')

plt.tight_layout()
plt.show()
Output:
使用subplots_adjust()
对于更精细的控制,可以使用subplots_adjust()函数:
import matplotlib.pyplot as plt
import numpy as np

fig, axes = plt.subplots(2, 2, figsize=(10, 10))

for i in range(2):
    for j in range(2):
        axes[i, j].imshow(np.random.rand(10, 10))
        axes[i, j].set_title(f'Image {i*2+j+1} - how2matplotlib.com')

plt.subplots_adjust(wspace=0.3, hspace=0.3)
plt.show()
Output:
在这个例子中,wspace和hspace分别控制子图之间的水平和垂直间距。
7. 添加颜色条(Colorbar)
当显示图像时,添加颜色条可以帮助解释像素值的含义。以下是如何为每个子图添加颜色条的示例:
import matplotlib.pyplot as plt
import numpy as np

fig, axes = plt.subplots(2, 2, figsize=(12, 12))

for i in range(2):
    for j in range(2):
        im = axes[i, j].imshow(np.random.rand(10, 10), cmap='viridis')
        axes[i, j].set_title(f'Image {i*2+j+1} - how2matplotlib.com')
        fig.colorbar(im, ax=axes[i, j])

plt.tight_layout()
plt.show()
Output:
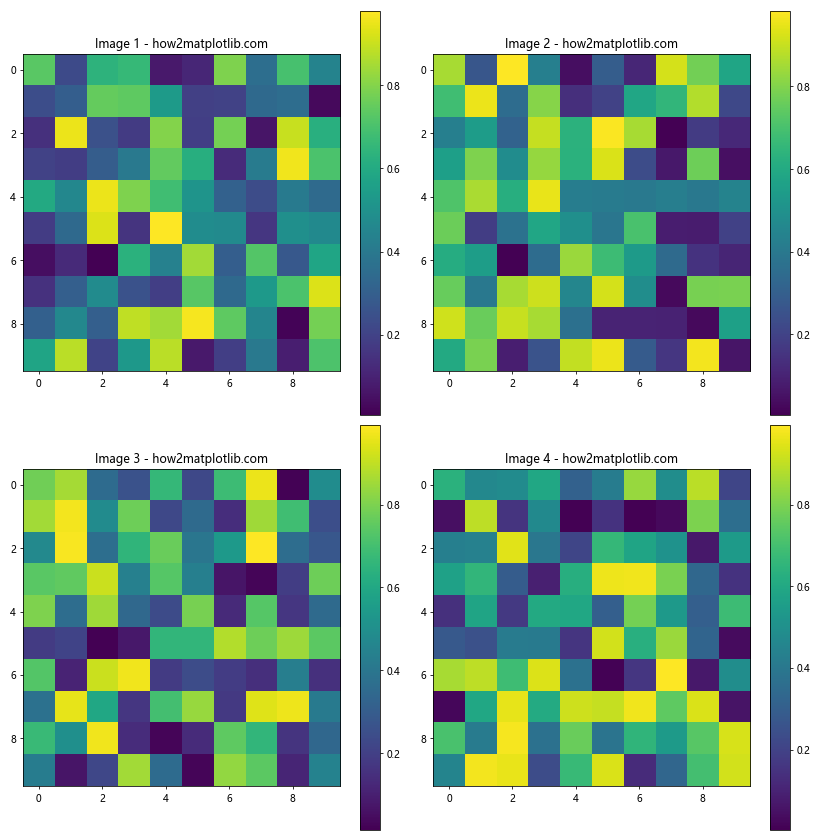
在这个例子中,我们为每个子图创建了一个单独的颜色条。fig.colorbar(im, ax=axes[i, j])将颜色条添加到特定的子图中。
8. 处理不同大小的图像
在实际应用中,你可能需要显示不同大小的图像。以下是如何处理这种情况的示例:
import matplotlib.pyplot as plt
import numpy as np

# 创建不同大小的图像
image1 = np.random.rand(10, 10)
image2 = np.random.rand(20, 20)
image3 = np.random.rand(15, 15)
image4 = np.random.rand(25, 25)

fig, axes = plt.subplots(2, 2, figsize=(12, 12))

axes[0, 0].imshow(image1, cmap='viridis')
axes[0, 0].set_title('10x10 Image - how2matplotlib.com')

axes[0, 1].imshow(image2, cmap='plasma')
axes[0, 1].set_title('20x20 Image - how2matplotlib.com')

axes[1, 0].imshow(image3, cmap='inferno')
axes[1, 0].set_title('15x15 Image - how2matplotlib.com')

axes[1, 1].imshow(image4, cmap='magma')
axes[1, 1].set_title('25x25 Image - how2matplotlib.com')

for ax in axes.flat:
    ax.axis('off')  # 隐藏坐标轴

plt.tight_layout()
plt.show()
Output:
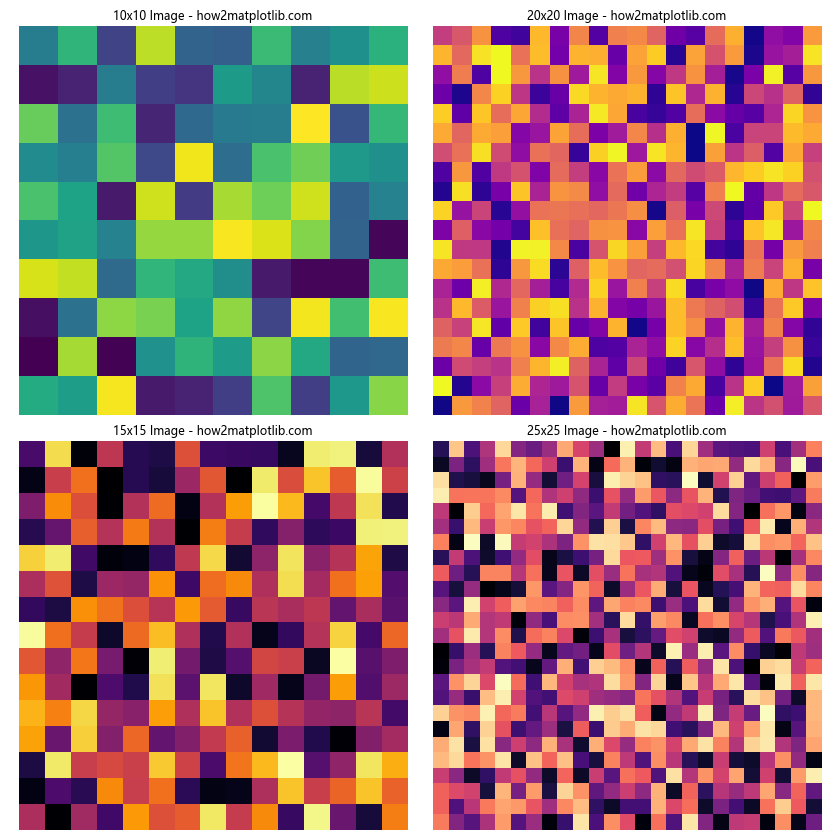
在这个例子中,我们创建了四个不同大小的图像,并在2×2的布局中显示它们。通过使用ax.axis('off'),我们隐藏了坐标轴,这在显示图像时通常是有用的。
9. 添加全局标题
当在一个图形中显示多个图像时,添加一个全局标题可以帮助解释整个图形的内容。以下是如何添加全局标题的示例:
import matplotlib.pyplot as plt
import numpy as np

fig, axes = plt.subplots(2, 2, figsize=(12, 12))

for i in range(2):
    for j in range(2):
        axes[i, j].imshow(np.random.rand(10, 10), cmap='viridis')
        axes[i, j].set_title(f'Image {i*2+j+1} - how2matplotlib.com')
        axes[i, j].axis('off')

fig.suptitle('Multiple Images Display - how2matplotlib.com', fontsize=16)

plt.tight_layout()
plt.subplots_adjust(top=0.9)  # 为全局标题留出空间
plt.show()
Output:
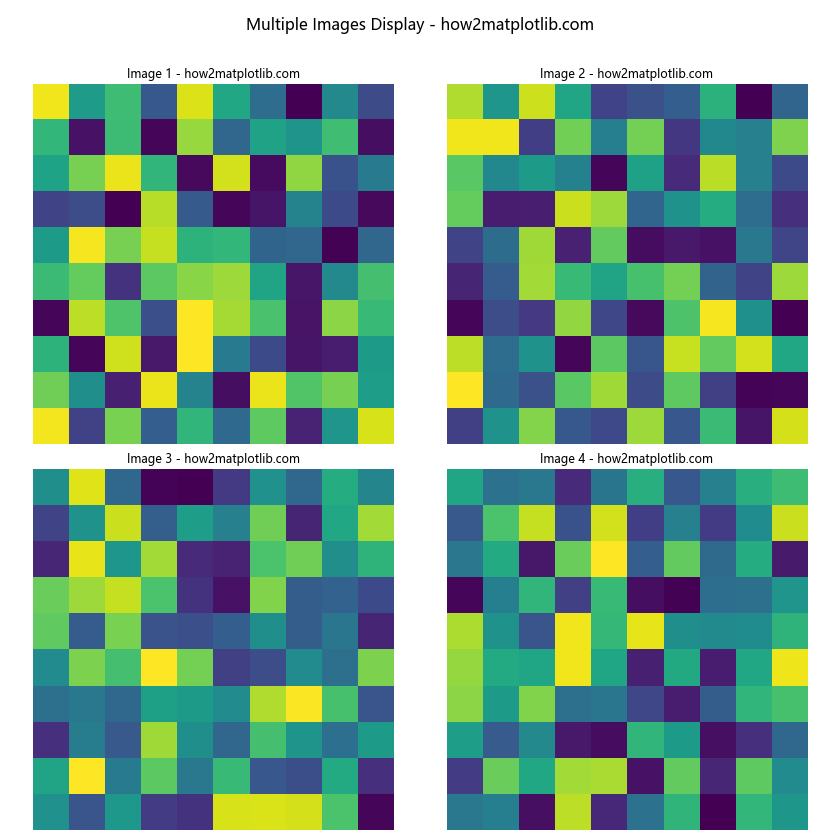
在这个例子中,我们使用fig.suptitle()添加了一个全局标题。注意,我们需要调整subplots_adjust()中的top参数,以为全局标题留出足够的空间。
10. 使用不同的图像格式
Matplotlib支持多种图像格式,包括PNG、JPEG、TIFF等。以下是如何在一个图形中显示不同格式的图像:
import matplotlib.pyplot as plt
import matplotlib.image as mpimg

# 假设你有以下图像文件
# 'image1.png', 'image2.jpg', 'image3.tiff', 'image4.bmp'

fig, axes = plt.subplots(2, 2, figsize=(12, 12))

axes[0, 0].imshow(mpimg.imread('image1.png'))
axes[0, 0].set_title('PNG Image - how2matplotlib.com')

axes[0, 1].imshow(mpimg.imread('image2.jpg'))
axes[0, 1].set_title('JPEG Image - how2matplotlib.com')

axes[1, 0].imshow(mpimg.imread('image3.tiff'))
axes[1, 0].set_title('TIFF Image - how2matplotlib.com')

axes[1, 1].imshow(mpimg.imread('image4.bmp'))
axes[1, 1].set_title('BMP Image - how2matplotlib.com')

for ax in axes.flat:
    ax.axis('off')

plt.tight_layout()
plt.show()
在这个例子中,我们使用matplotlib.image.imread()函数来读取不同格式的图像文件。Matplotlib会自动处理不同的图像格式,使得显示过程变得简单。
11. 调整图像亮度和对比度
有时,你可能需要调整图像的亮度和对比度以突出某些特征。以下是如何在显示多个图像时调整这些参数的示例:
import matplotlib.pyplot as plt
import numpy as np

def adjust_image(image, brightness=1, contrast=1):
    return np.clip(contrast * image + brightness, 0, 1)

# 创建原始图像
original = np.random.rand(10, 10)

fig, axes = plt.subplots(2, 2, figsize=(12, 12))

axes[0, 0].imshow(original, cmap='gray')
axes[0, 0].set_title('Original - how2matplotlib.com')

axes[0, 1].imshow(adjust_image(original, brightness=0.2), cmap='gray')
axes[0, 1].set_title('Darker - how2matplotlib.com')

axes[1, 0].imshow(adjust_image(original, brightness=-0.2), cmap='gray')
axes[1, 0].set_title('Brighter - how2matplotlib.com')

axes[1, 1].imshow(adjust_image(original, contrast=2), cmap='gray')
axes[1, 1].set_title('Higher Contrast - how2matplotlib.com')

for ax in axes.flat:
    ax.axis('off')

plt.tight_layout()
plt.show()
Output:
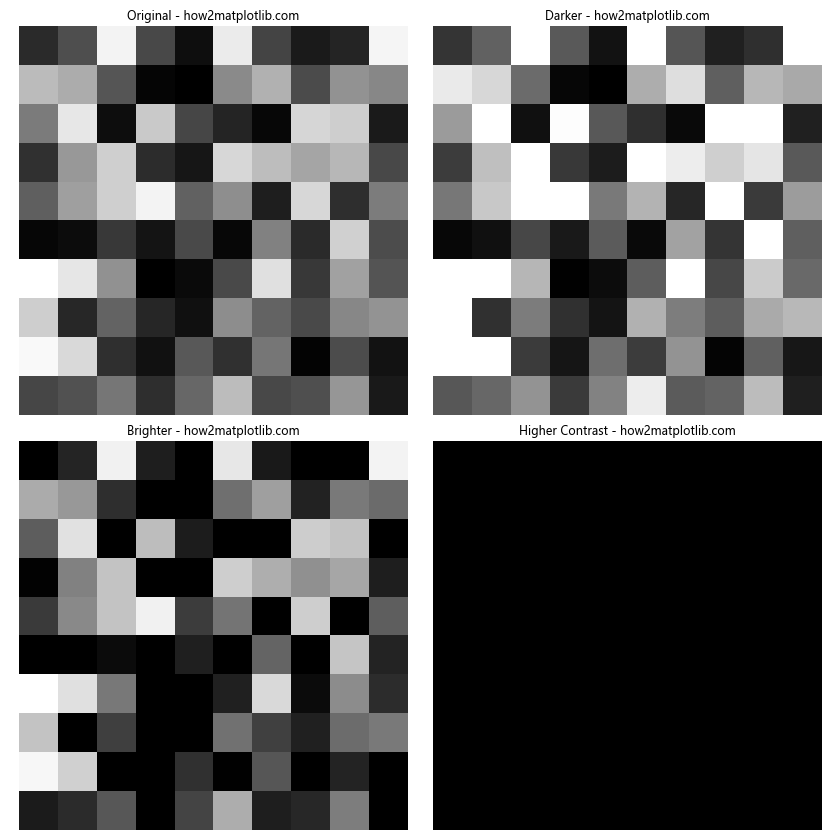
在这个例子中,我们定义了一个adjust_image()函数来调整图像的亮度和对比度。然后,我们在不同的子图中显示了原始图像以及经过不同调整的版本。
12. 添加图像边框
为了更好地区分多个图像,你可能想要为每个图像添加边框。以下是如何实现这一点的示例:
import matplotlib.pyplot as plt
import numpy as np

fig, axes = plt.subplots(2, 2, figsize=(12, 12))

for i in range(2):
    for j in range(2):
        im = axes[i, j].imshow(np.random.rand(10, 10), cmap='viridis')
        axes[i, j].set_title(f'Image {i*2+j+1} - how2matplotlib.com')
        axes[i, j].axis('off')

        # 添加边框
        for spine in axes[i, j].spines.values():
            spine.set_visible(True)
            spine.set_color('red')
            spine.set_linewidth(2)

plt.tight_layout()
plt.show()
Output:
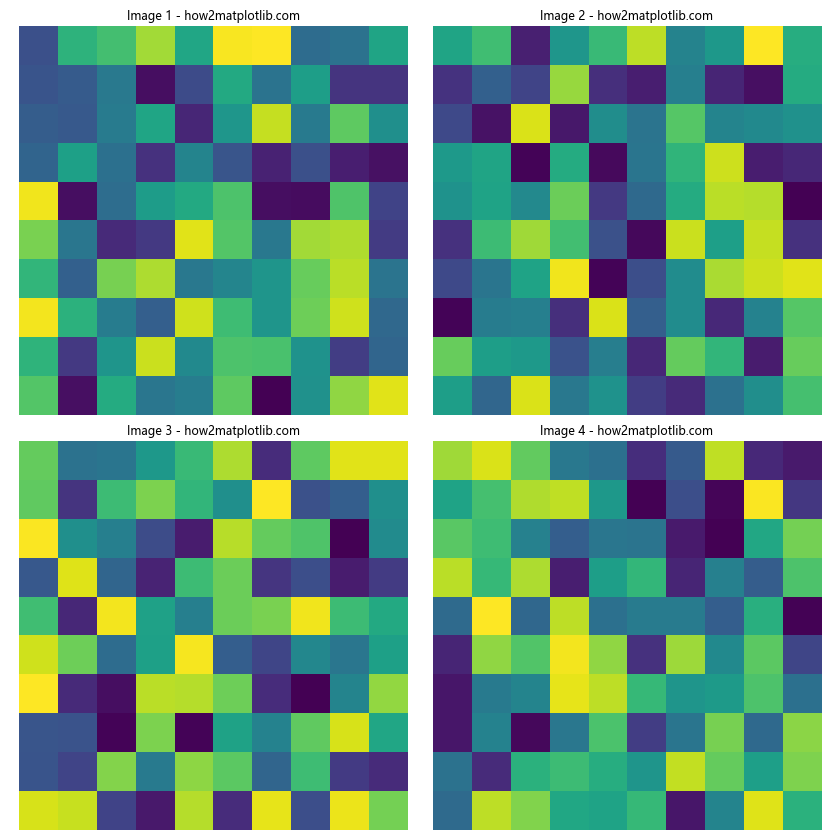
在这个例子中,我们遍历每个子图的边缘(spines),将它们设置为可见,并自定义颜色和宽度。
13. 使用不同的插值方法
当显示图像时,特别是当图像被放大或缩小时,插值方法会影响图像的显示质量。Matplotlib提供了多种插值方法。以下是如何在显示多个图像时使用不同的插值方法:
import matplotlib.pyplot as plt
import numpy as np

# 创建一个小图像
small_image = np.random.rand(5, 5)

fig, axes = plt.subplots(2, 2, figsize=(12, 12))

interpolation_methods = ['nearest', 'bilinear', 'bicubic', 'spline16']

for ax, method in zip(axes.flat, interpolation_methods):
    ax.imshow(small_image, interpolation=method, cmap='viridis')
    ax.set_title(f'{method.capitalize()} Interpolation - how2matplotlib.com')
    ax.axis('off')

plt.tight_layout()
plt.show()
Output:
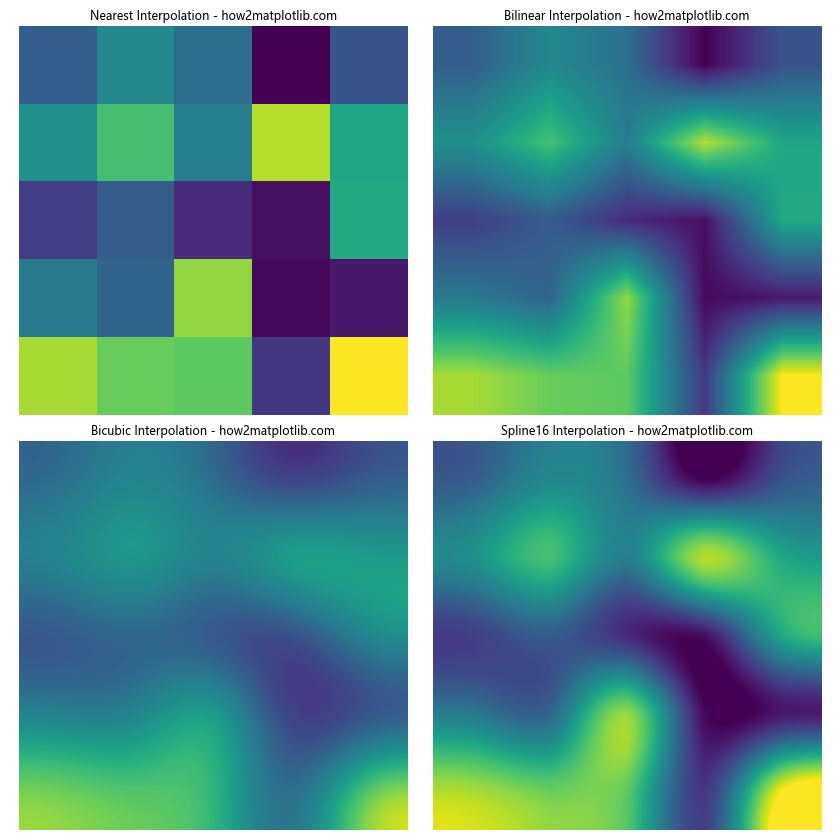
在这个例子中,我们创建了一个小的5×5图像,并使用不同的插值方法在较大的子图中显示它。这样可以清楚地看到不同插值方法的效果。
14. 显示图像和绘图的组合
有时,你可能需要在同一个图形中既显示图像又显示绘图。以下是如何实现这种组合的示例:
import matplotlib.pyplot as plt
import numpy as np

fig, axes = plt.subplots(2, 2, figsize=(12, 12))

# 显示图像
image = np.random.rand(10, 10)
axes[0, 0].imshow(image, cmap='viridis')
axes[0, 0].set_title('Image - how2matplotlib.com')
axes[0, 0].axis('off')

# 绘制曲线
x = np.linspace(0, 10, 100)
axes[0, 1].plot(x, np.sin(x))
axes[0, 1].set_title('Sine Curve - how2matplotlib.com')

# 绘制散点图
x = np.random.rand(50)
y = np.random.rand(50)
axes[1, 0].scatter(x, y)
axes[1, 0].set_title('Scatter Plot - how2matplotlib.com')

# 绘制柱状图
categories = ['A', 'B', 'C', 'D']
values = np.random.rand(4)
axes[1, 1].bar(categories, values)
axes[1, 1].set_title('Bar Chart - how2matplotlib.com')

plt.tight_layout()
plt.show()
Output:
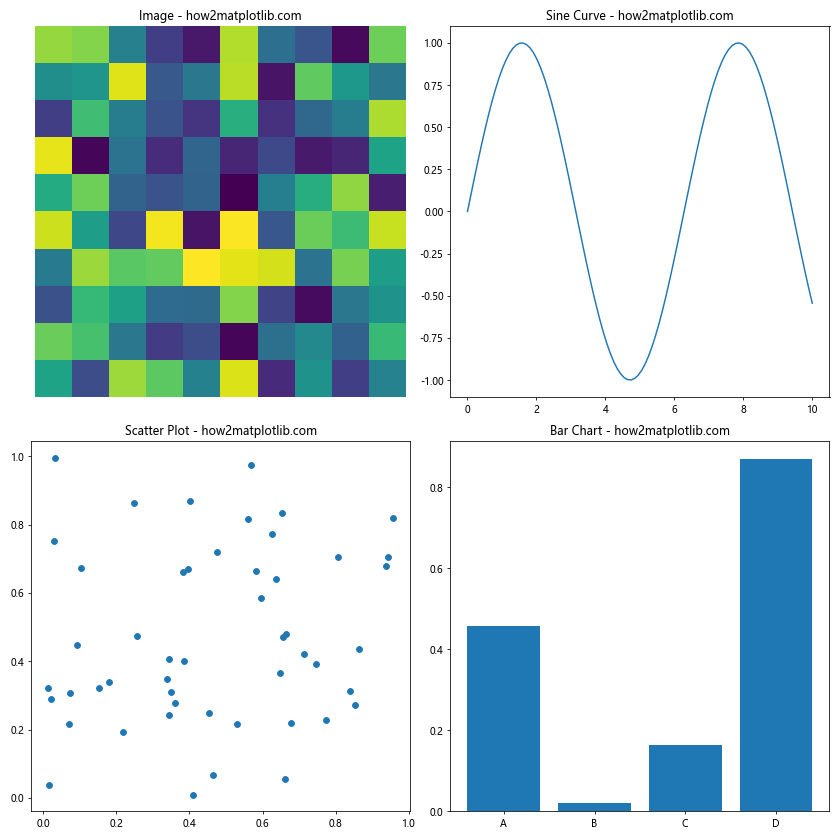
在这个例子中,我们在一个2×2的布局中组合了图像显示、曲线图、散点图和柱状图。这种组合可以用于比较不同类型的数据或展示复杂的数据集。
15. 添加图例
当在一个图形中显示多个图像或绘图时,添加图例可以帮助解释不同的元素。以下是如何为多个子图添加图例的示例:
import matplotlib.pyplot as plt
import numpy as np

fig, axes = plt.subplots(2, 2, figsize=(12, 12))

# 子图1:显示两个重叠的图像
image1 = np.random.rand(10, 10)
image2 = np.random.rand(10, 10)
axes[0, 0].imshow(image1, cmap='viridis', alpha=0.7, label='Image 1')
axes[0, 0].imshow(image2, cmap='plasma', alpha=0.3, label='Image 2')
axes[0, 0].legend()
axes[0, 0].set_title('Overlapping Images - how2matplotlib.com')

# 子图2:绘制多条曲线
x = np.linspace(0, 10, 100)
axes[0, 1].plot(x, np.sin(x), label='sin(x)')
axes[0, 1].plot(x, np.cos(x), label='cos(x)')
axes[0, 1].legend()
axes[0, 1].set_title('Multiple Curves - how2matplotlib.com')

# 子图3:散点图with不同类别
x = np.random.rand(50)
y = np.random.rand(50)
colors = np.random.choice(['r', 'g', 'b'], 50)
scatter = axes[1, 0].scatter(x, y, c=colors)
axes[1, 0].legend(handles=scatter.legend_elements()[0], labels=['Red', 'Green', 'Blue'])
axes[1, 0].set_title('Scatter Plot with Categories - how2matplotlib.com')

# 子图4:堆叠柱状图
categories = ['A', 'B', 'C', 'D']
values1 = np.random.rand(4)
values2 = np.random.rand(4)
axes[1, 1].bar(categories, values1, label='Group 1')
axes[1, 1].bar(categories, values2, bottom=values1, label='Group 2')
axes[1, 1].legend()
axes[1, 1].set_title('Stacked Bar Chart - how2matplotlib.com')

plt.tight_layout()
plt.show()
Output:
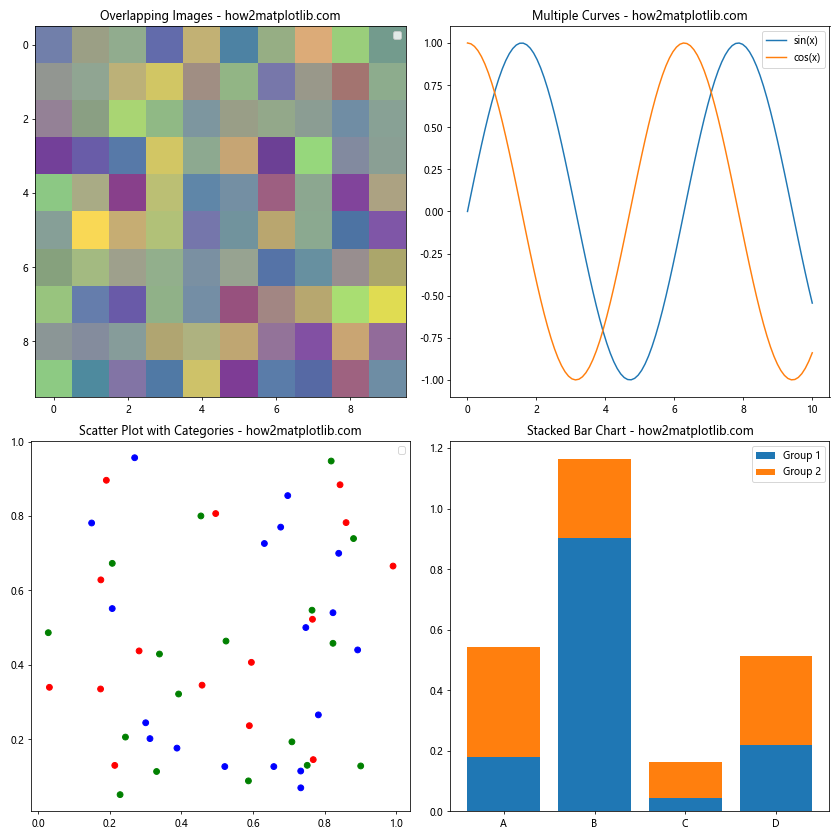
在这个例子中,我们为每个子图添加了不同类型的图例。对于图像,我们使用alpha参数来创建半透明效果,以便同时显示两个图像。对于散点图,我们使用legend_elements()方法来创建颜色类别的图例。
16. 使用不同的坐标系
Matplotlib支持多种坐标系,如极坐标、对数坐标等。以下是如何在一个图形中使用不同坐标系的示例:
import matplotlib.pyplot as plt
import numpy as np

fig, axes = plt.subplots(2, 2, figsize=(12, 12))

# 笛卡尔坐标系
x = np.linspace(0, 10, 100)
axes[0, 0].plot(x, np.sin(x))
axes[0, 0].set_title('Cartesian - how2matplotlib.com')

# 极坐标系
r = np.linspace(0, 2, 100)
theta = 2 * np.pi * r
ax_polar = fig.add_subplot(222, projection='polar')
ax_polar.plot(theta, r)
ax_polar.set_title('Polar - how2matplotlib.com')

# 对数坐标系
x = np.logspace(0, 2, 100)
axes[1, 0].loglog(x, x**2)
axes[1, 0].set_title('Log-Log - how2matplotlib.com')

# 半对数坐标系
x = np.linspace(0, 10, 100)
axes[1, 1].semilogy(x, np.exp(x))
axes[1, 1].set_title('Semi-Log - how2matplotlib.com')

plt.tight_layout()
plt.show()
Output:
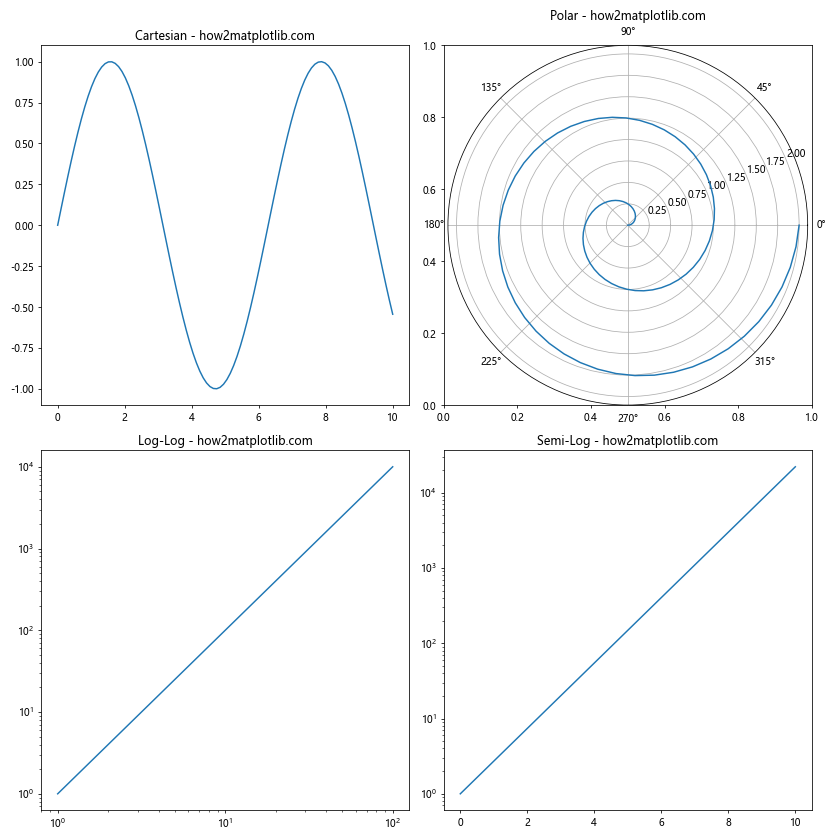
在这个例子中,我们在一个2×2的布局中展示了四种不同的坐标系:笛卡尔坐标系、极坐标系、对数-对数坐标系和半对数坐标系。注意,对于极坐标系,我们需要使用fig.add_subplot()并指定projection='polar'。
17. 添加文本注释
在显示多个图像或绘图时,添加文本注释可以帮助解释特定的特征或数据点。以下是如何在多个子图中添加文本注释的示例:
import matplotlib.pyplot as plt
import numpy as np

fig, axes = plt.subplots(2, 2, figsize=(12, 12))

# 子图1:图像with箭头注释
image = np.random.rand(10, 10)
axes[0, 0].imshow(image, cmap='viridis')
axes[0, 0].annotate('Interesting Point', xy=(5, 5), xytext=(7, 7),
                    arrowprops=dict(facecolor='red', shrink=0.05))
axes[0, 0].set_title('Image with Annotation - how2matplotlib.com')

# 子图2:曲线with文本标签
x = np.linspace(0, 10, 100)
y = np.sin(x)
axes[0, 1].plot(x, y)
axes[0, 1].text(5, 0.5, 'sin(x) > 0', fontsize=12, bbox=dict(facecolor='yellow', alpha=0.5))
axes[0, 1].set_title('Curve with Text - how2matplotlib.com')

# 子图3:散点图with数据标签
x = np.random.rand(10)
y = np.random.rand(10)
axes[1, 0].scatter(x, y)
for i, (xi, yi) in enumerate(zip(x, y)):
    axes[1, 0].annotate(f'Point {i}', (xi, yi), xytext=(5, 5), textcoords='offset points')
axes[1, 0].set_title('Scatter with Labels - how2matplotlib.com')

# 子图4:柱状图with值标签
categories = ['A', 'B', 'C', 'D']
values = np.random.rand(4)
bars = axes[1, 1].bar(categories, values)
for bar in bars:
    height = bar.get_height()
    axes[1, 1].text(bar.get_x() + bar.get_width()/2., height,
                    f'{height:.2f}', ha='center', va='bottom')
axes[1, 1].set_title('Bar Chart with Values - how2matplotlib.com')

plt.tight_layout()
plt.show()
Output:
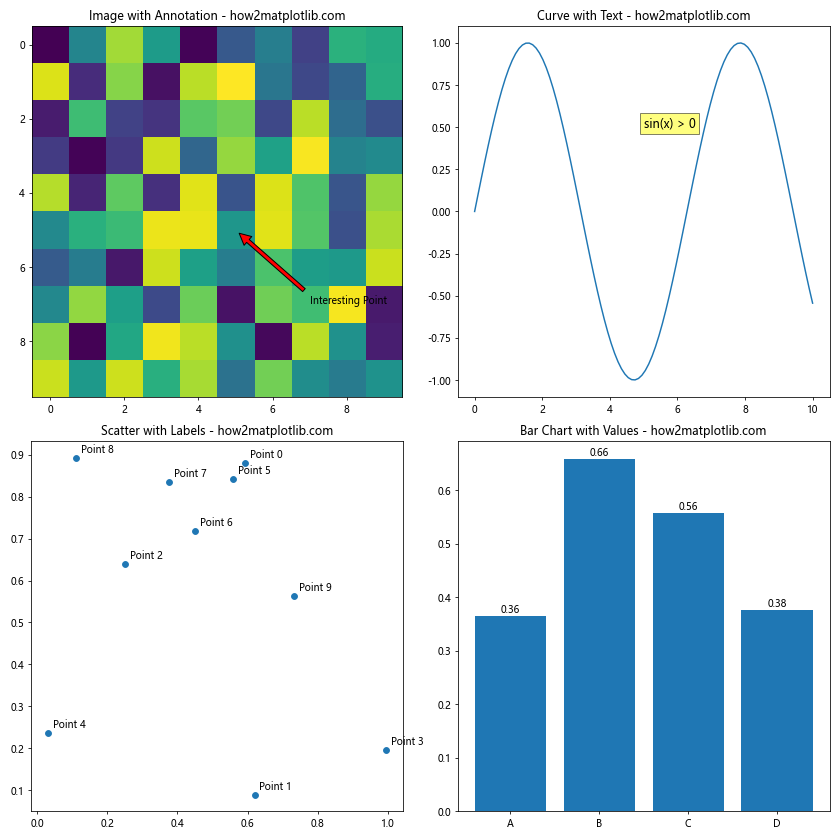
在这个例子中,我们展示了四种不同的文本注释方式:
1. 使用annotate()添加带箭头的注释
2. 使用text()添加简单的文本标签
3. 为散点图的每个点添加标签
4. 在柱状图的每个柱子上方显示其值
18. 自定义坐标轴
当显示多个图像或绘图时,自定义坐标轴可以帮助更好地展示数据。以下是如何在多个子图中自定义坐标轴的示例:
import matplotlib.pyplot as plt
import numpy as np

fig, axes = plt.subplots(2, 2, figsize=(12, 12))

# 子图1:自定义刻度
x = np.linspace(0, 10, 100)
axes[0, 0].plot(x, np.sin(x))
axes[0, 0].set_xticks(np.arange(0, 11, 2))
axes[0, 0].set_yticks(np.arange(-1, 1.1, 0.5))
axes[0, 0].set_title('Custom Ticks - how2matplotlib.com')

# 子图2:旋转刻度标签
categories = ['Category A', 'Category B', 'Category C','Category D']
values = np.random.rand(4)
axes[0, 1].bar(categories, values)
axes[0, 1].set_xticklabels(categories, rotation=45, ha='right')
axes[0, 1].set_title('Rotated Labels - how2matplotlib.com')

# 子图3:对数刻度
x = np.logspace(0, 3, 100)
axes[1, 0].loglog(x, x**2)
axes[1, 0].set_title('Log Scale - how2matplotlib.com')

# 子图4:双Y轴
x = np.linspace(0, 10, 100)
axes[1, 1].plot(x, np.sin(x), 'b-', label='sin(x)')
axes[1, 1].set_ylabel('sin(x)', color='b')
axes[1, 1].tick_params(axis='y', labelcolor='b')

ax2 = axes[1, 1].twinx()
ax2.plot(x, np.exp(x), 'r-', label='exp(x)')
ax2.set_ylabel('exp(x)', color='r')
ax2.tick_params(axis='y', labelcolor='r')

axes[1, 1].set_title('Dual Y-axes - how2matplotlib.com')

plt.tight_layout()
plt.show()
Output:
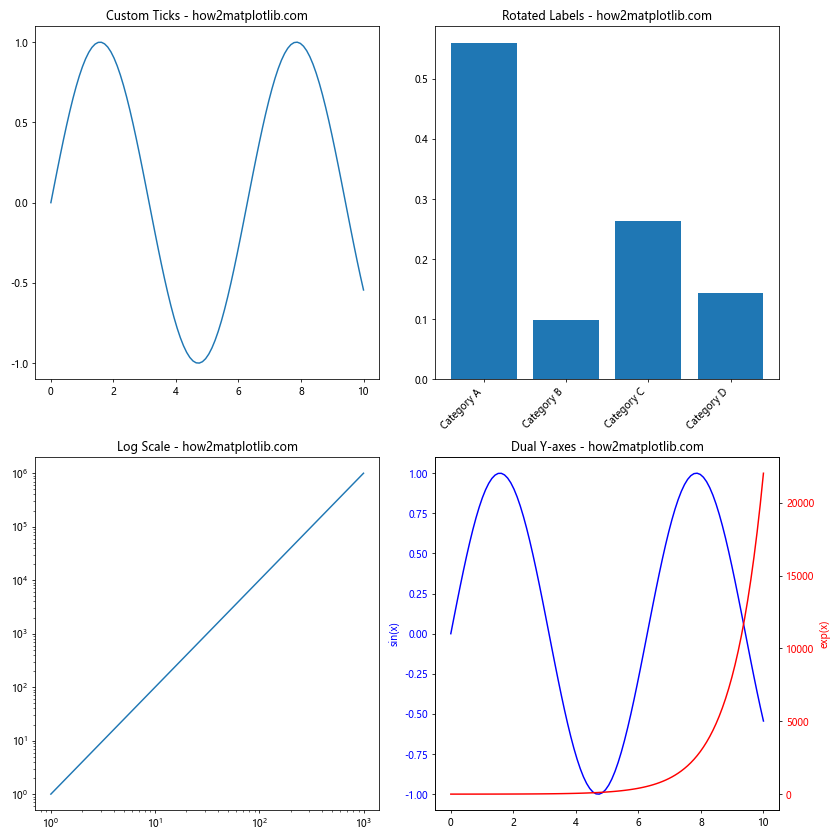
在这个例子中,我们展示了四种不同的坐标轴自定义方式:
1. 使用set_xticks()和set_yticks()自定义刻度
2. 使用set_xticklabels()旋转刻度标签
3. 使用对数刻度
4. 创建双Y轴
19. 使用不同的颜色映射
颜色映射(colormap)在显示图像和热图时非常重要。Matplotlib提供了多种内置的颜色映射。以下是如何在多个子图中使用不同颜色映射的示例:
import matplotlib.pyplot as plt
import numpy as np

fig, axes = plt.subplots(2, 2, figsize=(12, 12))

# 创建一个示例图像
image = np.random.rand(20, 20)

cmaps = ['viridis', 'plasma', 'inferno', 'magma']

for ax, cmap in zip(axes.flat, cmaps):
    im = ax.imshow(image, cmap=cmap)
    ax.set_title(f'{cmap.capitalize()} Colormap - how2matplotlib.com')
    fig.colorbar(im, ax=ax)
    ax.axis('off')

plt.tight_layout()
plt.show()
Output:
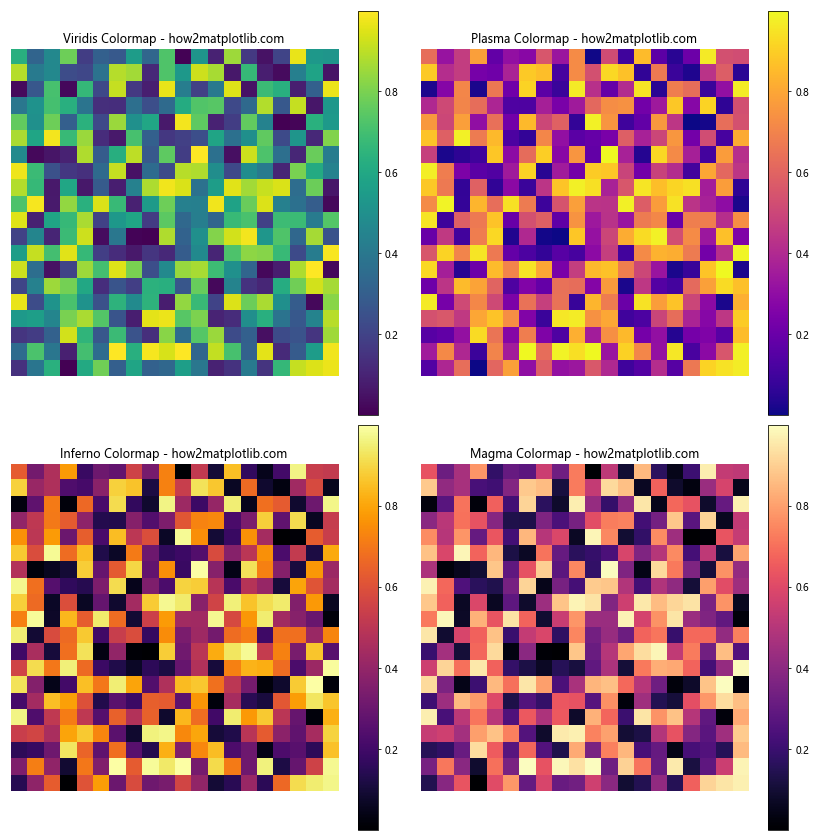
在这个例子中,我们使用了四种不同的颜色映射来显示同一个随机生成的图像。每个子图都配有一个颜色条,以显示颜色与数值的对应关系。
20. 保存多子图图形
最后,让我们看看如何保存包含多个子图的图形。Matplotlib支持多种输出格式,如PNG、PDF、SVG等。以下是如何保存图形的示例:
import matplotlib.pyplot as plt
import numpy as np

fig, axes = plt.subplots(2, 2, figsize=(12, 12))

for i in range(2):
    for j in range(2):
        axes[i, j].imshow(np.random.rand(10, 10), cmap='viridis')
        axes[i, j].set_title(f'Subplot {i*2+j+1} - how2matplotlib.com')
        axes[i, j].axis('off')

plt.tight_layout()

# 保存为PNG格式
plt.savefig('multiple_images.png', dpi=300, bbox_inches='tight')

# 保存为PDF格式
plt.savefig('multiple_images.pdf', bbox_inches='tight')

# 保存为SVG格式
plt.savefig('multiple_images.svg', bbox_inches='tight')

plt.show()
Output:
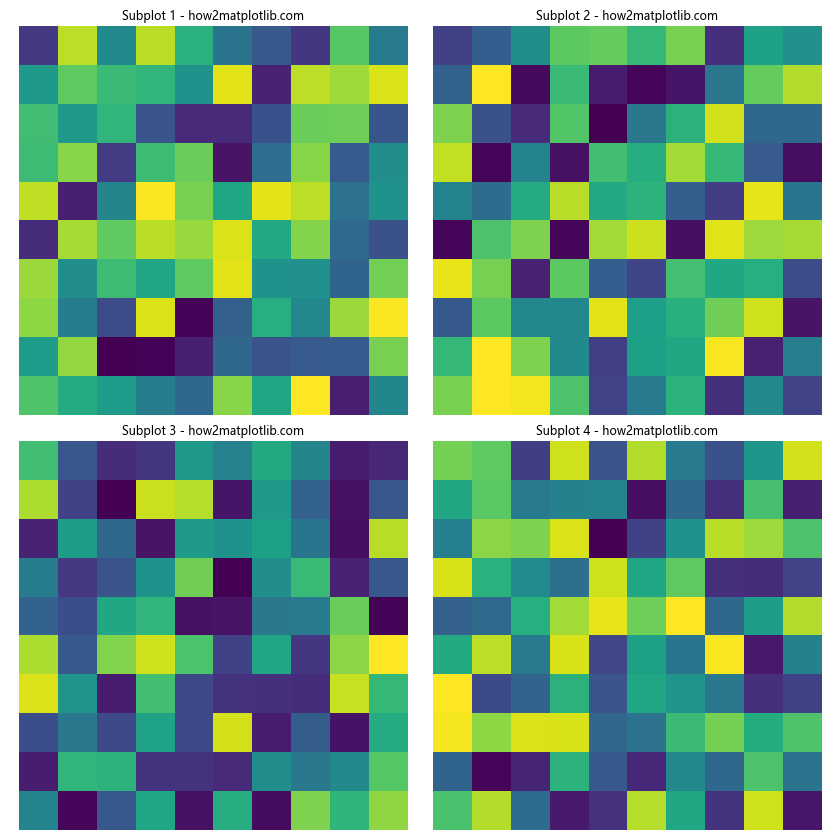
在这个例子中,我们创建了一个包含四个子图的图形,并将其保存为PNG、PDF和SVG格式。dpi参数控制输出图像的分辨率,bbox_inches='tight'确保图形的所有部分都包含在输出文件中。
总结
在本文中,我们详细探讨了如何使用Matplotlib在一个图形中正确显示多个图像。我们涵盖了从基本的子图创建到高级的布局技巧,从简单的图像显示到复杂的数据可视化。通过这些技术,你可以创建丰富、信息量大的图形,有效地展示和比较多个数据集或图像。
关键点包括:
1. 使用subplot()、add_subplot()和GridSpec创建灵活的子图布局
2. 调整子图间距和添加颜色条以改善可读性
3. 处理不同大小和格式的图像
4. 结合图像显示和其他类型的绘图
5. 添加注释、图例和自定义坐标轴以增强信息传递
6. 使用不同的颜色映射来突出显示数据特征
7. 正确保存多子图图形
通过掌握这些技术,你将能够创建既美观又富有信息的多图像显示,适用于各种数据分析和科学可视化需求。记住,实践是提高数据可视化技能的关键,所以不要犹豫,开始尝试这些技术,创建你自己的精彩图形吧!
 极客教程
极客教程