Matplotlib中如何为所有子图创建单一图例
参考:How to Create a Single Legend for All Subplots in Matplotlib
Matplotlib是Python中强大的数据可视化库,它提供了丰富的绘图功能。在创建复杂的图表时,我们经常需要使用子图来展示多个相关的图形。然而,当每个子图都有自己的图例时,可能会导致视觉混乱和重复信息。为了解决这个问题,我们可以为所有子图创建一个单一的图例,使整个图表更加简洁和易于理解。本文将详细介绍如何在Matplotlib中为所有子图创建单一图例,并提供多个实用的示例代码。
1. 理解Matplotlib的子图和图例
在深入探讨如何创建单一图例之前,我们需要先了解Matplotlib中子图和图例的基本概念。
1.1 子图(Subplots)
子图是Matplotlib中用于在一个图形窗口中创建多个图表的方法。使用子图可以将相关的数据可视化组合在一起,便于比较和分析。
以下是创建子图的基本示例:
import matplotlib.pyplot as plt
import numpy as np

# 创建示例数据
x = np.linspace(0, 10, 100)
y1 = np.sin(x)
y2 = np.cos(x)

# 创建2x2的子图网格
fig, axs = plt.subplots(2, 2, figsize=(10, 8))

# 在每个子图中绘制数据
axs[0, 0].plot(x, y1)
axs[0, 0].set_title('Sine Wave - how2matplotlib.com')
axs[0, 1].plot(x, y2)
axs[0, 1].set_title('Cosine Wave - how2matplotlib.com')
axs[1, 0].plot(x, y1 ** 2)
axs[1, 0].set_title('Squared Sine - how2matplotlib.com')
axs[1, 1].plot(x, y2 ** 2)
axs[1, 1].set_title('Squared Cosine - how2matplotlib.com')

plt.tight_layout()
plt.show()
Output:
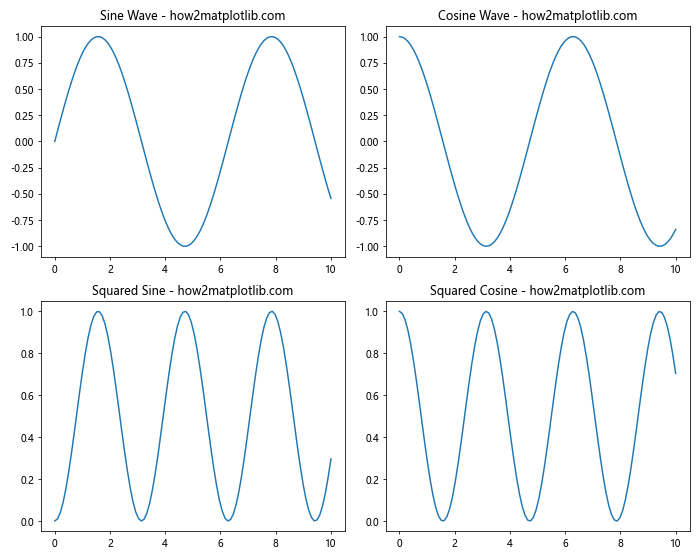
在这个示例中,我们创建了一个2×2的子图网格,并在每个子图中绘制了不同的函数。plt.subplots()函数返回一个图形对象和一个包含所有子图的数组。
1.2 图例(Legend)
图例是用于解释图表中不同数据系列的标识符。它通常包含每个数据系列的名称和对应的颜色或样式。
以下是在单个图表中添加图例的基本示例:
import matplotlib.pyplot as plt
import numpy as np

# 创建示例数据
x = np.linspace(0, 10, 100)
y1 = np.sin(x)
y2 = np.cos(x)

# 创建图表并绘制数据
plt.figure(figsize=(8, 6))
plt.plot(x, y1, label='Sine - how2matplotlib.com')
plt.plot(x, y2, label='Cosine - how2matplotlib.com')

# 添加图例
plt.legend()

plt.title('Sine and Cosine Waves')
plt.xlabel('X-axis')
plt.ylabel('Y-axis')
plt.show()
Output:
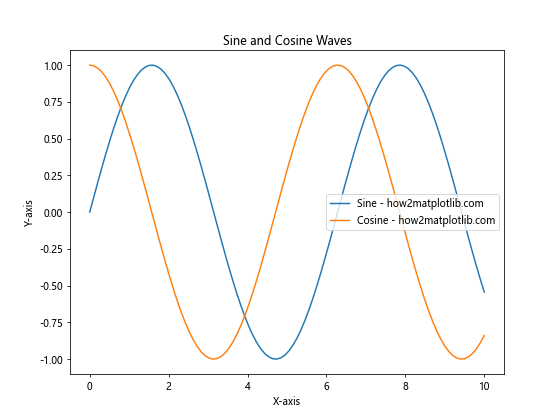
在这个示例中,我们使用label参数为每条线指定了标签,然后调用plt.legend()来显示图例。
2. 为什么需要单一图例
在处理多个子图时,每个子图默认会有自己的图例。这可能导致以下问题:
- 视觉混乱:多个图例会占用大量空间,减少实际数据的显示区域。
- 信息重复:如果多个子图包含相同的数据系列,每个子图都显示相同的图例会造成不必要的重复。
- 一致性:不同子图的图例可能会有细微的差异,影响整体的一致性。
- 可读性:多个小图例可能会使文字变小,降低可读性。
创建一个单一的图例可以解决这些问题,使整个图表更加清晰和专业。
3. 创建单一图例的基本方法
创建单一图例的基本思路是:在所有子图绘制完成后,创建一个新的轴(Axes)对象来放置图例,然后将这个轴对象设置为不可见。
以下是一个基本示例:
import matplotlib.pyplot as plt
import numpy as np

# 创建示例数据
x = np.linspace(0, 10, 100)
y1 = np.sin(x)
y2 = np.cos(x)

# 创建2x2的子图网格
fig, axs = plt.subplots(2, 2, figsize=(10, 8))

# 在每个子图中绘制数据
for ax in axs.flat:
    ax.plot(x, y1, label='Sine - how2matplotlib.com')
    ax.plot(x, y2, label='Cosine - how2matplotlib.com')

# 创建一个新的轴对象来放置图例
fig.add_subplot(111, frameon=False)
plt.tick_params(labelcolor='none', top=False, bottom=False, left=False, right=False)

# 创建单一图例
handles, labels = ax.get_legend_handles_labels()
plt.legend(handles, labels, loc='center')

plt.tight_layout()
plt.show()
Output:
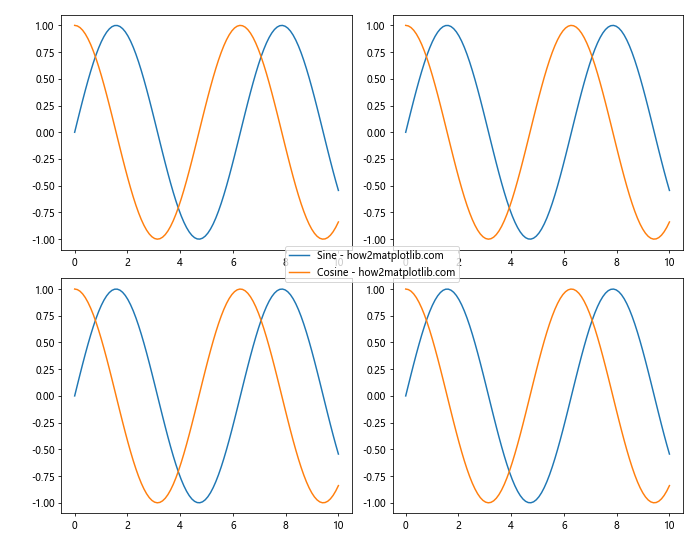
在这个示例中,我们首先创建了2×2的子图网格,并在每个子图中绘制了相同的数据。然后,我们使用fig.add_subplot(111, frameon=False)创建了一个覆盖整个图形的新轴对象,并将其设置为不可见。最后,我们从任意一个子图中获取图例句柄和标签,并使用这些信息创建了一个居中的单一图例。
4. 高级技巧和注意事项
4.1 调整图例位置
你可以通过调整loc参数来改变图例的位置。以下是一个将图例放置在图表底部的示例:
import matplotlib.pyplot as plt
import numpy as np

# 创建示例数据
x = np.linspace(0, 10, 100)
y1 = np.sin(x)
y2 = np.cos(x)

# 创建2x2的子图网格
fig, axs = plt.subplots(2, 2, figsize=(10, 10))

# 在每个子图中绘制数据
for ax in axs.flat:
    ax.plot(x, y1, label='Sine - how2matplotlib.com')
    ax.plot(x, y2, label='Cosine - how2matplotlib.com')

# 创建一个新的轴对象来放置图例
fig.add_subplot(111, frameon=False)
plt.tick_params(labelcolor='none', top=False, bottom=False, left=False, right=False)

# 创建单一图例并放置在底部
handles, labels = ax.get_legend_handles_labels()
plt.legend(handles, labels, loc='lower center', bbox_to_anchor=(0.5, -0.05), ncol=2)

plt.tight_layout()
plt.show()
Output:
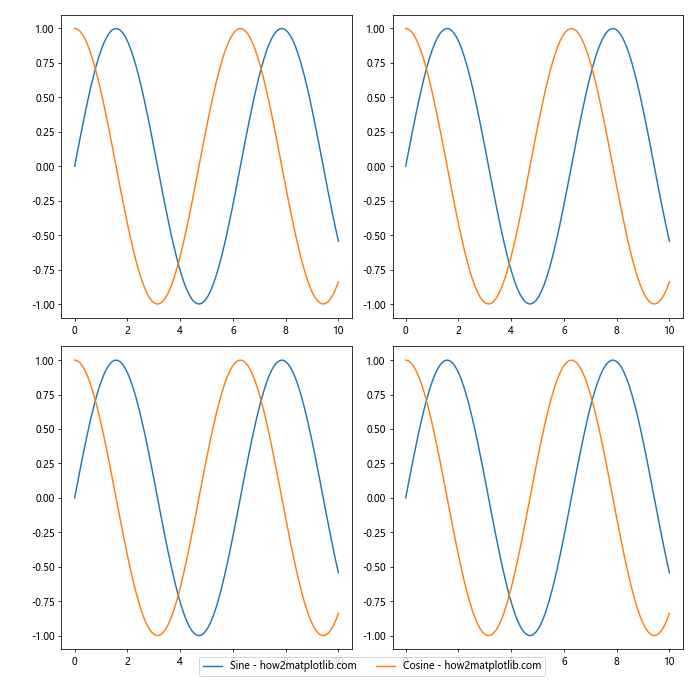
在这个示例中,我们使用loc='lower center'将图例放置在底部中心,并使用bbox_to_anchor参数微调位置。ncol=2参数使图例以两列显示。
4.2 处理不同子图中的不同数据系列
当不同的子图包含不同的数据系列时,我们需要收集所有子图的图例信息。以下是一个示例:
import matplotlib.pyplot as plt
import numpy as np

# 创建示例数据
x = np.linspace(0, 10, 100)
y1 = np.sin(x)
y2 = np.cos(x)
y3 = np.tan(x)
y4 = x**2

# 创建2x2的子图网格
fig, axs = plt.subplots(2, 2, figsize=(12, 10))

# 在每个子图中绘制不同的数据
axs[0, 0].plot(x, y1, label='Sine - how2matplotlib.com')
axs[0, 1].plot(x, y2, label='Cosine - how2matplotlib.com')
axs[1, 0].plot(x, y3, label='Tangent - how2matplotlib.com')
axs[1, 1].plot(x, y4, label='Square - how2matplotlib.com')

# 收集所有子图的图例信息
handles, labels = [], []
for ax in axs.flat:
    h, l = ax.get_legend_handles_labels()
    handles.extend(h)
    labels.extend(l)

# 创建一个新的轴对象来放置图例
fig.add_subplot(111, frameon=False)
plt.tick_params(labelcolor='none', top=False, bottom=False, left=False, right=False)

# 创建单一图例
plt.legend(handles, labels, loc='center')

plt.tight_layout()
plt.show()
Output:
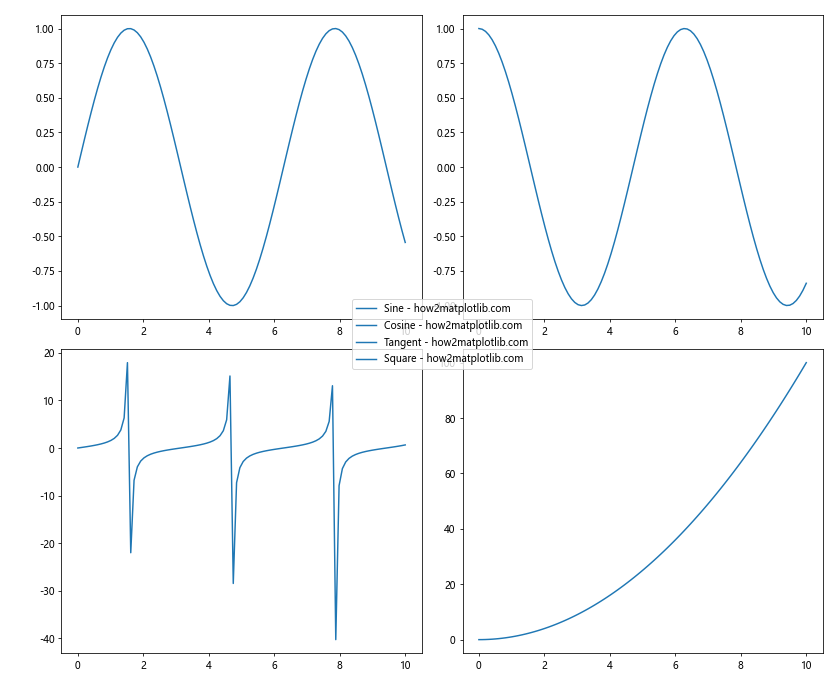
在这个示例中,我们遍历所有子图,收集它们的图例信息,然后创建一个包含所有数据系列的单一图例。
4.3 自定义图例样式
你可以自定义图例的样式以更好地适应你的图表。以下是一个示例:
import matplotlib.pyplot as plt
import numpy as np

# 创建示例数据
x = np.linspace(0, 10, 100)
y1 = np.sin(x)
y2 = np.cos(x)

# 创建2x2的子图网格
fig, axs = plt.subplots(2, 2, figsize=(12, 10))

# 在每个子图中绘制数据
for ax in axs.flat:
    ax.plot(x, y1, label='Sine - how2matplotlib.com')
    ax.plot(x, y2, label='Cosine - how2matplotlib.com')

# 创建一个新的轴对象来放置图例
fig.add_subplot(111, frameon=False)
plt.tick_params(labelcolor='none', top=False, bottom=False, left=False, right=False)

# 创建自定义样式的单一图例
handles, labels = ax.get_legend_handles_labels()
legend = plt.legend(handles, labels, loc='center',
                    fancybox=True, shadow=True, ncol=2,
                    fontsize='large', title='Legend Title',
                    title_fontsize='x-large')

# 设置图例边框颜色
legend.get_frame().set_edgecolor('gray')

plt.tight_layout()
plt.show()
Output:
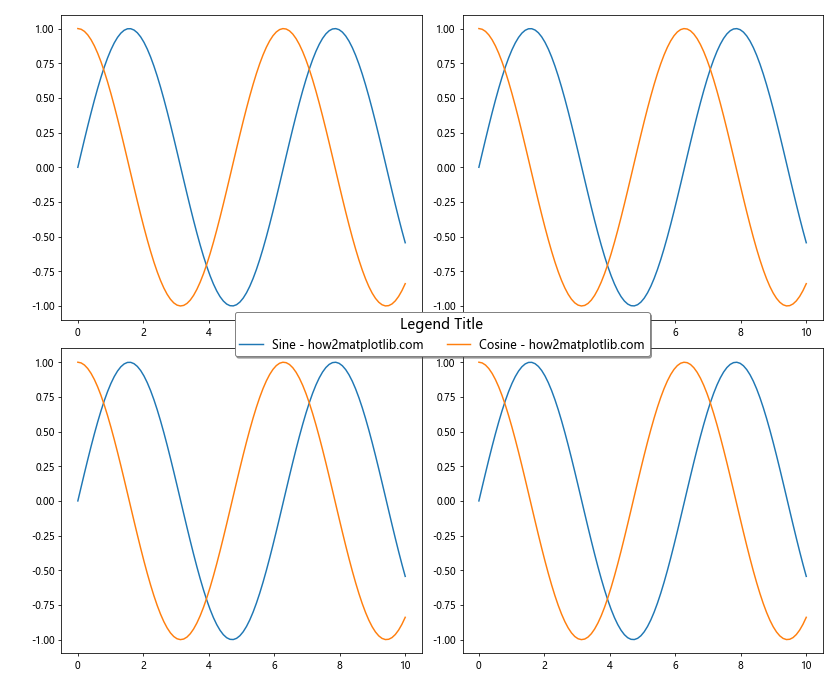
在这个示例中,我们使用了多个参数来自定义图例的样式,包括添加阴影、设置字体大小、添加标题等。
4.4 处理大量数据系列
当有大量数据系列时,单一图例可能会变得过大。在这种情况下,可以考虑使用多列布局或者只显示部分图例。以下是一个示例:
import matplotlib.pyplot as plt
import numpy as np

# 创建示例数据
x = np.linspace(0, 10, 100)
data = [np.sin(x + i) for i in range(10)]

# 创建3x3的子图网格
fig, axs = plt.subplots(3, 3, figsize=(15, 15))

# 在每个子图中绘制数据
for i, ax in enumerate(axs.flat):
    for j, y in enumerate(data):
        ax.plot(x, y, label=f'Series {j+1} - how2matplotlib.com')

# 创建一个新的轴对象来放置图例
fig.add_subplot(111, frameon=False)
plt.tick_params(labelcolor='none', top=False, bottom=False, left=False, right=False)

# 创建多列的单一图例
handles, labels = ax.get_legend_handles_labels()
plt.legend(handles, labels, loc='center', ncol=5, fontsize='small')

plt.tight_layout()
plt.show()
Output:
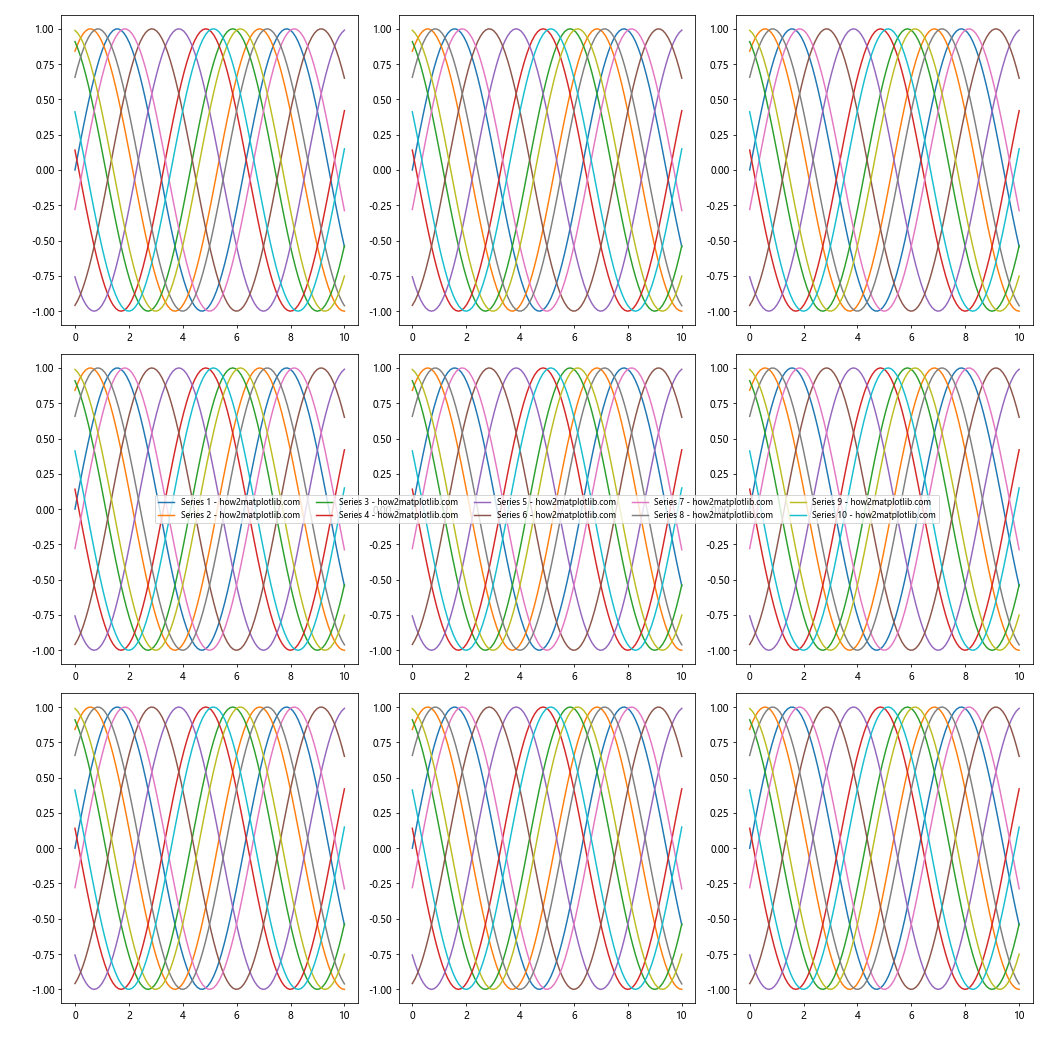
在这个示例中,我们使用ncol=5参数将图例分为5列,并使用fontsize='small'减小字体大小以适应更多的项目。
4.5 结合子图标题和单一图例
有时,你可能想要保留子图的标题,同时使用单一图例。以下是一个示例:
import matplotlib.pyplot as plt
import numpy as np

# 创建示例数据
x = np.linspace(0, 10, 100)
y1 = np.sin(x)
y2 = np.cos(x)

# 创建2x2的子图网格
fig, axs = plt.subplots(2, 2, figsize=(12, 10))

# 在每个子图中绘制数据并添加标题
titles = ['Spring', 'Summer', 'Autumn', 'Winter']
for ax, title in zip(axs.flat, titles):
    ax.plot(x, y1, label='Sine - how2matplotlib.com')
    ax.plot(x, y2, label='Cosine - how2matplotlib.com')
    ax.set_title(title)

# 创建一个新的轴对象来放置图例
fig.add_subplot(111, frameon=False)
plt.tick_params(labelcolor='none', top=False, bottom=False, left=False, right=False)

# 创建单一图例
handles, labels = ax.get_legend_handles_labels()
plt.legend(handles, labels, loc='center')

plt.tight_layout()
plt.show()
Output:
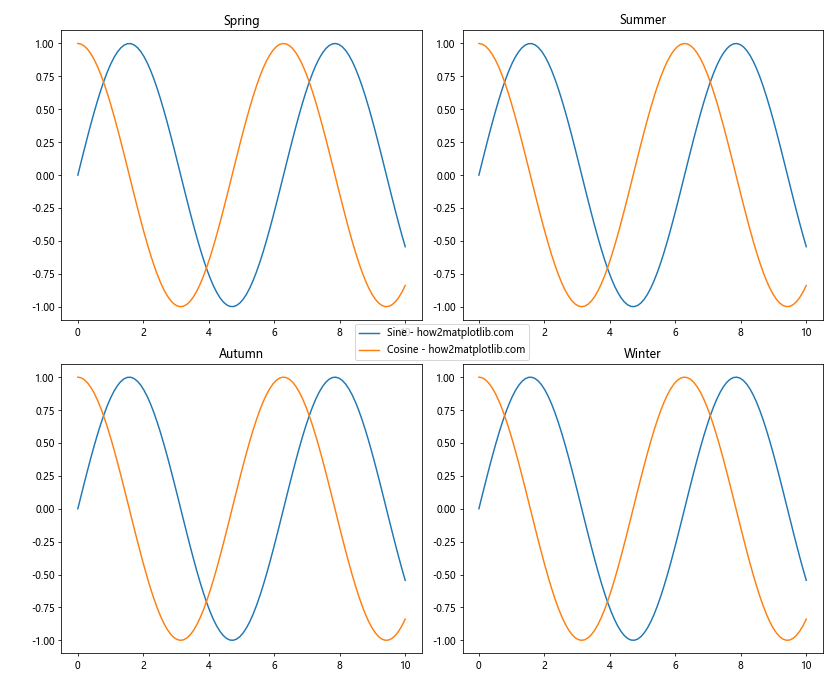
在这个示例中,我们为每个子图添加了一个标题,同时仍然使用单一图例来表示数据系列。
5. 常见问题和解决方案
5.1 图例遮挡有时,单一图例可能会遮挡部分子图内容。解决这个问题的一种方法是调整子图的布局。以下是一个示例:
import matplotlib.pyplot as plt
import numpy as np

# 创建示例数据
x = np.linspace(0, 10, 100)
y1 = np.sin(x)
y2 = np.cos(x)

# 创建2x2的子图网格,并留出空间给图例
fig, axs = plt.subplots(2, 2, figsize=(12, 10))
fig.subplots_adjust(right=0.85)  # 调整子图布局,为图例留出空间

# 在每个子图中绘制数据
for ax in axs.flat:
    ax.plot(x, y1, label='Sine - how2matplotlib.com')
    ax.plot(x, y2, label='Cosine - how2matplotlib.com')

# 创建单一图例并放置在右侧
handles, labels = ax.get_legend_handles_labels()
fig.legend(handles, labels, loc='center right')

plt.tight_layout()
plt.show()
Output:
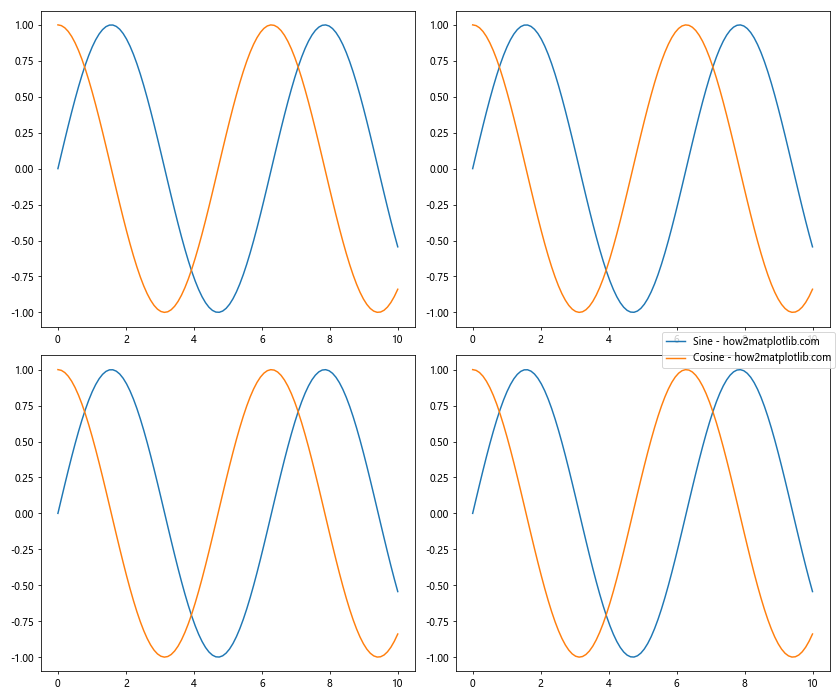
在这个示例中,我们使用fig.subplots_adjust(right=0.85)来调整子图的布局,为右侧的图例留出空间。然后,我们使用fig.legend()将图例放置在图形的右侧。
5.2 图例项目过多
当图例项目过多时,可能会导致图例过大或难以阅读。解决这个问题的一种方法是使用多列布局并调整字体大小。以下是一个示例:
import matplotlib.pyplot as plt
import numpy as np

# 创建示例数据
x = np.linspace(0, 10, 100)
data = [np.sin(x + i) for i in range(15)]

# 创建3x3的子图网格
fig, axs = plt.subplots(3, 3, figsize=(15, 15))

# 在每个子图中绘制数据
for i, ax in enumerate(axs.flat):
    for j, y in enumerate(data):
        ax.plot(x, y, label=f'Series {j+1} - how2matplotlib.com')

# 创建一个新的轴对象来放置图例
fig.add_subplot(111, frameon=False)
plt.tick_params(labelcolor='none', top=False, bottom=False, left=False, right=False)

# 创建多列的单一图例
handles, labels = ax.get_legend_handles_labels()
plt.legend(handles, labels, loc='center', ncol=5, fontsize='x-small',
           bbox_to_anchor=(0.5, -0.05), bbox_transform=plt.gcf().transFigure)

plt.tight_layout()
plt.show()
Output:
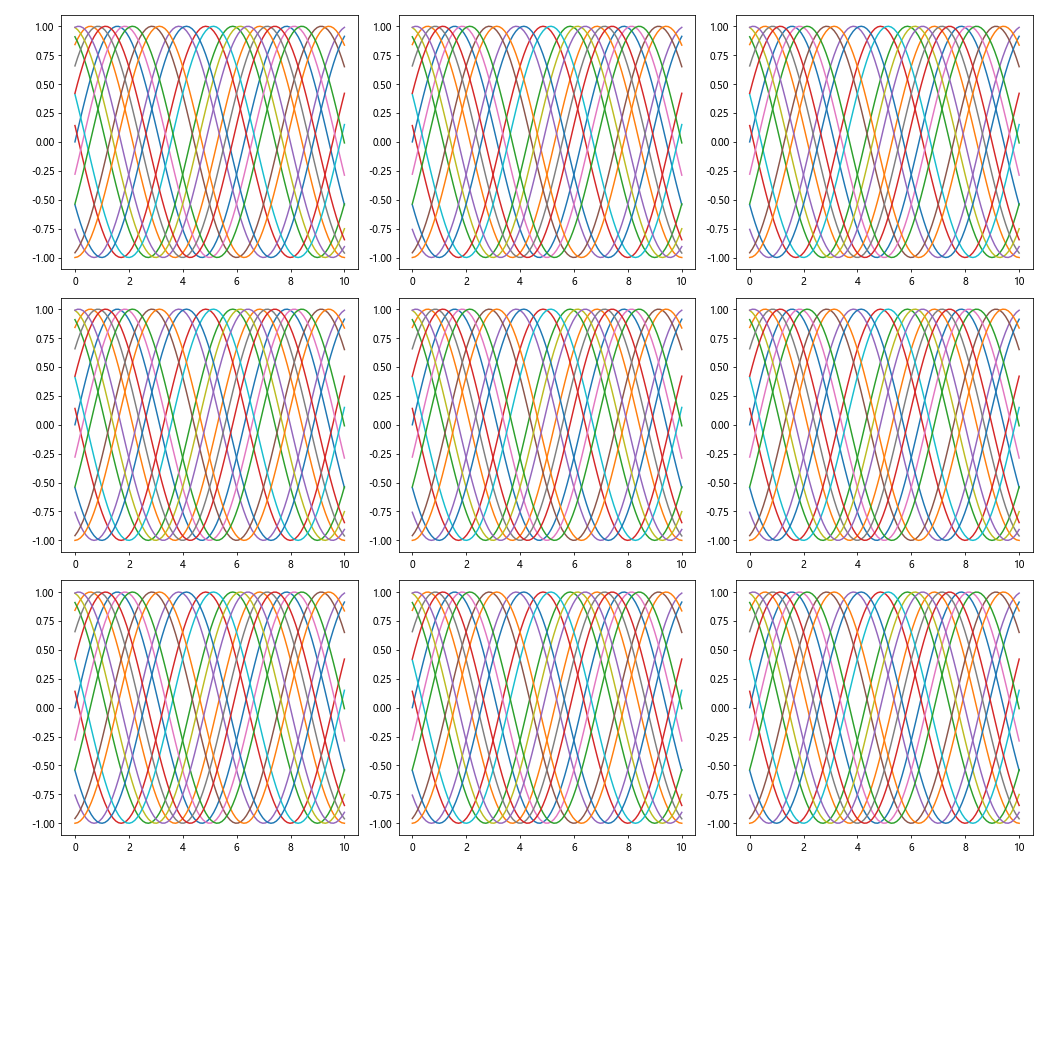
在这个示例中,我们使用ncol=5将图例分为5列,使用fontsize='x-small'减小字体大小,并使用bbox_to_anchor和bbox_transform参数将图例放置在图形的底部中心。
5.3 不同子图的图例顺序不一致
当不同子图中的数据系列顺序不一致时,可能会导致图例顺序混乱。解决这个问题的一种方法是手动指定图例顺序。以下是一个示例:
import matplotlib.pyplot as plt
import numpy as np

# 创建示例数据
x = np.linspace(0, 10, 100)
y1 = np.sin(x)
y2 = np.cos(x)
y3 = np.tan(x)

# 创建2x2的子图网格
fig, axs = plt.subplots(2, 2, figsize=(12, 10))

# 在每个子图中绘制数据,但顺序不同
axs[0, 0].plot(x, y1, label='Sine - how2matplotlib.com')
axs[0, 0].plot(x, y2, label='Cosine - how2matplotlib.com')
axs[0, 0].plot(x, y3, label='Tangent - how2matplotlib.com')

axs[0, 1].plot(x, y2, label='Cosine - how2matplotlib.com')
axs[0, 1].plot(x, y3, label='Tangent - how2matplotlib.com')
axs[0, 1].plot(x, y1, label='Sine - how2matplotlib.com')

axs[1, 0].plot(x, y3, label='Tangent - how2matplotlib.com')
axs[1, 0].plot(x, y1, label='Sine - how2matplotlib.com')
axs[1, 0].plot(x, y2, label='Cosine - how2matplotlib.com')

axs[1, 1].plot(x, y2, label='Cosine - how2matplotlib.com')
axs[1, 1].plot(x, y1, label='Sine - how2matplotlib.com')
axs[1, 1].plot(x, y3, label='Tangent - how2matplotlib.com')

# 创建一个新的轴对象来放置图例
fig.add_subplot(111, frameon=False)
plt.tick_params(labelcolor='none', top=False, bottom=False, left=False, right=False)

# 手动指定图例顺序
desired_order = ['Sine - how2matplotlib.com', 'Cosine - how2matplotlib.com', 'Tangent - how2matplotlib.com']
handles, labels = [], []
for label in desired_order:
    for ax in axs.flat:
        h, l = ax.get_legend_handles_labels()
        if label in l:
            index = l.index(label)
            handles.append(h[index])
            labels.append(label)
            break

# 创建单一图例
plt.legend(handles, labels, loc='center')

plt.tight_layout()
plt.show()
Output:
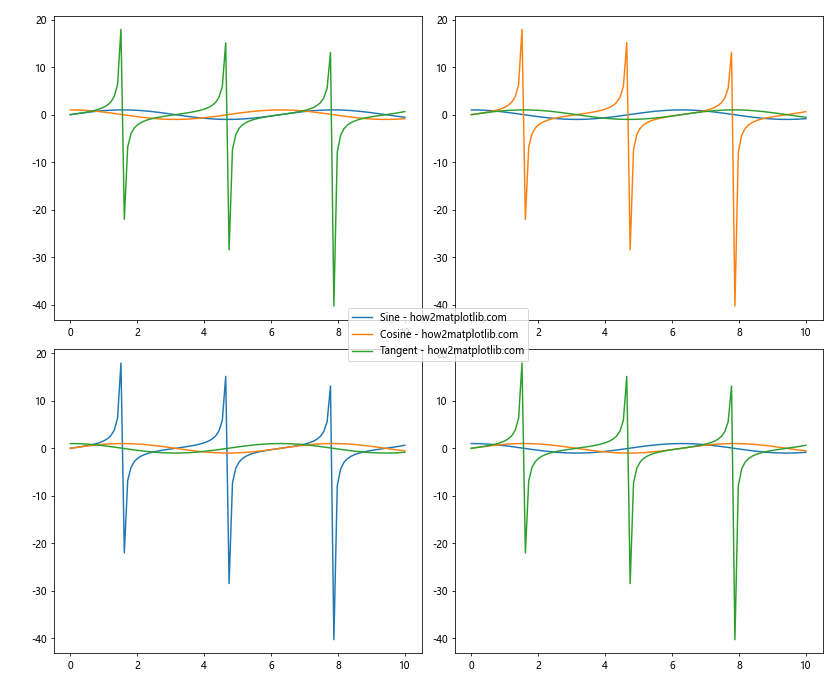
在这个示例中,我们首先定义了期望的图例顺序,然后遍历这个顺序,从子图中收集相应的句柄和标签。这样可以确保最终的图例顺序与我们期望的一致。
6. 高级应用
6.1 结合颜色映射
有时,你可能想要使用颜色映射来表示数据的某些属性。以下是一个结合颜色映射和单一图例的示例:
import matplotlib.pyplot as plt
import numpy as np

# 创建示例数据
x = np.linspace(0, 10, 100)
y = [np.sin(x + i) for i in range(5)]

# 创建颜色映射
cmap = plt.get_cmap('viridis')
colors = cmap(np.linspace(0, 1, len(y)))

# 创建2x2的子图网格
fig, axs = plt.subplots(2, 2, figsize=(12, 10))

# 在每个子图中绘制数据
for ax in axs.flat:
    for i, (yi, color) in enumerate(zip(y, colors)):
        ax.plot(x, yi, color=color, label=f'Series {i+1} - how2matplotlib.com')

# 创建一个新的轴对象来放置图例
fig.add_subplot(111, frameon=False)
plt.tick_params(labelcolor='none', top=False, bottom=False, left=False, right=False)

# 创建单一图例
handles, labels = ax.get_legend_handles_labels()
plt.legend(handles, labels, loc='center', title='Data Series')

# 添加颜色条
cbar_ax = fig.add_axes([0.95, 0.15, 0.02, 0.7])
sm = plt.cm.ScalarMappable(cmap=cmap, norm=plt.Normalize(0, len(y)-1))
sm.set_array([])
cbar = fig.colorbar(sm, cax=cbar_ax)
cbar.set_label('Series Index')

plt.tight_layout()
plt.show()
Output:
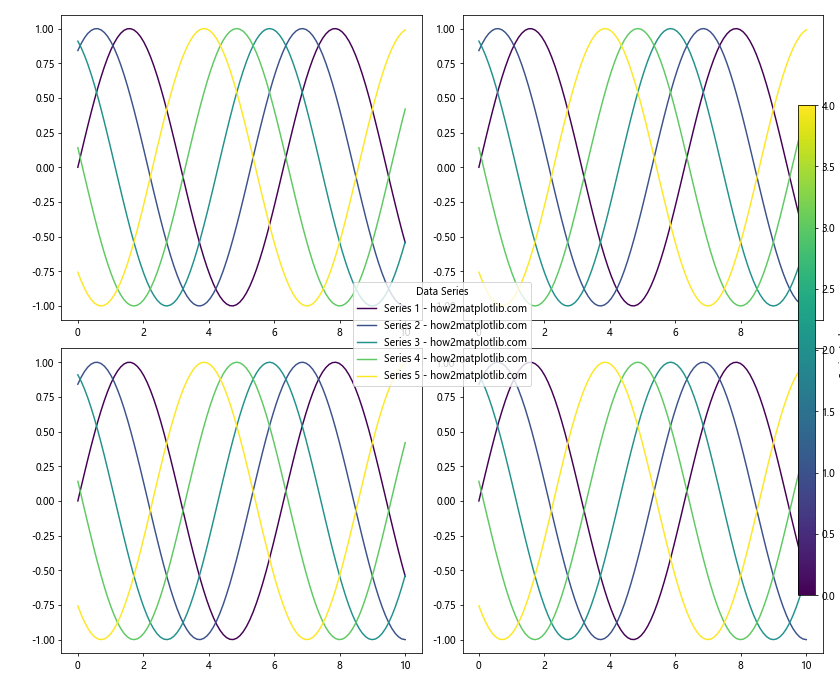
在这个示例中,我们使用颜色映射为每个数据系列分配不同的颜色,并添加了一个颜色条来显示颜色与系列索引的对应关系。
6.2 处理不同类型的图表
有时,你可能需要在同一个图形中组合不同类型的图表,如线图、散点图和条形图。以下是一个处理不同类型图表的示例:
import matplotlib.pyplot as plt
import numpy as np

# 创建示例数据
x = np.linspace(0, 10, 100)
y1 = np.sin(x)
y2 = np.cos(x)
y3 = np.random.rand(20)
y4 = np.random.rand(5)

# 创建2x2的子图网格
fig, axs = plt.subplots(2, 2, figsize=(12, 10))

# 在每个子图中绘制不同类型的图表
axs[0, 0].plot(x, y1, label='Sine - how2matplotlib.com')
axs[0, 0].plot(x, y2, label='Cosine - how2matplotlib.com')

axs[0, 1].scatter(np.random.rand(20), y3, label='Scatter - how2matplotlib.com')

axs[1, 0].bar(range(5), y4, label='Bar - how2matplotlib.com')

axs[1, 1].hist(np.random.randn(1000), bins=30, label='Histogram - how2matplotlib.com')

# 创建一个新的轴对象来放置图例
fig.add_subplot(111, frameon=False)
plt.tick_params(labelcolor='none', top=False, bottom=False, left=False, right=False)

# 收集所有子图的图例信息
handles, labels = [], []
for ax in axs.flat:
    h, l = ax.get_legend_handles_labels()
    handles.extend(h)
    labels.extend(l)

# 创建单一图例
plt.legend(handles, labels, loc='center', title='Chart Types')

plt.tight_layout()
plt.show()
Output:
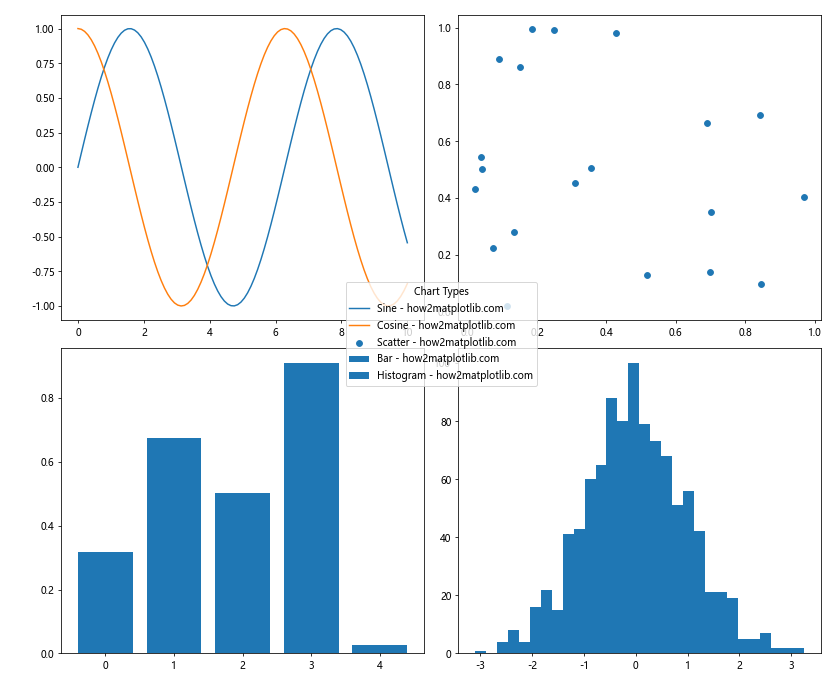
在这个示例中,我们在不同的子图中创建了线图、散点图、条形图和直方图,然后将它们的图例信息合并到一个单一的图例中。
6.3 动态更新图例
在某些情况下,你可能需要根据用户输入或其他条件动态更新图例。以下是一个动态更新图例的示例:
import matplotlib.pyplot as plt
import numpy as np
from matplotlib.widgets import CheckButtons

# 创建示例数据
x = np.linspace(0, 10, 100)
y1 = np.sin(x)
y2 = np.cos(x)
y3 = np.tan(x)

# 创建图形和子图
fig, ax = plt.subplots(figsize=(10, 8))

# 绘制所有线条
line1, = ax.plot(x, y1, label='Sine - how2matplotlib.com')
line2, = ax.plot(x, y2, label='Cosine - how2matplotlib.com')
line3, = ax.plot(x, y3, label='Tangent - how2matplotlib.com')

# 创建图例
legend = ax.legend(loc='upper right')

# 创建复选框
rax = plt.axes([0.05, 0.4, 0.1, 0.15])
check = CheckButtons(rax, ('Sine', 'Cosine', 'Tangent'), (True, True, True))

# 定义复选框回调函数
def func(label):
    if label == 'Sine':
        line1.set_visible(not line1.get_visible())
    elif label == 'Cosine':
        line2.set_visible(not line2.get_visible())
    elif label == 'Tangent':
        line3.set_visible(not line3.get_visible())

    # 更新图例
    handles, labels = [], []
    for line in (line1, line2, line3):
        if line.get_visible():
            handles.append(line)
            labels.append(line.get_label())
    legend.remove()
    ax.legend(handles, labels, loc='upper right')

    plt.draw()

check.on_clicked(func)

plt.show()
Output:
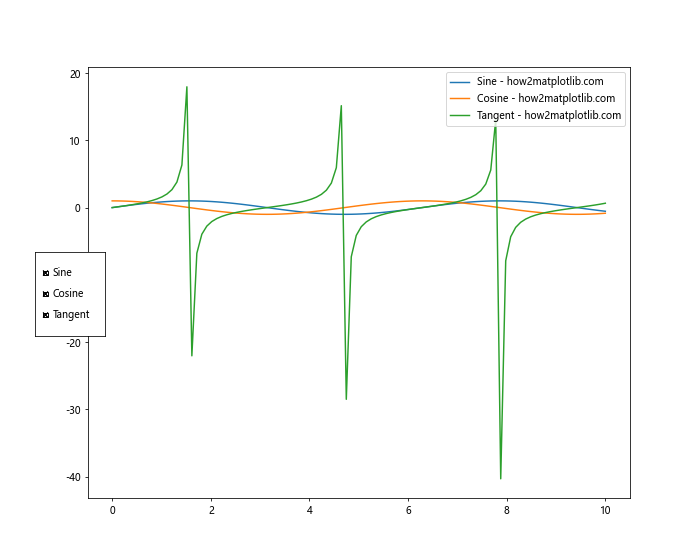
在这个示例中,我们创建了一个带有复选框的交互式图表。用户可以通过复选框来控制每条线的可见性,图例会相应地更新。
7. 总结
创建单一图例为所有子图是提高Matplotlib图表可读性和专业性的有效方法。通过本文介绍的各种技巧和示例,你应该能够处理大多数涉及单一图例的情况。记住以下几点:
- 使用
fig.add_subplot(111, frameon=False)创建一个覆盖整个图形的不可见轴来放置图例。 - 收集所有子图的图例信息,使用
plt.legend()创建单一图例。 - 根据需要调整图例的位置、样式和布局。
- 处理特殊情况,如图例遮挡、项目过多或顺序不一致等问题。
- 考虑结合颜色映射、不同类型的图表或动态更新等高级应用。
通过掌握这些技巧,你将能够创建更加清晰、专业和信息丰富的数据可视化图表。记住,好的图表不仅要准确地呈现数据,还要让观众能够轻松理解和解释这些数据。单一图例的使用可以大大提高你的图表的整体质量和可读性。
最后,不要忘记实践是提高技能的最好方法。尝试将本文中的技巧应用到你自己的数据可视化项目中,并根据具体需求进行调整和优化。随着经验的积累,你将能够更加自如地处理各种复杂的图表需求,创造出既美观又实用的数据可视化作品。
 极客教程
极客教程