Matplotlib散点图注释:全面指南与实用技巧
参考:How to Annotate Matplotlib Scatter Plots
Matplotlib是Python中最流行的数据可视化库之一,它提供了强大的工具来创建各种类型的图表,包括散点图。在数据分析和科学研究中,散点图是一种常用的可视化方法,用于展示两个变量之间的关系。然而,仅仅绘制散点图有时还不够,我们经常需要在图上添加注释来突出重要的数据点或解释特定的模式。本文将深入探讨如何在Matplotlib散点图中添加各种类型的注释,以增强图表的信息量和可读性。
1. 基础散点图绘制
在开始添加注释之前,让我们先回顾一下如何使用Matplotlib绘制基本的散点图。以下是一个简单的示例:
import matplotlib.pyplot as plt
import numpy as np

# 生成示例数据
np.random.seed(42)
x = np.random.rand(50)
y = np.random.rand(50)

# 创建散点图
plt.figure(figsize=(10, 6))
plt.scatter(x, y)
plt.title('Basic Scatter Plot - how2matplotlib.com')
plt.xlabel('X-axis')
plt.ylabel('Y-axis')
plt.show()
Output:
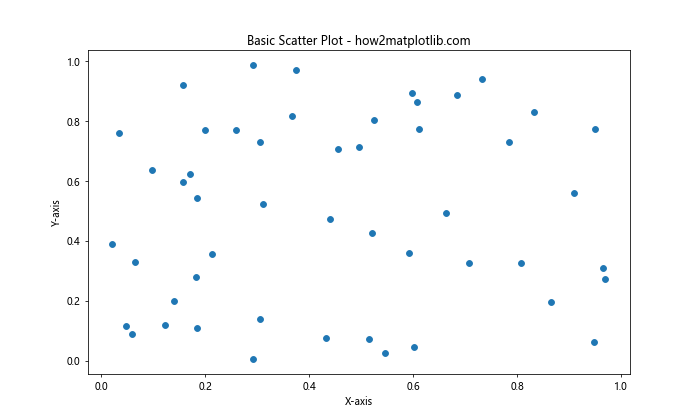
这段代码创建了一个基本的散点图,其中包含50个随机生成的数据点。plt.scatter()函数是创建散点图的核心,而plt.figure()、plt.title()、plt.xlabel()和plt.ylabel()则用于设置图表的大小和标签。
2. 文本注释
文本注释是最简单和最常用的注释类型之一。我们可以使用plt.annotate()函数在图表上添加文本注释。以下是一个示例:
import matplotlib.pyplot as plt
import numpy as np

np.random.seed(42)
x = np.random.rand(50)
y = np.random.rand(50)

plt.figure(figsize=(10, 6))
plt.scatter(x, y)

# 添加文本注释
plt.annotate('Interesting Point', xy=(0.5, 0.5), xytext=(0.6, 0.6),
             arrowprops=dict(facecolor='black', shrink=0.05),
             fontsize=12, ha='right', va='bottom')

plt.title('Scatter Plot with Text Annotation - how2matplotlib.com')
plt.xlabel('X-axis')
plt.ylabel('Y-axis')
plt.show()
Output:
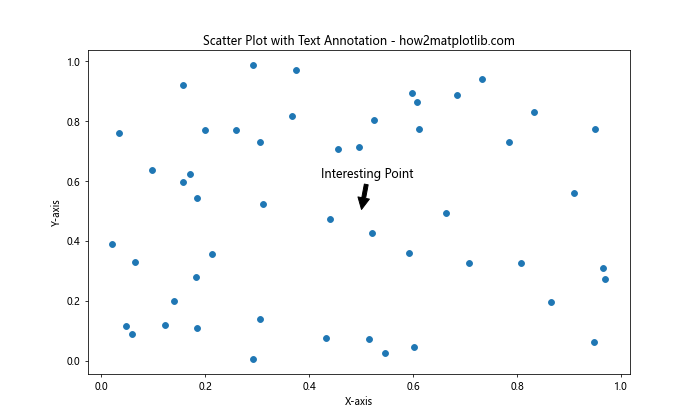
在这个例子中,我们使用plt.annotate()函数添加了一个指向(0.5, 0.5)点的文本注释。xy参数指定了箭头的目标位置,xytext参数指定了文本的位置,arrowprops参数用于自定义箭头的外观。fontsize、ha(水平对齐)和va(垂直对齐)参数用于调整文本的样式和位置。
3. 批量添加注释
有时我们需要为多个数据点添加注释。以下是一个批量添加注释的示例:
import matplotlib.pyplot as plt
import numpy as np

np.random.seed(42)
x = np.random.rand(10)
y = np.random.rand(10)
labels = [f'Point {i+1}' for i in range(10)]

plt.figure(figsize=(10, 6))
plt.scatter(x, y)

for i, label in enumerate(labels):
    plt.annotate(label, (x[i], y[i]), xytext=(5, 5), textcoords='offset points')

plt.title('Scatter Plot with Multiple Annotations - how2matplotlib.com')
plt.xlabel('X-axis')
plt.ylabel('Y-axis')
plt.show()
Output:
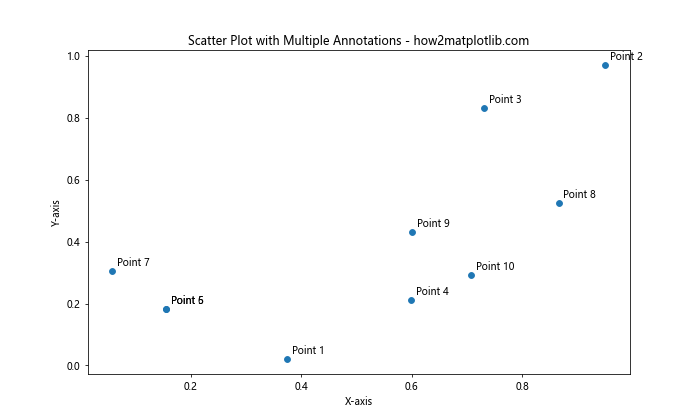
在这个例子中,我们为10个数据点添加了标签。我们使用了一个循环来遍历所有的数据点,并为每个点添加注释。xytext=(5, 5)和textcoords='offset points'参数用于将文本稍微偏移,以避免与数据点重叠。
4. 使用箭头注释
箭头注释可以更清晰地指出我们想要强调的特定数据点。以下是一个使用箭头注释的示例:
import matplotlib.pyplot as plt
import numpy as np

np.random.seed(42)
x = np.random.rand(50)
y = np.random.rand(50)

plt.figure(figsize=(10, 6))
plt.scatter(x, y)

# 添加箭头注释
plt.annotate('Maximum Value', xy=(max(x), max(y)), xytext=(0.8, 0.8),
             arrowprops=dict(facecolor='red', shrink=0.05),
             fontsize=12, ha='right', va='bottom')

plt.title('Scatter Plot with Arrow Annotation - how2matplotlib.com')
plt.xlabel('X-axis')
plt.ylabel('Y-axis')
plt.show()
Output:
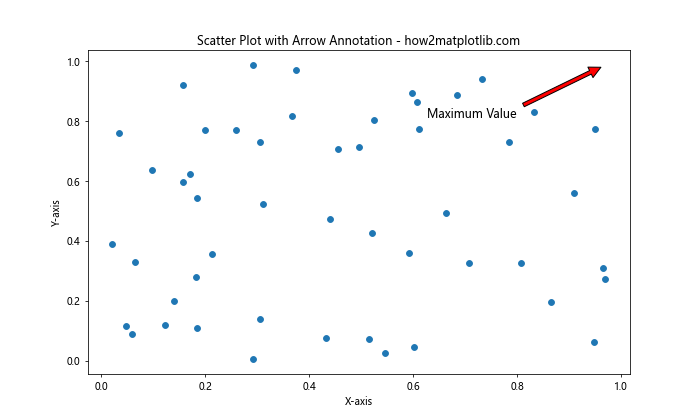
在这个例子中,我们使用箭头注释指向了数据集中的最大值点。arrowprops参数用于自定义箭头的外观,这里我们将箭头颜色设置为红色以使其更加醒目。
5. 添加文本框
有时,我们可能希望在注释周围添加一个文本框,以使其更加突出。以下是一个添加带文本框注释的示例:
import matplotlib.pyplot as plt
import numpy as np

np.random.seed(42)
x = np.random.rand(50)
y = np.random.rand(50)

plt.figure(figsize=(10, 6))
plt.scatter(x, y)

# 添加带文本框的注释
plt.annotate('Important Region', xy=(0.4, 0.4), xytext=(0.6, 0.6),
             bbox=dict(boxstyle="round", fc="0.8"),
             arrowprops=dict(arrowstyle="->"),
             fontsize=12, ha='center', va='center')

plt.title('Scatter Plot with Boxed Annotation - how2matplotlib.com')
plt.xlabel('X-axis')
plt.ylabel('Y-axis')
plt.show()
Output:
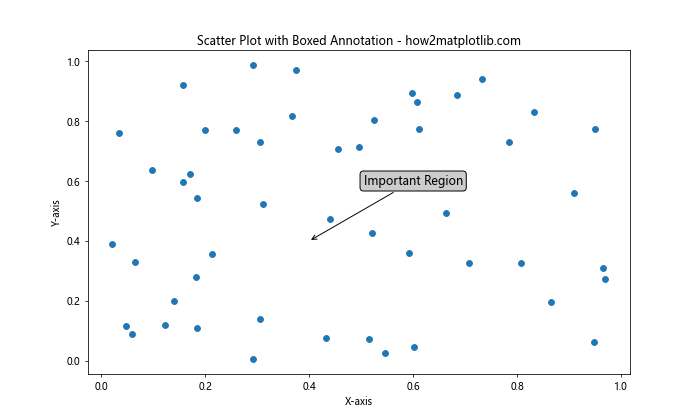
在这个例子中,我们使用bbox参数添加了一个圆角矩形文本框。boxstyle="round"指定了圆角矩形样式,fc="0.8"设置了文本框的填充颜色(灰色)。
6. 使用自定义样式
Matplotlib提供了丰富的自定义选项,允许我们创建独特的注释样式。以下是一个使用自定义样式的示例:
import matplotlib.pyplot as plt
import numpy as np

np.random.seed(42)
x = np.random.rand(50)
y = np.random.rand(50)

plt.figure(figsize=(10, 6))
plt.scatter(x, y)

# 添加自定义样式的注释
plt.annotate('Custom Style', xy=(0.5, 0.5), xytext=(0.7, 0.7),
             bbox=dict(boxstyle="rarrow,pad=0.3", fc="cyan", ec="b", lw=2),
             arrowprops=dict(arrowstyle="->", connectionstyle="arc3,rad=.2"),
             fontsize=12, fontweight='bold', color='navy',
             ha='center', va='center')

plt.title('Scatter Plot with Custom Style Annotation - how2matplotlib.com')
plt.xlabel('X-axis')
plt.ylabel('Y-axis')
plt.show()
Output:
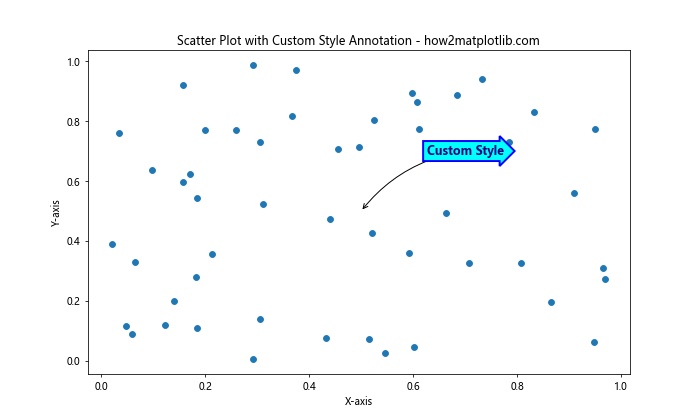
在这个例子中,我们使用了更复杂的bbox和arrowprops设置来创建一个独特的注释样式。boxstyle="rarrow,pad=0.3"创建了一个带箭头的文本框,fc="cyan"和ec="b"分别设置了填充颜色和边框颜色。arrowprops中的connectionstyle="arc3,rad=.2"创建了一个弯曲的箭头。
7. 添加数学公式
Matplotlib支持LaTeX语法,这使得我们可以在注释中添加数学公式。以下是一个包含数学公式的注释示例:
import matplotlib.pyplot as plt
import numpy as np

np.random.seed(42)
x = np.random.rand(50)
y = np.random.rand(50)

plt.figure(figsize=(10, 6))
plt.scatter(x, y)

# 添加包含数学公式的注释
plt.annotate(r'\frac{x^2 + y^2}{2} = 0.5', xy=(0.5, 0.5), xytext=(0.7, 0.7),
             bbox=dict(boxstyle="round", fc="white", ec="black", alpha=0.8),
             arrowprops=dict(arrowstyle="->"),
             fontsize=14, ha='center', va='center')

plt.title('Scatter Plot with Math Formula Annotation - how2matplotlib.com')
plt.xlabel('X-axis')
plt.ylabel('Y-axis')
plt.show()
Output:
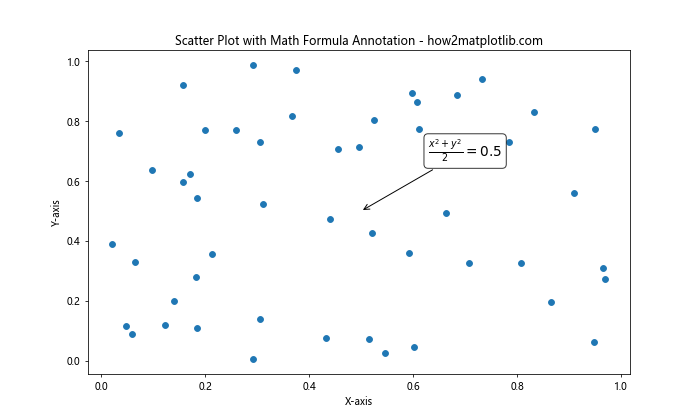
在这个例子中,我们使用LaTeX语法添加了一个数学公式。注意公式前面的r前缀,它表示这是一个原始字符串,可以避免反斜杠被误解为转义字符。
8. 动态注释位置
有时,我们可能需要根据数据动态确定注释的位置。以下是一个动态确定注释位置的示例:
import matplotlib.pyplot as plt
import numpy as np

np.random.seed(42)
x = np.random.rand(50)
y = np.random.rand(50)

plt.figure(figsize=(10, 6))
plt.scatter(x, y)

# 找到y值最大的点
max_index = np.argmax(y)
max_x, max_y = x[max_index], y[max_index]

# 动态确定注释位置
if max_x > 0.5:
    xytext = (max_x - 0.2, max_y)
else:
    xytext = (max_x + 0.2, max_y)

plt.annotate(f'Max Y: {max_y:.2f}', xy=(max_x, max_y), xytext=xytext,
             arrowprops=dict(arrowstyle="->", connectionstyle="arc3,rad=0.3"),
             bbox=dict(boxstyle="round", fc="yellow", ec="orange", alpha=0.8),
             fontsize=12, ha='center', va='center')

plt.title('Scatter Plot with Dynamic Annotation - how2matplotlib.com')
plt.xlabel('X-axis')
plt.ylabel('Y-axis')
plt.show()
Output:
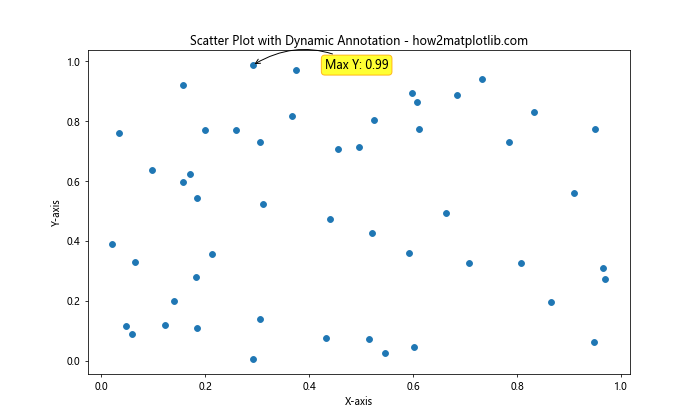
在这个例子中,我们首先找到y值最大的点,然后根据这个点的x坐标动态确定注释的位置。如果x坐标大于0.5,我们将注释放在左侧;否则,放在右侧。这样可以确保注释不会超出图表边界。
9. 使用颜色编码注释
我们可以使用颜色来编码注释,以传达额外的信息。以下是一个使用颜色编码注释的示例:
import matplotlib.pyplot as plt
import numpy as np

np.random.seed(42)
x = np.random.rand(50)
y = np.random.rand(50)

plt.figure(figsize=(10, 6))
scatter = plt.scatter(x, y, c=y, cmap='viridis')

# 添加颜色编码的注释
for i in range(5):
    plt.annotate(f'Point {i+1}', xy=(x[i], y[i]), xytext=(5, 5),
                 textcoords='offset points',
                 bbox=dict(boxstyle="round", fc=plt.cm.viridis(y[i]), alpha=0.8),
                 fontsize=10, ha='left', va='bottom')

plt.colorbar(scatter)
plt.title('Scatter Plot with Color-coded Annotations - how2matplotlib.com')
plt.xlabel('X-axis')
plt.ylabel('Y-axis')
plt.show()
Output:
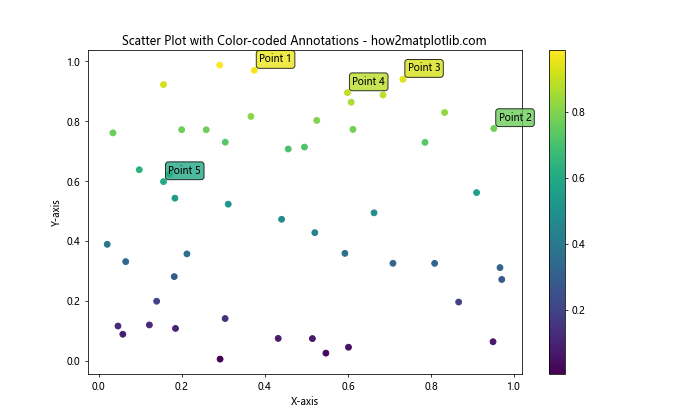
在这个例子中,我们使用viridis颜色映射来为散点图着色。然后,我们为前5个点添加注释,注释的背景色与对应点的颜色相匹配。这种方法可以直观地展示每个注释点在整体分布中的位置。
10. 添加图例注释
有时,我们可能想要使用图例来解释散点图中的不同类别。以下是一个结合图例和注释的示例:
import matplotlib.pyplot as plt
import numpy as np

np.random.seed(42)
x1 = np.random.rand(30)
y1 = np.random.rand(30)
x2 = np.random.rand(20)
y2 = np.random.rand(20)

plt.figure(figsize=(10, 6))
plt.scatter(x1, y1, c='blue', label='Group A')
plt.scatter(x2, y2, c='red', label='Group B')

# 添加图例
plt.legend()

# 为每组添加注释
plt.annotate('Group A Center', xy=(np.mean(x1), np.mean(y1)), xytext=(0.8, 0.8),
             arrowprops=dict(facecolor='blue', shrink=0.05),
             fontsize=12, ha='right', va='top')

plt.annotate('Group B Center', xy=(np.mean(x2), np.mean(y2)), xytext=(0.2, 0.2),
             arrowprops=dict(facecolor='red', shrink=0.05),
             fontsize=12, ha='left', va='bottom')

plt.title('Scatter Plot with Legend and Annotations - how2matplotlib.com')
plt.xlabel('X-axis')
plt.ylabel('Y-axis')
plt.show()
Output:
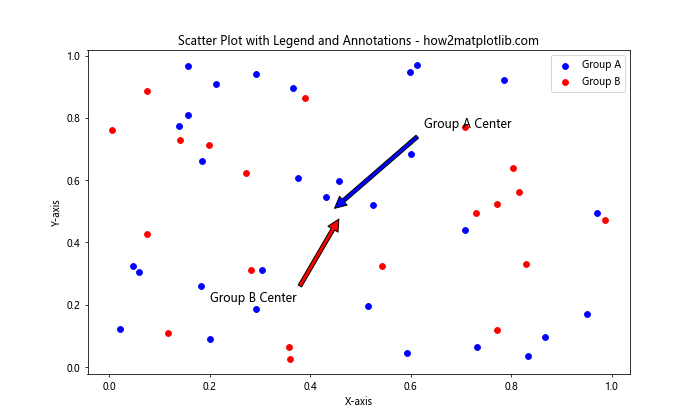
在这个例子中,我们创建了两组散点,并使用不同的颜色区分它们。我们添加了一个图例来解释颜色的含义,然后为每组的中心点添加了注释。这种方法可以帮助读者快速理解数据的整体分布和各组的特征。
11. 使用多行文本注释
有时,我们可能需要在注释中包含多行文本。Matplotlib允许我们轻松地创建多行注释。以下是一个示例:
import matplotlib.pyplot as plt
import numpy as np

np.random.seed(42)
x = np.random.rand(50)
y = np.random.rand(50)

plt.figure(figsize=(10, 6))
plt.scatter(x, y)

# 添加多行文本注释
plt.annotate('Multi-line\nAnnotation\nExample', xy=(0.5, 0.5), xytext=(0.7, 0.7),
             bbox=dict(boxstyle="round", fc="lightyellow", ec="orange", alpha=0.8),
             arrowprops=dict(arrowstyle="->", connectionstyle="arc3,rad=.2"),
             fontsize=12, ha='center', va='center')

plt.title('Scatter Plot with Multi-line Annotation - how2matplotlib.com')
plt.xlabel('X-axis')
plt.ylabel('Y-axis')
plt.show()
Output:
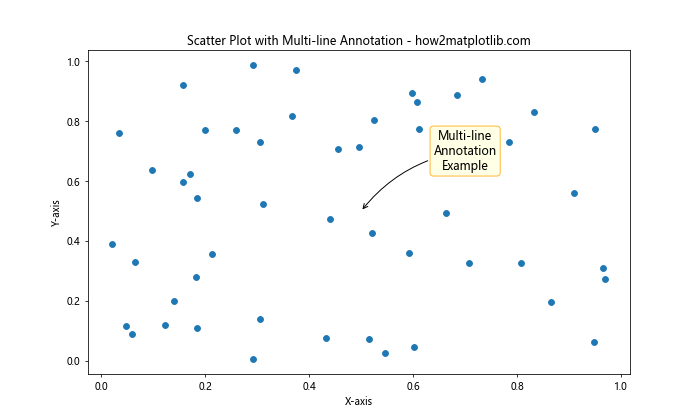
在这个例子中,我们使用\n字符来创建多行文本。注意,我们将ha和va参数设置为'center',以确保多行文本在文本框中居中对齐。
12. 添加带有阴影的注释
为注释添加阴影可以增加视觉深度,使注释在图表中更加突出。以下是一个带有阴影效果的注释示例:
import matplotlib.pyplot as plt
import numpy as np
from matplotlib.patheffects import withStroke

np.random.seed(42)
x = np.random.rand(50)
y = np.random.rand(50)

plt.figure(figsize=(10, 6))
plt.scatter(x, y)

# 添加带阴影的注释
annotation = plt.annotate('Shadowed Annotation', xy=(0.5, 0.5), xytext=(0.7, 0.7),
                          bbox=dict(boxstyle="round", fc="white", ec="gray", alpha=0.8),
                          arrowprops=dict(arrowstyle="->"),
                          fontsize=14, ha='center', va='center')

# 添加文本阴影效果
annotation.set_path_effects([withStroke(linewidth=3, foreground='gray')])

plt.title('Scatter Plot with Shadowed Annotation - how2matplotlib.com')
plt.xlabel('X-axis')
plt.ylabel('Y-axis')
plt.show()
Output:
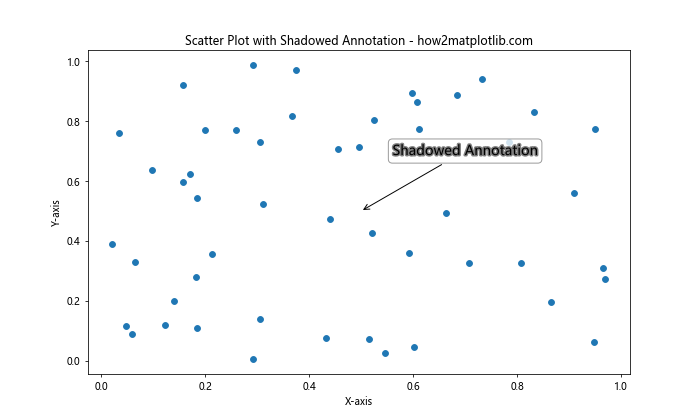
在这个例子中,我们使用matplotlib.patheffects.withStroke来为注释文本添加阴影效果。这种效果可以使注释在复杂的背景中更加清晰可见。
13. 使用极坐标系注释
虽然散点图通常使用笛卡尔坐标系,但有时我们可能需要在极坐标系中绘制散点图并添加注释。以下是一个在极坐标系中添加注释的示例:
import matplotlib.pyplot as plt
import numpy as np

np.random.seed(42)
r = np.random.rand(50)
theta = 2 * np.pi * np.random.rand(50)

fig, ax = plt.subplots(figsize=(10, 10), subplot_kw=dict(projection='polar'))
ax.scatter(theta, r)

# 在极坐标系中添加注释
ax.annotate('Polar Annotation', xy=(np.pi/4, 0.5), xytext=(np.pi/2, 0.7),
            arrowprops=dict(arrowstyle="->", connectionstyle="arc3,rad=.2"),
            bbox=dict(boxstyle="round", fc="lightyellow"),
            fontsize=12, ha='center', va='center')

plt.title('Polar Scatter Plot with Annotation - how2matplotlib.com')
plt.show()
Output:
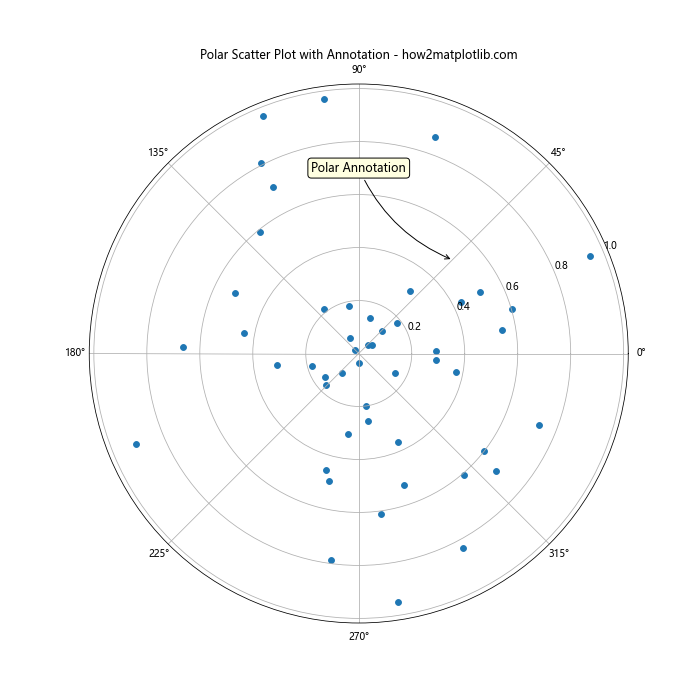
在这个例子中,我们使用极坐标系创建了一个散点图,并添加了一个注释。注意,在极坐标系中,xy和xytext参数使用角度和半径来指定位置。
14. 使用HTML样式的注释
Matplotlib支持在注释中使用有限的HTML样式,这可以帮助我们创建更丰富的文本格式。以下是一个使用HTML样式的注释示例:
import matplotlib.pyplot as plt
import numpy as np

np.random.seed(42)
x = np.random.rand(50)
y = np.random.rand(50)

plt.figure(figsize=(10, 6))
plt.scatter(x, y)

# 添加HTML样式的注释
plt.annotate('<b>Bold</b>\n<i>Italic</i>\n<u>Underline</u>', xy=(0.5, 0.5), xytext=(0.7, 0.7),
             bbox=dict(boxstyle="round", fc="white", ec="gray", alpha=0.8),
             arrowprops=dict(arrowstyle="->"),
             fontsize=12, ha='center', va='center',
             parse_math=False)  # 禁用数学解析以允许HTML标签

plt.title('Scatter Plot with HTML-style Annotation - how2matplotlib.com')
plt.xlabel('X-axis')
plt.ylabel('Y-axis')
plt.show()
Output:
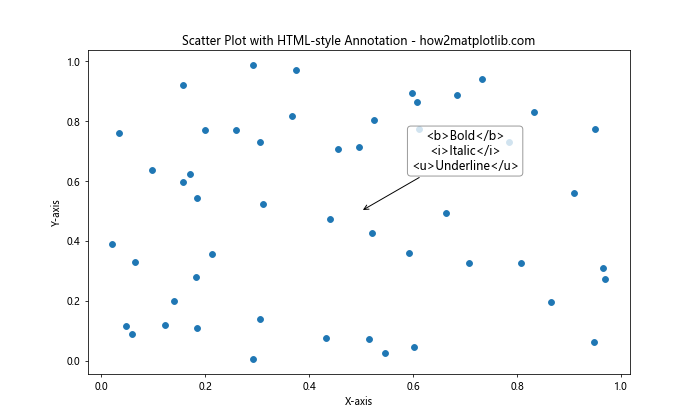
在这个例子中,我们使用HTML标签来创建粗体、斜体和下划线文本。注意,我们需要设置parse_math=False来禁用数学解析,以便HTML标签能够正确显示。
15. 添加带有自定义字体的注释
Matplotlib允许我们为注释使用自定义字体,这可以帮助我们创建独特的视觉效果。以下是一个使用自定义字体的注释示例:
import matplotlib.pyplot as plt
import numpy as np
from matplotlib import font_manager

# 添加自定义字体(请确保您的系统中有这个字体)
font_path = '/path/to/your/custom/font.ttf'  # 替换为实际的字体文件路径
custom_font = font_manager.FontProperties(fname=font_path)

np.random.seed(42)
x = np.random.rand(50)
y = np.random.rand(50)

plt.figure(figsize=(10, 6))
plt.scatter(x, y)

# 添加使用自定义字体的注释
plt.annotate('Custom Font Annotation', xy=(0.5, 0.5), xytext=(0.7, 0.7),
             bbox=dict(boxstyle="round", fc="lightblue", ec="blue", alpha=0.8),
             arrowprops=dict(arrowstyle="->"),
             fontsize=14, ha='center', va='center',
             fontproperties=custom_font)

plt.title('Scatter Plot with Custom Font Annotation - how2matplotlib.com')
plt.xlabel('X-axis')
plt.ylabel('Y-axis')
plt.show()
在这个例子中,我们首先加载了一个自定义字体文件,然后在annotate函数中使用fontproperties参数应用这个字体。请注意,您需要将font_path替换为实际的字体文件路径。
16. 使用注释高亮特定区域
有时,我们可能想要高亮散点图中的特定区域。我们可以使用注释来实现这一点。以下是一个示例:
import matplotlib.pyplot as plt
import numpy as np

np.random.seed(42)
x = np.random.rand(50)
y = np.random.rand(50)

plt.figure(figsize=(10, 6))
plt.scatter(x, y)

# 添加高亮区域
highlight = plt.Circle((0.5, 0.5), 0.2, fill=False, edgecolor='red', linestyle='--', linewidth=2)
plt.gca().add_artist(highlight)

# 添加说明注释
plt.annotate('Highlighted Region', xy=(0.5, 0.7), xytext=(0.7, 0.8),
             arrowprops=dict(arrowstyle="->", connectionstyle="arc3,rad=.2"),
             bbox=dict(boxstyle="round", fc="white", ec="gray", alpha=0.8),
             fontsize=12, ha='center', va='center')

plt.title('Scatter Plot with Highlighted Region - how2matplotlib.com')
plt.xlabel('X-axis')
plt.ylabel('Y-axis')
plt.show()
Output:
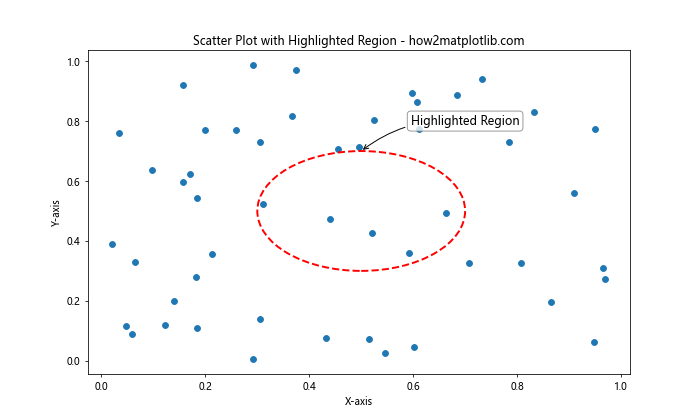
在这个例子中,我们使用plt.Circle创建了一个圆形区域来高亮特定的点群,然后添加了一个注释来解释这个高亮区域的意义。
17. 使用注释创建图例
虽然Matplotlib提供了内置的图例功能,但有时我们可能想要创建更自定义的图例。我们可以使用注释来实现这一点。以下是一个示例:
import matplotlib.pyplot as plt
import numpy as np

np.random.seed(42)
x1 = np.random.rand(30)
y1 = np.random.rand(30)
x2 = np.random.rand(30)
y2 = np.random.rand(30)

plt.figure(figsize=(10, 6))
plt.scatter(x1, y1, c='blue', label='Group A')
plt.scatter(x2, y2, c='red', label='Group B')

# 使用注释创建自定义图例
plt.annotate('Group A', xy=(0.05, 0.95), xycoords='axes fraction',
             fontsize=12, ha='left', va='top',
             bbox=dict(boxstyle="round", fc="white", ec="blue", alpha=0.8))
plt.annotate('Group B', xy=(0.05, 0.85), xycoords='axes fraction',
             fontsize=12, ha='left', va='top',
             bbox=dict(boxstyle="round", fc="white", ec="red", alpha=0.8))

plt.title('Scatter Plot with Custom Legend using Annotations - how2matplotlib.com')
plt.xlabel('X-axis')
plt.ylabel('Y-axis')
plt.show()
Output:
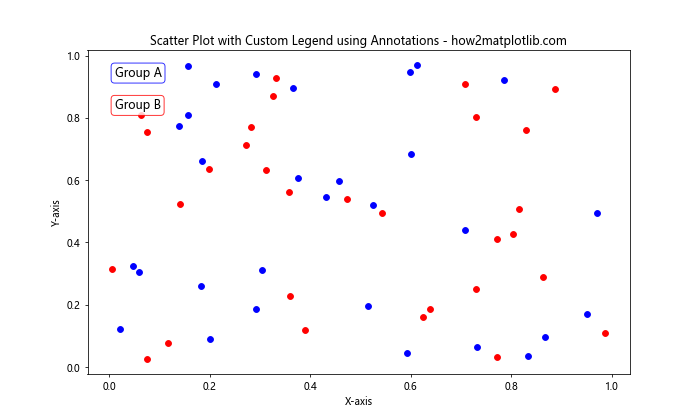
在这个例子中,我们使用注释创建了一个自定义的图例。通过设置xycoords='axes fraction',我们可以相对于图表的大小来定位这些注释。
18. 添加交互式注释
Matplotlib还支持添加交互式注释,这在Jupyter Notebook等交互式环境中特别有用。以下是一个添加交互式注释的示例:
import matplotlib.pyplot as plt
import numpy as np
from matplotlib.widgets import AnnotationBbox, TextBox

np.random.seed(42)
x = np.random.rand(50)
y = np.random.rand(50)

fig, ax = plt.subplots(figsize=(10, 6))
ax.scatter(x, y)

# 创建一个可拖动的注释
annotation = AnnotationBbox(TextBox(ax, "Drag me!", boxstyle="round,pad=0.5"),
                            xy=(0.5, 0.5), xycoords='data',
                            boxcoords="offset points",
                            box_alignment=(0.5, 0.5),
                            bboxprops=dict(boxstyle="round", fc="w", ec="0.5", alpha=0.9),
                            arrowprops=dict(arrowstyle="->"))
ax.add_artist(annotation)

plt.title('Scatter Plot with Interactive Annotation - how2matplotlib.com')
plt.xlabel('X-axis')
plt.ylabel('Y-axis')
plt.show()
在这个例子中,我们创建了一个可拖动的注释框。在支持交互的环境中,用户可以点击并拖动这个注释框到图表的任何位置。
19. 使用注释创建数据标签
有时,我们可能想要为散点图中的每个点添加数据标签。我们可以使用注释来实现这一点。以下是一个示例:
import matplotlib.pyplot as plt
import numpy as np

np.random.seed(42)
x = np.random.rand(10)
y = np.random.rand(10)
labels = [f'P{i}' for i in range(10)]

plt.figure(figsize=(10, 6))
plt.scatter(x, y)

for i, label in enumerate(labels):
    plt.annotate(label, (x[i], y[i]), xytext=(5, 5), textcoords='offset points',
                 bbox=dict(boxstyle="round", fc="white", ec="gray", alpha=0.8),
                 fontsize=10, ha='left', va='bottom')

plt.title('Scatter Plot with Data Labels - how2matplotlib.com')
plt.xlabel('X-axis')
plt.ylabel('Y-axis')
plt.show()
Output:
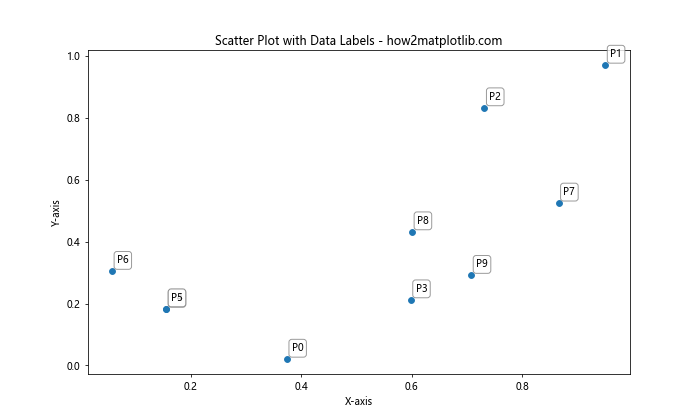
在这个例子中,我们为每个数据点添加了一个标签。通过使用循环和annotate函数,我们可以轻松地为大量数据点添加标签。
20. 结合多种注释技巧
最后,让我们来看一个结合了多种注释技巧的综合示例:
import matplotlib.pyplot as plt
import numpy as np

np.random.seed(42)
x = np.random.rand(50)
y = np.random.rand(50)

fig, ax = plt.subplots(figsize=(12, 8))
scatter = ax.scatter(x, y, c=y, cmap='viridis')

# 添加颜色条
plt.colorbar(scatter)

# 添加文本注释
ax.annotate('Text Annotation', xy=(0.2, 0.8), xytext=(0.4, 0.9),
            arrowprops=dict(arrowstyle="->", connectionstyle="arc3,rad=.2"),
            bbox=dict(boxstyle="round", fc="white", ec="gray", alpha=0.8),
            fontsize=12, ha='center', va='center')

# 添加数学公式
ax.annotate(r'\frac{x^2 + y^2}{2} = 0.5', xy=(0.6, 0.2), xytext=(0.8, 0.3),
            bbox=dict(boxstyle="round", fc="lightyellow",ec="orange", alpha=0.8),
            arrowprops=dict(arrowstyle="->"),
            fontsize=14, ha='center', va='center')

# 高亮特定区域
highlight = plt.Circle((0.5, 0.5), 0.2, fill=False, edgecolor='red', linestyle='--', linewidth=2)
ax.add_artist(highlight)

# 添加说明注释
ax.annotate('Highlighted Region', xy=(0.5, 0.7), xytext=(0.7, 0.8),
            arrowprops=dict(arrowstyle="->", connectionstyle="arc3,rad=.2"),
            bbox=dict(boxstyle="round", fc="white", ec="gray", alpha=0.8),
            fontsize=12, ha='center', va='center')

# 添加HTML样式的注释
ax.annotate('<b>Bold</b>\n<i>Italic</i>\n<u>Underline</u>', xy=(0.8, 0.6), xytext=(0.9, 0.7),
            bbox=dict(boxstyle="round", fc="white", ec="gray", alpha=0.8),
            fontsize=12, ha='center', va='center',
            parse_math=False)

plt.title('Comprehensive Scatter Plot with Various Annotations - how2matplotlib.com')
plt.xlabel('X-axis')
plt.ylabel('Y-axis')
plt.show()
Output:
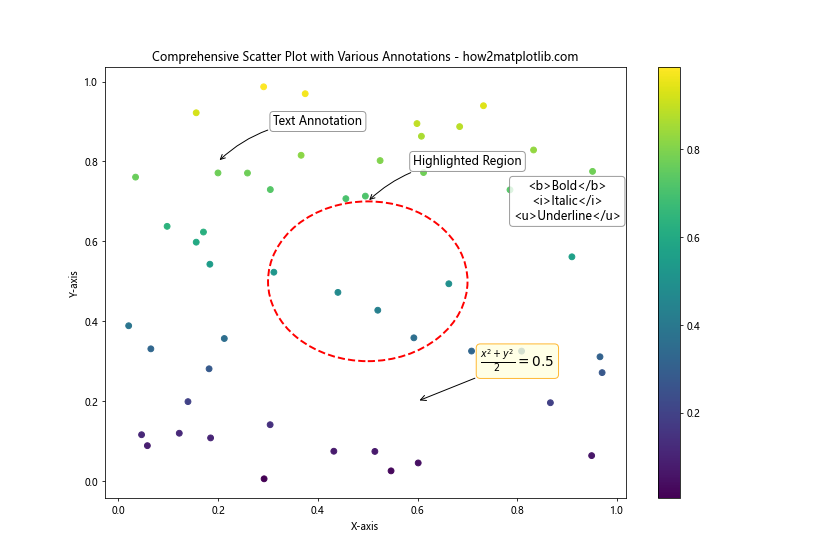
这个综合示例结合了多种注释技巧,包括文本注释、数学公式、区域高亮、HTML样式注释等。这展示了如何在一个图表中使用多种注释方法来传达复杂的信息。
结论
在本文中,我们深入探讨了如何在Matplotlib散点图中添加各种类型的注释。从基本的文本注释到复杂的交互式注释,我们涵盖了广泛的技巧和方法。这些注释技巧不仅可以增强图表的信息量,还可以提高图表的可读性和吸引力。
以下是一些关键要点:
- 文本注释是最基本和常用的注释类型,可以使用
plt.annotate()函数轻松添加。 -
箭头注释可以清晰地指出特定的数据点或区域。
-
使用文本框可以使注释更加突出。
-
Matplotlib支持LaTeX语法,允许在注释中添加复杂的数学公式。
-
可以使用颜色编码来传达额外的信息。
-
多行文本注释和HTML样式可以创建更丰富的文本格式。
-
自定义字体可以为注释添加独特的视觉效果。
-
交互式注释在某些环境中特别有用。
-
注释可以用来创建自定义图例或数据标签。
-
结合多种注释技巧可以创建信息丰富、视觉吸引力强的图表。
通过掌握这些技巧,你可以创建更加专业、信息丰富的散点图,有效地传达你的数据洞察。记住,好的数据可视化不仅仅是展示数据,更是讲述数据背后的故事。适当的注释可以帮助你更好地讲述这个故事。
最后,建议在使用这些技巧时要适度。过多或过于复杂的注释可能会使图表变得杂乱,反而降低了可读性。始终要考虑你的目标受众和你想要传达的核心信息,选择最适合的注释方式。通过实践和反馈,你将能够找到在信息量和视觉清晰度之间的最佳平衡。
 极客教程
极客教程