如何在matplotlib中添加图例
参考:how to add a legend in matplotlib
Matplotlib是一个用于创建可视化图表的Python库,图例是图表中的关键组成部分,能够帮助我们更好地理解图表中的数据。本文将详细介绍如何在Matplotlib中添加图例,让您的可视化图表更加清晰易懂。
1. 在图表中添加基本图例
要在Matplotlib中添加图例,我们可以使用legend()方法。下面是一个简单的例子:
import matplotlib.pyplot as plt

x = [1, 2, 3, 4, 5]
y = [2, 4, 6, 8, 10]

plt.plot(x, y, label='Line 1')
plt.legend()
plt.show()
Output:
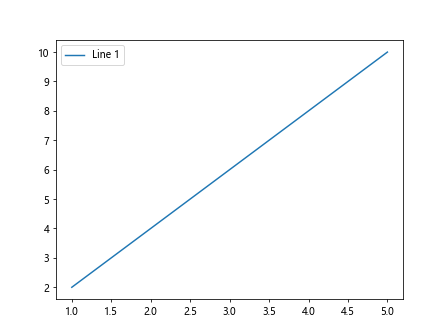
在这个例子中,我们创建了一个简单的折线图,并使用label参数为图例指定标签。然后通过调用legend()方法,将图例添加到图表中。
2. 调整图例的位置和样式
我们还可以调整图例的位置和样式,以便更好地展示数据。下面是一个示例代码:
import matplotlib.pyplot as plt

x = [1, 2, 3, 4, 5]
y1 = [2, 4, 6, 8, 10]
y2 = [1, 3, 5, 7, 9]

plt.plot(x, y1, label='Line 1')
plt.plot(x, y2, label='Line 2')
plt.legend(loc='upper right', fontsize='large')
plt.show()
Output:
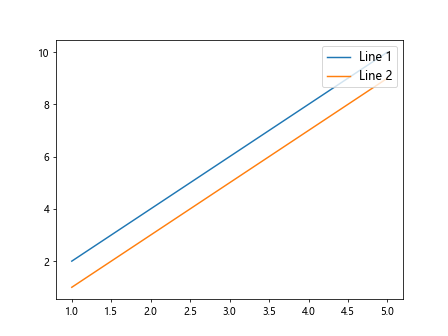
在这个例子中,我们通过loc参数指定了图例的位置为右上角,通过fontsize参数设置了图例的字体大小为large。
3. 自定义图例文本和标签
有时候,我们需要对图例的文本和标签进行一些自定义。下面是一个示例代码:
import matplotlib.pyplot as plt

x = [1, 2, 3, 4, 5]
y = [2, 4, 6, 8, 10]

plt.plot(x, y, label='Line 1')
plt.legend(title='Legend Title', title_fontsize='large', shadow=True)
plt.show()
Output:
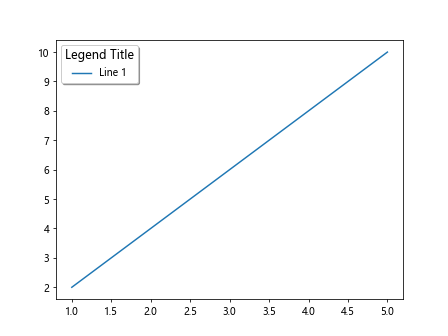
在这个例子中,我们通过title参数为图例添加了标题,并通过title_fontsize参数设置了标题的字体大小为large,还通过shadow参数添加了图例的阴影效果。
4. 多种图例
有时候,我们可能需要在一个图表中添加多个图例,以展示不同组数据的比较。下面是一个示例代码:
import numpy as np
import matplotlib.pyplot as plt

x = np.linspace(0, 10, 100)
y1 = np.sin(x)
y2 = np.cos(x)

plt.plot(x, y1, label='Sin Function')
plt.plot(x, y2, label='Cos Function')
plt.legend()
plt.legend(['Sin Function', 'Cos Function'], loc='upper right')
plt.show()
Output:
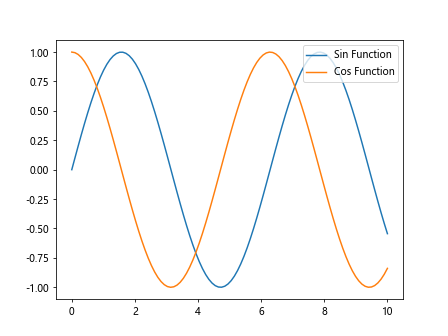
在这个例子中,我们绘制了正弦函数和余弦函数的图表,并为每个函数添加了图例。然后我们通过传入包含图例标签的列表,为图例添加了自定义的标签。
5. 使用图形标记标记图例
有时候,我们希望对图例使用不同的图形标记进行标记,以区分不同的数据系列。下面是一个示例代码:
import matplotlib.pyplot as plt

x = [1, 2, 3, 4, 5]
y1 = [2, 4, 6, 8, 10]
y2 = [1, 3, 5, 7, 9]

plt.plot(x, y1, label='Line 1', marker='o')
plt.plot(x, y2, label='Line 2', marker='x')
plt.legend()
plt.show()
Output:
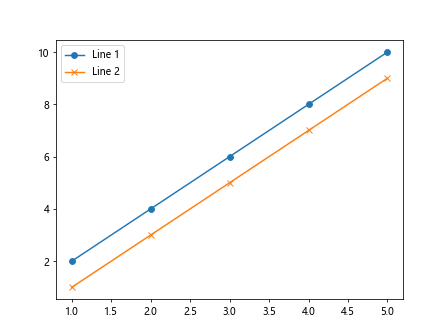
在这个例子中,我们为每个数据系列指定了不同的图形标记,用以在图例中进行标记。
6. 在不同子图中添加图例
有时候,我们会在一个图表中包含多个子图,我们可以为每个子图分别添加图例。下面是一个示例代码:
import matplotlib.pyplot as plt

fig, ax = plt.subplots(2)

x = [1, 2, 3, 4, 5]
y1 = [2, 4, 6, 8, 10]
y2 = [1, 3, 5, 7, 9]

ax[0].plot(x, y1, label='Line 1')
ax[1].plot(x, y2, label='Line 2')
ax[0].legend()
ax[1].legend()
plt.show()
Output:
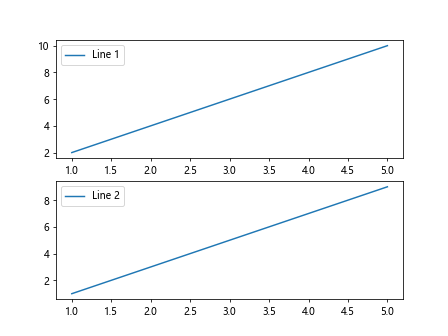
在这个例子中,我们创建了一个包含两个子图的图表,并为每个子图分别添加了图例。
7. 隐藏图例
有时候,我们可能需要隐藏图例,以便更好地展示数据。下面是一个示例代码:
import matplotlib.pyplot as plt

x = [1, 2, 3, 4, 5]
y = [2, 4, 6, 8, 10]

plt.plot(x, y, label='Line 1')
plt.legend().set_visible(False)
plt.show()
Output:
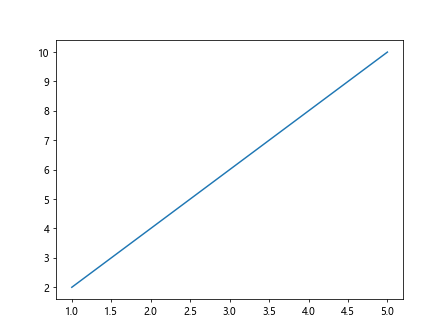
在这个例子中,我们通过set_visible(False)方法隐藏了图例,从而使图表中不显示图例。
8. 改变图例的边框样式和填充
有时候,我们希望改变图例的边框样式和填充,以使图例更加美观。下面是一个示例代码:
import matplotlib.pyplot as plt

x = [1, 2, 3, 4, 5]
y = [2, 4, 6, 8, 10]

plt.plot(x, y, label='Line 1')
plt.legend(frameon=True, framealpha=0.5, fancybox=True)
plt.show()
Output:
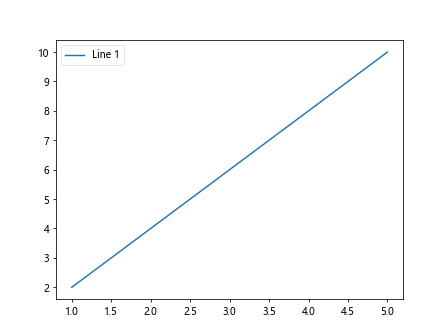
在这个例子中,我们通过frameon参数设置了是否显示图例的边框,通过framealpha参数设置了图例的透明度,通过fancybox参数使图例更具立体感。
9. 使用ncol参数设置图例的列数
有时候,我们的图例项过多,可以使用ncol参数来设置图例的列数,以使图例更加清晰。下面是一个示例代码:
import matplotlib.pyplot as plt

x = [1, 2, 3, 4, 5]
y1 = [2, 4, 6, 8, 10]
y2 = [1, 3, 5, 7, 9]

plt.plot(x, y1, label='Line 1')
plt.plot(x, y2, label='Line 2')
plt.legend(ncol=2)
plt.show()
Output:
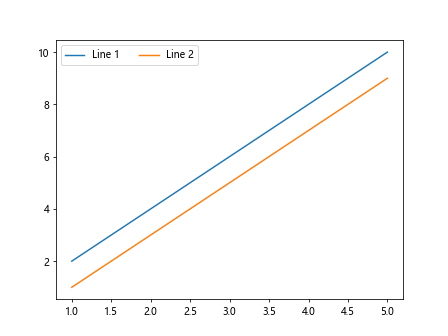
在这个例子中,我们通过ncol参数设置了图例的列数为2,使图例在两列中展示。
10. 设置图例的标题位置
有时候,我们需要移动图例的标题位置,以更好地与图例项对齐。下面是一个示例代码:
import matplotlib.pyplot as plt

x = [1, 2, 3, 4, 5]
y = [2, 4, 6, 8, 10]

plt.plot(x, y, label='Line 1')
plt.legend(title='Legend Title')
plt.gca().get_legend().set_title_position('left')
plt.show()
在这个例子中,我们使用set_title_position()方法将图例标题移动到图例项的左侧位置。
通过以上示例,我们详细介绍了在Matplotlib中如何添加图例,并展示了各种不同场景下的图例设置和使用方法。通过灵活运用这些技巧,您可以更好地展示数据,使可视化图表更加直观和易懂。
结语
本文详细介绍了如何在Matplotlib中添加图例,包括基本图例的添加、调整位置和样式、自定义文本和标签、多种图例的处理、使用图形标记标记图例、在不同子图中添加图例、隐藏图例、改变图例的边框样式和填充、使用ncol参数设置图例的列数以及设置图例的标题位置等技巧。
 极客教程
极客教程