Matplotlib中如何调整图例条目之间的垂直间距
参考:How Change the vertical spacing between legend entries in Matplotlib
Matplotlib是Python中最流行的数据可视化库之一,它提供了丰富的绘图功能和自定义选项。在使用Matplotlib创建图表时,图例(Legend)是一个重要的组成部分,它帮助读者理解图表中不同元素的含义。有时,我们可能需要调整图例中各个条目之间的垂直间距,以提高可读性或适应特定的布局需求。本文将详细介绍如何在Matplotlib中改变图例条目之间的垂直间距,并提供多个实用的示例代码。
1. 图例的基本概念
在深入探讨如何调整图例条目间距之前,我们先来了解一下Matplotlib中图例的基本概念。
图例是一个用于解释图表中各种元素含义的组件。它通常包含一系列标记和对应的文本说明,帮助读者理解图表中不同线条、点或区域所代表的含义。
在Matplotlib中,我们可以使用legend()方法来添加图例。以下是一个简单的示例:
import matplotlib.pyplot as plt

plt.figure(figsize=(8, 6))
plt.plot([1, 2, 3, 4], [1, 4, 2, 3], label='Line 1')
plt.plot([1, 2, 3, 4], [2, 3, 4, 1], label='Line 2')
plt.title('How to add a legend in Matplotlib - how2matplotlib.com')
plt.legend()
plt.show()
Output:
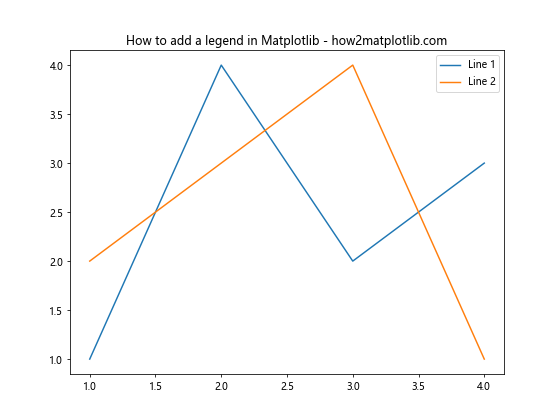
在这个例子中,我们创建了两条线,并为每条线设置了标签。通过调用plt.legend(),Matplotlib会自动创建一个包含这两个标签的图例。
2. 图例条目间距的重要性
图例条目之间的垂直间距对于图表的整体美观和可读性有着重要影响。适当的间距可以:
- 提高可读性:合适的间距使得各个条目更容易区分,减少视觉混淆。
- 优化空间利用:在图表空间有限的情况下,调整间距可以更好地利用可用空间。
- 适应不同字体大小:当使用不同大小的字体时,调整间距可以保持图例的平衡感。
- 突出重要信息:通过增加某些条目之间的间距,可以强调特定的信息。
3. 使用labelspacing参数调整间距
Matplotlib提供了一个简单的方法来调整图例条目之间的垂直间距,那就是使用legend()方法的labelspacing参数。这个参数控制图例中标签之间的垂直间距,以字体大小的倍数为单位。
下面是一个示例,展示如何使用labelspacing参数:
import matplotlib.pyplot as plt

plt.figure(figsize=(10, 6))
plt.plot([1, 2, 3, 4], [1, 4, 2, 3], label='Line 1')
plt.plot([1, 2, 3, 4], [2, 3, 4, 1], label='Line 2')
plt.plot([1, 2, 3, 4], [3, 1, 4, 2], label='Line 3')
plt.title('Adjusting legend spacing - how2matplotlib.com')
plt.legend(labelspacing=1.5)  # 增加间距
plt.show()
Output:
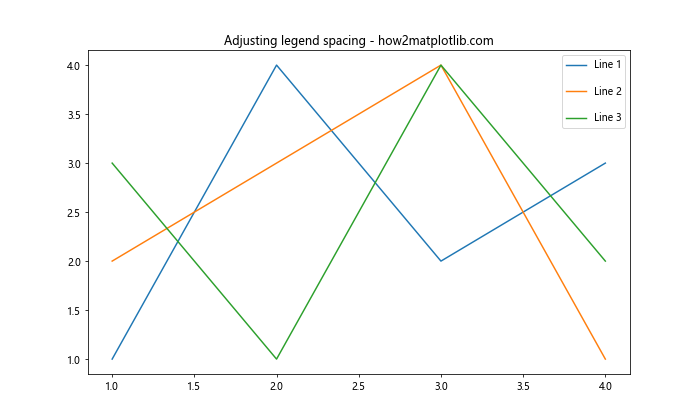
在这个例子中,我们将labelspacing设置为1.5,这意味着标签之间的间距是默认字体大小的1.5倍。你可以尝试不同的值来找到最适合你的图表的间距。
4. 使用bbox_to_anchor和loc精确定位图例
有时,仅仅调整标签间距可能不足以满足我们的需求。在这种情况下,我们可以使用bbox_to_anchor和loc参数来精确定位图例,并通过调整这些参数来间接控制条目之间的间距。
以下是一个使用bbox_to_anchor和loc的示例:
import matplotlib.pyplot as plt

plt.figure(figsize=(10, 6))
plt.plot([1, 2, 3, 4], [1, 4, 2, 3], label='Line 1')
plt.plot([1, 2, 3, 4], [2, 3, 4, 1], label='Line 2')
plt.title('Precise legend positioning - how2matplotlib.com')
plt.legend(bbox_to_anchor=(1.05, 1), loc='upper left')
plt.tight_layout()
plt.show()
Output:
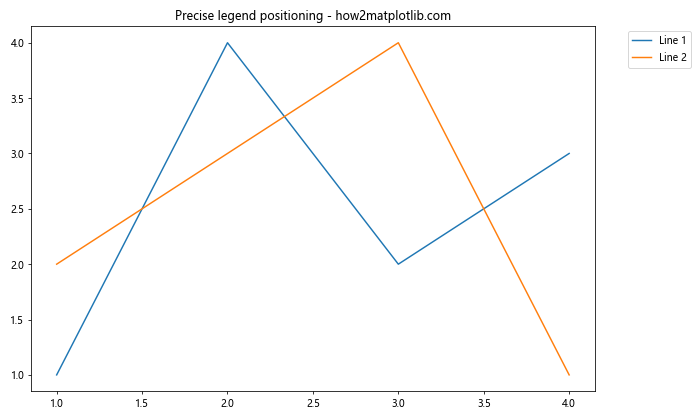
在这个例子中,我们将图例放置在图表的右上角外侧。通过调整bbox_to_anchor的值,你可以微调图例的位置,从而间接影响条目之间的间距。
5. 自定义图例样式
除了调整间距,我们还可以通过自定义图例的样式来改善其外观和可读性。Matplotlib提供了多种参数来控制图例的样式,如字体大小、背景颜色、边框等。
下面是一个展示如何自定义图例样式的示例:
import matplotlib.pyplot as plt

plt.figure(figsize=(10, 6))
plt.plot([1, 2, 3, 4], [1, 4, 2, 3], label='Line 1')
plt.plot([1, 2, 3, 4], [2, 3, 4, 1], label='Line 2')
plt.title('Custom legend style - how2matplotlib.com')
plt.legend(labelspacing=1.2,
           fontsize=12,
           facecolor='lightgray',
           edgecolor='black',
           framealpha=0.7)
plt.show()
Output:
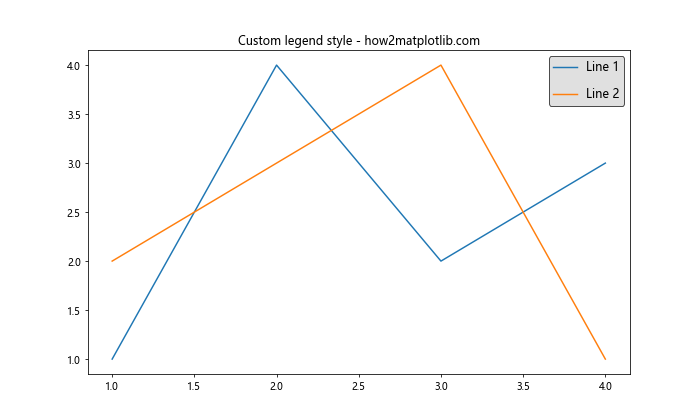
在这个例子中,我们不仅调整了labelspacing,还设置了字体大小、背景颜色、边框颜色和透明度。这些自定义选项可以帮助你创建更加美观和易读的图例。
6. 使用columnspacing调整多列图例
当图例包含多个条目时,将它们排列成多列可能会更加紧凑和美观。在这种情况下,我们可以使用ncol参数来设置列数,并使用columnspacing参数来调整列之间的间距。
以下是一个多列图例的示例:
import matplotlib.pyplot as plt

plt.figure(figsize=(12, 6))
for i in range(6):
    plt.plot([1, 2, 3, 4], [i+1, i+2, i+3, i+4], label=f'Line {i+1}')
plt.title('Multi-column legend - how2matplotlib.com')
plt.legend(ncol=3, columnspacing=1.5, labelspacing=1.2)
plt.show()
Output:
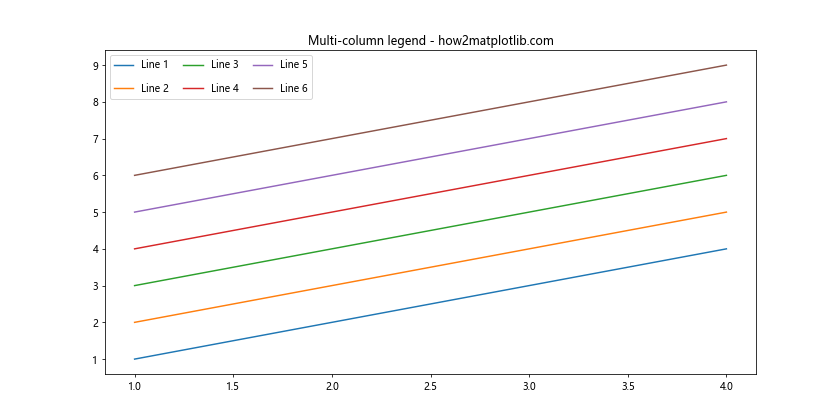
在这个例子中,我们创建了6条线,并将图例设置为3列。columnspacing参数控制列之间的间距,而labelspacing控制每列中条目之间的垂直间距。
7. 使用handler_map自定义图例条目
对于更高级的自定义需求,我们可以使用handler_map来完全控制图例条目的绘制方式。这允许我们创建自定义的图例处理程序,从而精确控制每个条目的外观,包括间距。
下面是一个使用handler_map的高级示例:
import matplotlib.pyplot as plt
from matplotlib.legend_handler import HandlerLine2D

class CustomHandler(HandlerLine2D):
    def create_artists(self, legend, orig_handle, xdescent, ydescent, width, height, fontsize, trans):
        line, = super().create_artists(legend, orig_handle, xdescent, ydescent, width, height, fontsize, trans)
        line.set_markeredgewidth(3)
        line.set_markersize(10)
        return [line]

plt.figure(figsize=(10, 6))
line1, = plt.plot([1, 2, 3, 4], [1, 4, 2, 3], 'o-', label='Custom Line 1')
line2, = plt.plot([1, 2, 3, 4], [2, 3, 4, 1], 's-', label='Custom Line 2')
plt.title('Custom legend handlers - how2matplotlib.com')
plt.legend(handler_map={line1: CustomHandler(), line2: CustomHandler()})
plt.show()
Output:
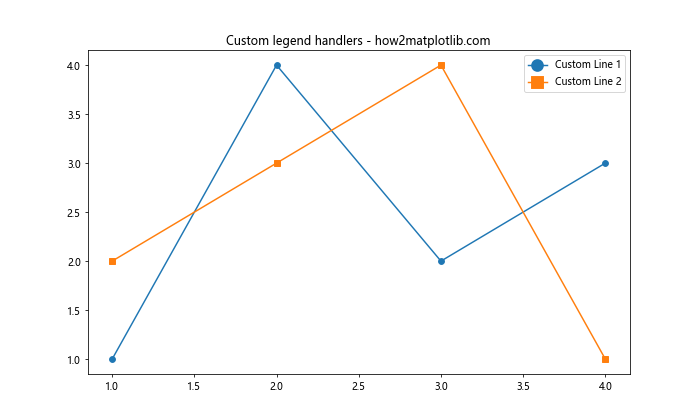
在这个例子中,我们创建了一个自定义的HandlerLine2D子类,它可以修改图例中线条的外观。通过使用handler_map,我们可以为每个图例条目指定不同的处理程序,从而实现更精细的控制。
8. 动态调整图例间距
在某些情况下,你可能需要根据图表的内容或大小动态调整图例的间距。这可以通过编程方式实现,例如,根据图例条目的数量或文本长度来计算适当的间距。
以下是一个动态调整图例间距的示例:
import matplotlib.pyplot as plt

def adjust_legend_spacing(num_entries):
    base_spacing = 0.5
    return base_spacing + 0.1 * num_entries

plt.figure(figsize=(10, 6))
lines = []
for i in range(5):
    line, = plt.plot([1, 2, 3, 4], [i+1, i+2, i+3, i+4], label=f'Line {i+1}')
    lines.append(line)

plt.title('Dynamic legend spacing - how2matplotlib.com')
spacing = adjust_legend_spacing(len(lines))
plt.legend(labelspacing=spacing)
plt.show()
Output:
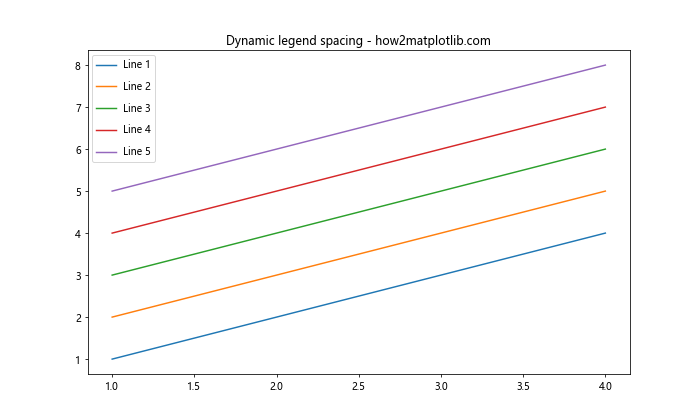
在这个例子中,我们定义了一个adjust_legend_spacing函数,它根据图例条目的数量计算适当的间距。这种方法可以确保无论图例包含多少条目,间距都能保持合适的比例。
9. 使用GridSpec和子图调整图例位置
对于复杂的图表布局,使用GridSpec和子图可以提供更大的灵活性来放置图例并调整其间距。这种方法特别适用于需要在多个子图之间共享图例的情况。
下面是一个使用GridSpec调整图例位置的示例:
import matplotlib.pyplot as plt
from matplotlib.gridspec import GridSpec

fig = plt.figure(figsize=(12, 8))
gs = GridSpec(2, 2, figure=fig)

ax1 = fig.add_subplot(gs[0, 0])
ax2 = fig.add_subplot(gs[0, 1])
ax3 = fig.add_subplot(gs[1, :])

ax1.plot([1, 2, 3], [1, 2, 3], label='Plot 1')
ax2.plot([1, 2, 3], [3, 2, 1], label='Plot 2')
ax3.plot([1, 2, 3, 4], [1, 4, 2, 3], label='Plot 3')

fig.suptitle('Using GridSpec for legend placement - how2matplotlib.com')

# 创建一个额外的轴用于放置图例
legend_ax = fig.add_subplot(gs[:, -1])
legend_ax.axis('off')

# 收集所有子图的图例句柄和标签
handles, labels = [], []
for ax in [ax1, ax2, ax3]:
    h, l = ax.get_legend_handles_labels()
    handles.extend(h)
    labels.extend(l)

# 在额外的轴上放置图例
legend_ax.legend(handles, labels, loc='center left', labelspacing=1.5)

plt.tight_layout()
plt.show()
Output:
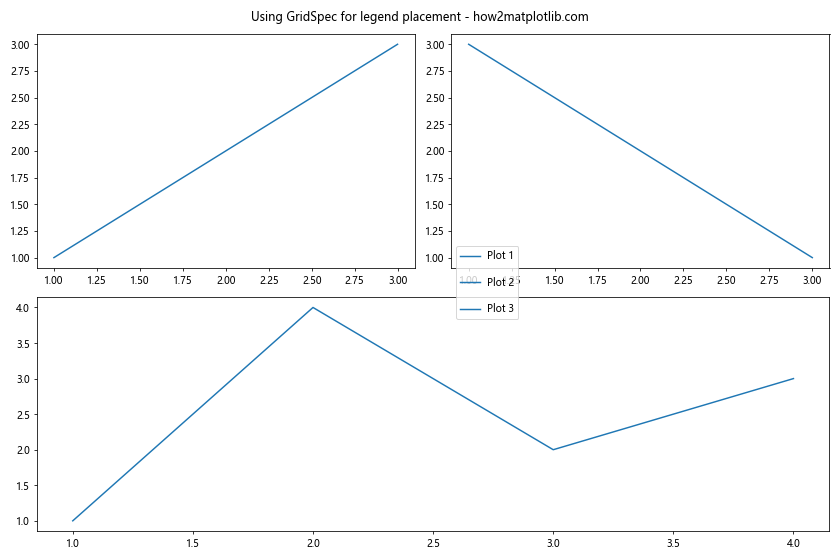
在这个例子中,我们使用GridSpec创建了一个复杂的布局,包括三个子图和一个额外的轴用于放置图例。通过这种方法,我们可以精确控制图例的位置和间距,同时保持整个图表的平衡。
10. 使用constrained_layout自动调整布局
Matplotlib的constrained_layout功能可以自动调整图表元素的布局,包括图例。这对于创建紧凑且美观的图表非常有用,尤其是在处理多个子图和图例时。
以下是一个使用constrained_layout的示例:
import matplotlib.pyplot as plt

plt.figure(figsize=(12, 8), constrained_layout=True)

for i in range(4):
    plt.subplot(2, 2, i+1)
    plt.plot([1, 2, 3, 4], [i+1, i+2, i+3, i+4], label=f'Line {i+1}')
    plt.title(f'Subplot {i+1}')
    plt.legend()

plt.suptitle('Using constrained_layout - how2matplotlib.com')
plt.show()
Output:
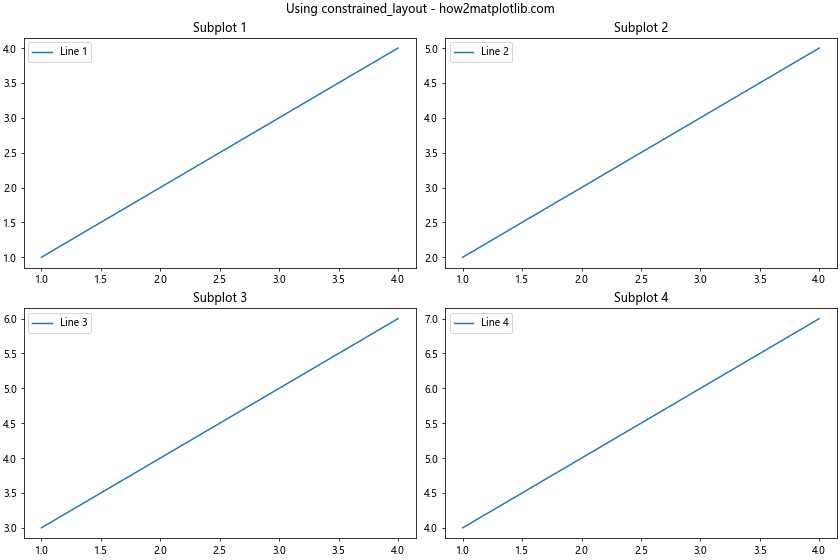
在这个例子中,我们创建了四个子图,每个子图都有自己的图例。通过设置constrained_layout=True,Matplotlib会自动调整子图和图例的位置,以确保它们不会重叠并且间距适当。
11. 使用tight_layout和rect参数微调布局
tight_layout函数是另一个用于自动调整图表布局的工具。结合rect参数,我们可以更精细地控制图表元素的位置,包括图例。
下面是一个使用tight_layout和rect参数的示例:
import matplotlib.pyplot as plt

fig, (ax1, ax2) = plt.subplots(1, 2, figsize=(12, 6))

ax1.plot([1, 2, 3, 4], [1, 4, 2, 3], label='Line 1')
ax2.plot([1, 2, 3, 4], [2, 3, 4, 1], label='Line 2')

ax1.set_title('Subplot 1')
ax2.set_title('Subplot 2')

ax1.legend()
ax2.legend()

plt.suptitle('Using tight_layout with rect - how2matplotlib.com')

# 使用tight_layout,并通过rect参数留出空间放置图例
plt.tight_layout(rect=[0, 0.03, 1, 0.95])

plt.show()
Output:
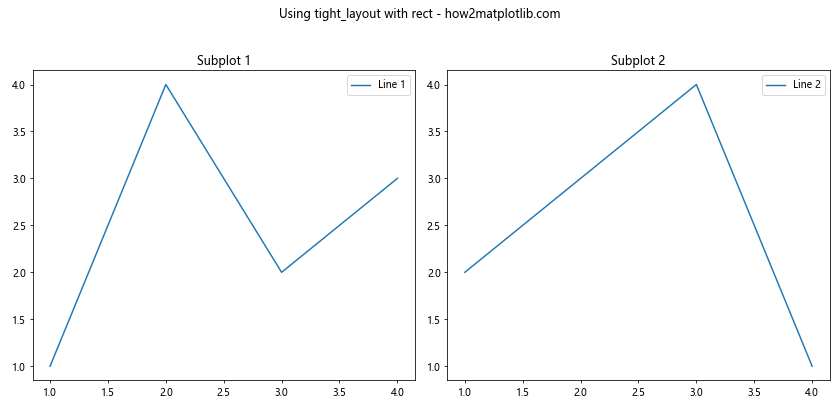
在这个例子中,我们使用tight_layout函数来自动调整子图的布局。rect参数指定了图表的边界,格式为[left, bottom, right, top]。通过调整这些值,我们可以为图例和标题留出适当的空间。
12. 使用bbox_inches='tight'保存图表时调整间距
当保存图表为图像文件时,我们可以使用bbox_inches='tight'参数来自动裁剪图表,确保所有元素(包括图例)都被完整保存,同时去除多余的空白。这对于调整图例间距特别有用,因为它可以确保图例不会被裁剪掉。
以下是一个使用bbox_inches='tight'保存图表的示例:
import matplotlib.pyplot as plt

plt.figure(figsize=(10, 6))
plt.plot([1, 2, 3, 4], [1, 4, 2, 3], label='Line 1')
plt.plot([1, 2, 3, 4], [2, 3, 4, 1], label='Line 2')
plt.title('Saving figure with tight bbox - how2matplotlib.com')
plt.legend(bbox_to_anchor=(1.05, 1), loc='upper left')

# 保存图表,使用bbox_inches='tight'自动调整边界
plt.savefig('legend_spacing_example.png', bbox_inches='tight', dpi=300)
plt.show()
Output:
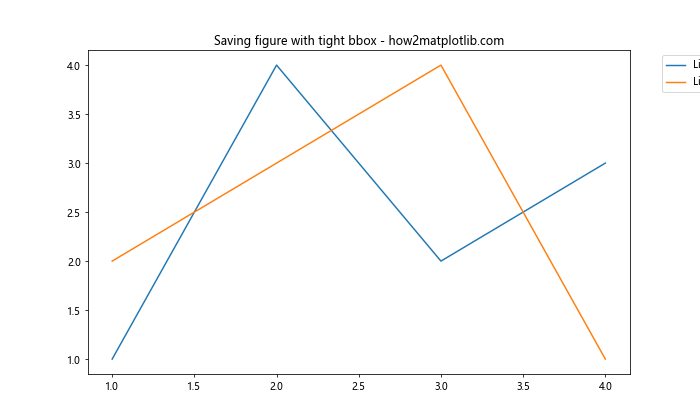
在这个例子中,我们将图例放置在图表的右侧。通过使用bbox_inches='tight',保存的图像将自动包含完整的图例,而不会被裁剪。
13. 使用rcParams全局设置图例样式
如果你想在整个项目中统一设置图例样式,包括间距,可以使用Matplotlib的rcParams。这允许你设置默认的图例样式,而不需要在每个图表中重复设置。
下面是一个使用rcParams设置全局图例样式的示例:
import matplotlib.pyplot as plt

# 设置全局图例样式
plt.rcParams['legend.fontsize'] = 10
plt.rcParams['legend.labelspacing'] = 0.8
plt.rcParams['legend.borderpad'] = 0.5
plt.rcParams['legend.frameon'] = True
plt.rcParams['legend.fancybox'] = True
plt.rcParams['legend.shadow'] = True

plt.figure(figsize=(10, 6))
plt.plot([1, 2, 3, 4], [1, 4, 2, 3], label='Line 1')
plt.plot([1, 2, 3, 4], [2, 3, 4, 1], label='Line 2')
plt.title('Global legend style with rcParams - how2matplotlib.com')
plt.legend()
plt.show()
Output:
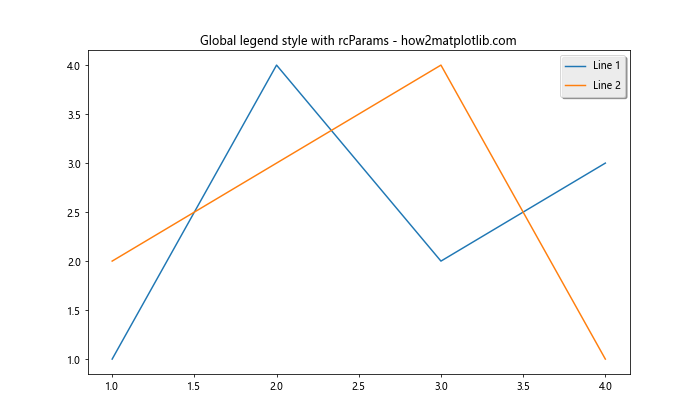
在这个例子中,我们使用rcParams设置了多个图例相关的参数,包括字体大小、标签间距、边距等。这些设置将应用于所有后续创建的图表,除非在个别图表中被覆盖。
14. 使用plt.figlegend()创建图表级别的图例
对于包含多个子图的复杂图表,使用plt.figlegend()可以创建一个适用于整个图表的图例。这种方法可以帮助你更好地控制图例的位置和间距,特别是在处理多个相关子图时。
以下是一个使用plt.figlegend()的示例:
import matplotlib.pyplot as plt

fig, (ax1, ax2) = plt.subplots(1, 2, figsize=(12, 6))

line1, = ax1.plot([1, 2, 3, 4], [1, 4, 2, 3], label='Line 1')
line2, = ax2.plot([1, 2, 3, 4], [2, 3, 4, 1], label='Line 2')

ax1.set_title('Subplot 1')
ax2.set_title('Subplot 2')

fig.suptitle('Using plt.figlegend() - how2matplotlib.com')

# 创建图表级别的图例
fig.legend([line1, line2], ['Line 1', 'Line 2'],
           loc='lower center', ncol=2, labelspacing=1.2)

plt.tight_layout()
plt.subplots_adjust(bottom=0.2)  # 为图例留出空间
plt.show()
Output:
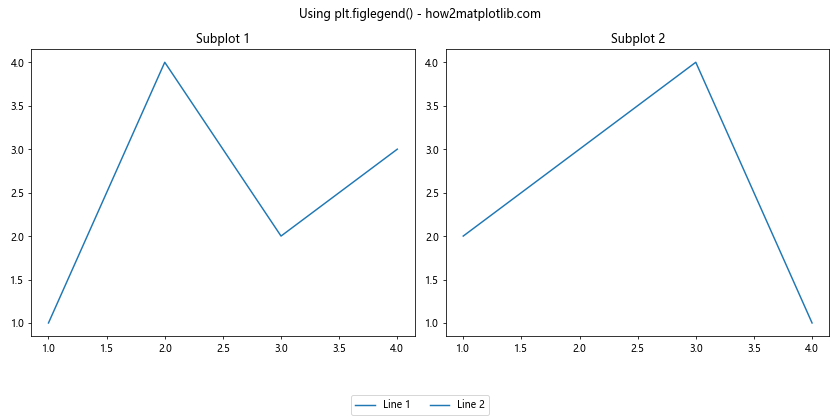
在这个例子中,我们使用plt.figlegend()创建了一个适用于整个图表的图例,并将其放置在图表底部。通过调整labelspacing参数,我们可以控制图例条目之间的垂直间距。
15. 使用自定义函数动态调整图例位置和间距
在某些情况下,你可能需要根据图表的内容或大小动态调整图例的位置和间距。这可以通过创建一个自定义函数来实现,该函数根据图表的特性计算最佳的图例位置和间距。
以下是一个使用自定义函数动态调整图例的示例:
import matplotlib.pyplot as plt

def adjust_legend(fig, ax, num_lines):
    # 根据线条数量计算间距
    spacing = 0.5 + 0.1 * num_lines

    # 计算图例位置
    bbox = ax.get_position()
    legend_left = bbox.x1 + 0.02
    legend_bottom = bbox.y0 + (bbox.y1 - bbox.y0) / 2 - (num_lines * spacing) / 2

    return {'bbox_to_anchor': (legend_left, legend_bottom),
            'loc': 'center left',
            'labelspacing': spacing}

fig, ax = plt.subplots(figsize=(10, 6))

lines = []
for i in range(5):
    line, = ax.plot([1, 2, 3, 4], [i+1, i+2, i+3, i+4], label=f'Line {i+1}')
    lines.append(line)

ax.set_title('Dynamic legend adjustment - how2matplotlib.com')

# 使用自定义函数调整图例
legend_params = adjust_legend(fig, ax, len(lines))
ax.legend(**legend_params)

plt.tight_layout()
plt.show()
Output:
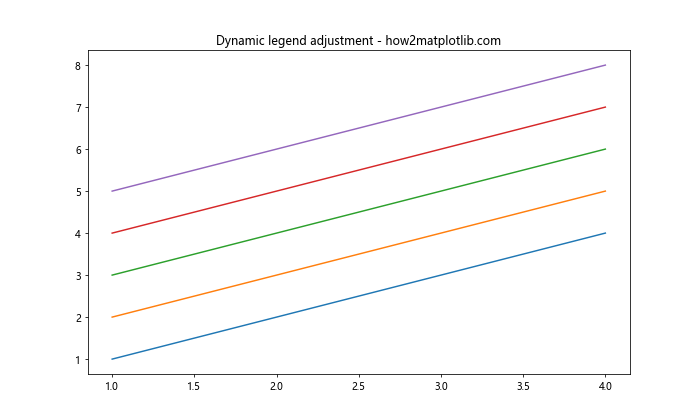
在这个例子中,我们定义了一个adjust_legend函数,它根据图表中的线条数量计算适当的图例位置和间距。这种方法可以确保图例始终以最佳方式显示,无论图表内容如何变化。
16. 使用ax.add_artist()添加多个图例
在某些情况下,你可能需要在图表中添加多个图例,每个图例具有不同的间距设置。使用ax.add_artist()方法可以实现这一点,它允许你精确控制每个图例的位置和样式。
以下是一个添加多个图例的示例:
import matplotlib.pyplot as plt

fig, ax = plt.subplots(figsize=(10, 6))

line1, = ax.plot([1, 2, 3, 4], [1, 4, 2, 3], label='Line 1')
line2, = ax.plot([1, 2, 3, 4], [2, 3, 4, 1], label='Line 2')
line3, = ax.plot([1, 2, 3, 4], [3, 1, 4, 2], label='Line 3')

ax.set_title('Multiple legends with different spacing - how2matplotlib.com')

# 添加第一个图例
legend1 = ax.legend([line1, line2], ['Line 1', 'Line 2'],
                    loc='upper left', labelspacing=0.8)
ax.add_artist(legend1)

# 添加第二个图例
legend2 = ax.legend([line3], ['Line 3'],
                    loc='lower right', labelspacing=1.2)

plt.tight_layout()
plt.show()
Output:
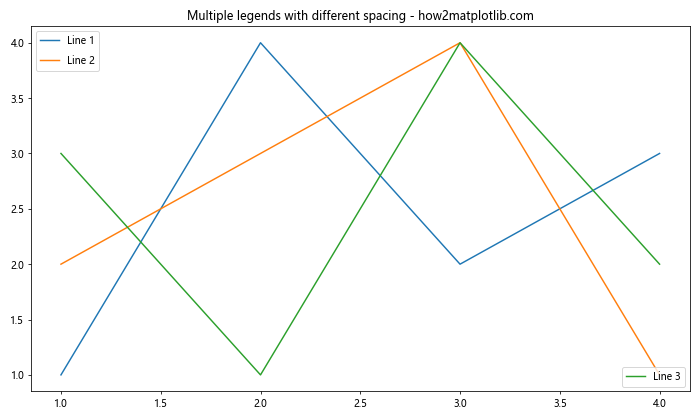
在这个例子中,我们创建了两个独立的图例,每个图例都有不同的labelspacing设置。通过使用ax.add_artist(),我们可以确保两个图例都显示在图表上。
17. 使用bbox_extra_artists参数保存包含多个图例的图表
当你的图表包含多个图例或其他自定义艺术家对象时,使用bbox_inches='tight'保存图表可能会导致某些元素被裁剪。在这种情况下,你可以使用bbox_extra_artists参数来确保所有元素都被正确保存。
以下是一个使用bbox_extra_artists保存图表的示例:
import matplotlib.pyplot as plt

fig, ax = plt.subplots(figsize=(10, 6))

line1, = ax.plot([1, 2, 3, 4], [1, 4, 2, 3], label='Line 1')
line2, = ax.plot([1, 2, 3, 4], [2, 3, 4, 1], label='Line 2')

ax.set_title('Saving figure with multiple legends - how2matplotlib.com')

# 创建两个图例
legend1 = ax.legend([line1], ['Line 1'], loc='upper left', labelspacing=1.2)
ax.add_artist(legend1)
legend2 = ax.legend([line2], ['Line 2'], loc='lower right', labelspacing=0.8)

# 保存图表,确保包含所有图例
plt.savefig('multiple_legends.png', bbox_inches='tight',
            bbox_extra_artists=[legend1, legend2], dpi=300)

plt.show()
Output:
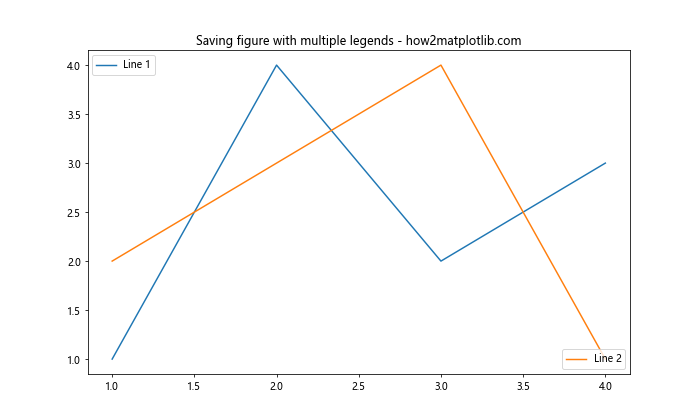
在这个例子中,我们创建了两个独立的图例,并在保存图表时使用bbox_extra_artists参数确保两个图例都被正确包含在保存的图像中。
18. 使用plt.setp()批量设置图例属性
当你需要同时调整多个图例的属性时,使用plt.setp()函数可以更高效地完成这项任务。这个函数允许你一次性设置多个对象的属性,包括图例的间距和其他样式。
以下是一个使用plt.setp()设置图例属性的示例:
import matplotlib.pyplot as plt

fig, (ax1, ax2) = plt.subplots(1, 2, figsize=(12, 6))

ax1.plot([1, 2, 3, 4], [1, 4, 2, 3], label='Line 1')
ax2.plot([1, 2, 3, 4], [2, 3, 4, 1], label='Line 2')

ax1.set_title('Subplot 1')
ax2.set_title('Subplot 2')

legend1 = ax1.legend()
legend2 = ax2.legend()

plt.setp([legend1, legend2],
         labelspacing=1.2,
         fontsize=10,
         frameon=True,
         fancybox=True,
         shadow=True)

fig.suptitle('Using plt.setp() to set legend properties - how2matplotlib.com')
plt.tight_layout()
plt.show()
在这个例子中,我们使用plt.setp()同时设置两个图例的多个属性,包括labelspacing、字体大小和边框样式。这种方法可以大大简化代码,特别是在处理多个图例时。
19. 使用RendererBase精确计算文本尺寸
在某些情况下,你可能需要根据图例文本的实际尺寸来动态调整间距。Matplotlib提供了RendererBase类,可以用来精确计算文本的尺寸,从而帮助你更准确地设置间距。
以下是一个使用RendererBase计算文本尺寸并调整图例间距的高级示例:
import matplotlib.pyplot as plt
from matplotlib.backends.backend_agg import RendererAgg

def calculate_text_height(text, renderer):
    bbox = text.get_window_extent(renderer)
    return bbox.height

fig, ax = plt.subplots(figsize=(10, 6))

ax.plot([1, 2, 3, 4], [1, 4, 2, 3], label='Short Label')
ax.plot([1, 2, 3, 4], [2, 3, 4, 1], label='Very Long Label for Demonstration')

ax.set_title('Dynamic spacing based on text size - how2matplotlib.com')

# 创建一个渲染器
renderer = RendererAgg(width=fig.get_figwidth(), height=fig.get_figheight(), dpi=fig.dpi)

# 获取图例
legend = ax.legend()

# 计算最大文本高度
max_height = max(calculate_text_height(text, renderer) for text in legend.get_texts())

# 设置间距为最大文本高度的1.2倍
legend._loc = 0  # 重置图例位置以应用新的间距
legend.set_bbox_to_anchor((1.05, 1))
legend._loc = 2  # 设置到'upper left'
plt.setp(legend, labelspacing=max_height * 1.2 / fig.dpi)

plt.tight_layout()
plt.show()
在这个高级示例中,我们使用RendererAgg来计算图例文本的实际高度,然后根据最大文本高度动态设置labelspacing。这种方法可以确保图例间距始终适应文本的实际大小,无论标签长短如何。
20. 使用交互式工具调整图例间距
对于需要频繁调整图例间距的情况,创建一个交互式工具可能会很有帮助。使用Matplotlib的交互式功能,我们可以创建一个滑块来实时调整图例间距。
以下是一个使用交互式滑块调整图例间距的示例:
import matplotlib.pyplot as plt
from matplotlib.widgets import Slider

fig, ax = plt.subplots(figsize=(10, 6))

line1, = ax.plot([1, 2, 3, 4], [1, 4, 2, 3], label='Line 1')
line2, = ax.plot([1, 2, 3, 4], [2, 3, 4, 1], label='Line 2')

ax.set_title('Interactive legend spacing adjustment - how2matplotlib.com')

legend = ax.legend()

# 创建滑块轴
slider_ax = plt.axes([0.2, 0.02, 0.6, 0.03])
spacing_slider = Slider(slider_ax, 'Spacing', 0.1, 2.0, valinit=1.0)

def update(val):
    spacing = spacing_slider.val
    plt.setp(legend, labelspacing=spacing)
    fig.canvas.draw_idle()

spacing_slider.on_changed(update)

plt.tight_layout()
plt.subplots_adjust(bottom=0.15)
plt.show()
Output:
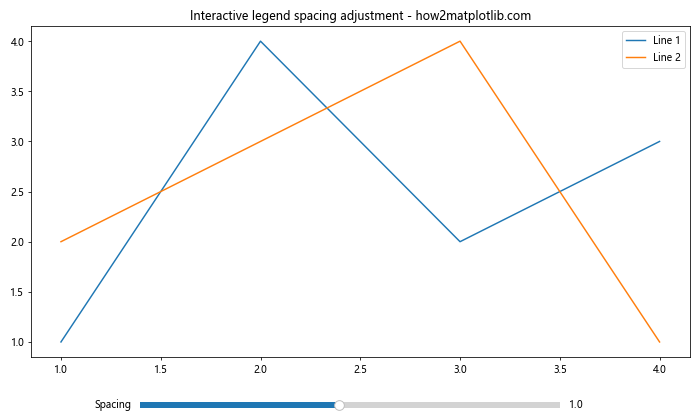
在这个例子中,我们创建了一个滑块,允许用户实时调整图例的labelspacing。当滑块值改变时,update函数被调用,更新图例的间距并重绘图表。这种交互式工具对于找到最佳的图例间距设置非常有用。
总结
调整Matplotlib中图例条目之间的垂直间距是一项重要的技能,可以显著提高图表的可读性和美观度。本文详细介绍了多种方法和技巧,从简单的参数调整到高级的自定义解决方案,涵盖了各种场景下的需求。
主要的方法包括:
1. 使用labelspacing参数直接调整间距
2. 利用bbox_to_anchor和loc精确定位图例
3. 自定义图例样式以优化外观
4. 使用GridSpec和子图灵活布局
5. 应用constrained_layout和tight_layout自动调整布局
6. 使用rcParams设置全局图例样式
7. 创建图表级别的图例
8. 动态调整图例位置和间距
9. 处理多个图例
10. 使用交互式工具实时调整间距
通过掌握这些技巧,你可以根据具体需求灵活调整图例间距,创建出既美观又信息丰富的数据可视化图表。记住,图例的设计应该始终服务于数据的清晰呈现和有效传达。在实践中,可能需要多次尝试和微调才能找到最佳的设置。
最后,建议在调整图例间距时,同时考虑其他图表元素的布局,以确保整体视觉平衡。同时,也要注意不同输出格式(如屏幕显示、打印、嵌入文档等)下图例的表现,可能需要针对不同场景进行微调。通过不断实践和积累经验,你将能够轻松创建出专业水准的数据可视化图表。
 极客教程
极客教程