fig, ax = plt.subplots()
在Matplotlib中,我们经常会使用plt.subplots()函数来创建一个包含一个Figure对象和一个Axes对象的元组。这个函数的返回值通常被解构为fig和ax两个变量,这样我们就可以通过fig来控制整个图像的属性,通过ax来控制图像中的具体绘图区域。
创建一个简单的图像
下面是一个简单的示例代码,展示如何使用plt.subplots()创建一个包含一个绘图区域的图像:
import matplotlib.pyplot as plt

fig, ax = plt.subplots()

ax.plot([1, 2, 3, 4], [1, 4, 9, 16])

plt.show()
Output:
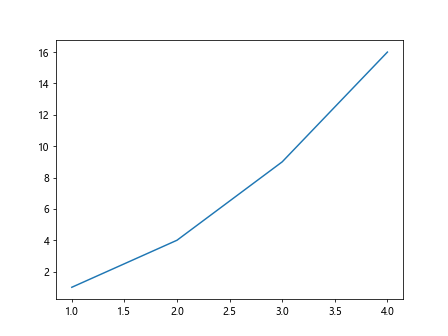
在这个示例中,我们创建了一个简单的折线图,横坐标为1到4,纵坐标为1到16。
创建包含多个绘图区域的图像
除了可以创建一个包含一个绘图区域的图像外,plt.subplots()还可以创建一个包含多个绘图区域的图像。下面是一个示例代码:
import matplotlib.pyplot as plt

fig, axs = plt.subplots(2, 2)

axs[0, 0].plot([1, 2, 3, 4], [1, 4, 9, 16])
axs[0, 1].plot([1, 2, 3, 4], [1, 2, 3, 4])
axs[1, 0].plot([1, 2, 3, 4], [1, 8, 27, 64])
axs[1, 1].plot([1, 2, 3, 4], [1, 16, 81, 256])

plt.show()
Output:

在这个示例中,我们创建了一个包含2行2列共4个绘图区域的图像,并在每个绘图区域中绘制了不同的折线图。
设置图像属性
通过fig对象,我们可以设置图像的各种属性,比如标题、尺寸、背景色等。下面是一个示例代码:
import matplotlib.pyplot as plt

fig, ax = plt.subplots()

fig.suptitle('Example Plot', fontsize=14)
fig.set_size_inches(8, 6)
fig.set_facecolor('lightgrey')

ax.plot([1, 2, 3, 4], [1, 4, 9, 16])

plt.show()
Output:
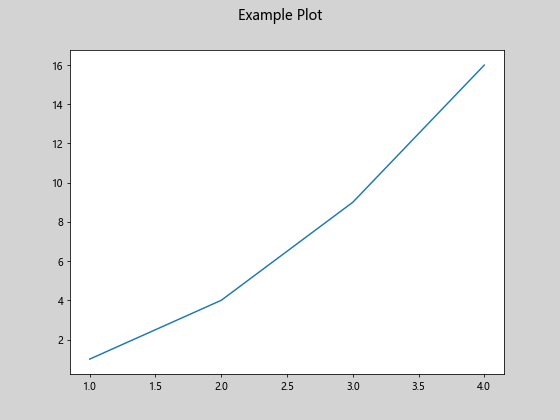
在这个示例中,我们设置了图像的标题为”Example Plot”,尺寸为8×6英寸,背景色为浅灰色。
设置绘图区域属性
通过ax对象,我们可以设置绘图区域的各种属性,比如坐标轴标签、网格线、图例等。下面是一个示例代码:
import matplotlib.pyplot as plt

fig, ax = plt.subplots()

ax.set_xlabel('X Axis')
ax.set_ylabel('Y Axis')
ax.grid(True)
ax.legend(['Data'])

ax.plot([1, 2, 3, 4], [1, 4, 9, 16])

plt.show()
Output:

在这个示例中,我们设置了横坐标和纵坐标的标签,显示了网格线,添加了图例并绘制了折线图。
自定义绘图区域布局
除了默认的整图布局外,我们还可以通过plt.subplots()的参数来自定义绘图区域的布局。下面是一个示例代码:
import matplotlib.pyplot as plt

fig, axs = plt.subplots(2, 2, gridspec_kw={'width_ratios': [1, 2], 'height_ratios': [2, 1]})

axs[0, 0].plot([1, 2, 3, 4], [1, 4, 9, 16])
axs[0, 1].plot([1, 2, 3, 4], [1, 2, 3, 4])
axs[1, 0].plot([1, 2, 3, 4], [1, 8, 27, 64])
axs[1, 1].plot([1, 2, 3, 4], [1, 16, 81, 256])

plt.show()
Output:
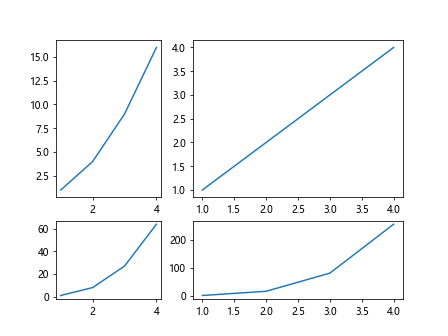
在这个示例中,我们通过gridspec_kw参数设置了每个绘图区域的宽高比例,实现了自定义的布局。
使用不同的绘图样式
通过ax对象,我们可以使用不同的绘图样式来绘制图形。下面是一个示例代码:
import matplotlib.pyplot as plt

fig, ax = plt.subplots()

ax.plot([1, 2, 3, 4], [1, 4, 9, 16], 'r--')
ax.plot([1, 2, 3, 4], [1, 2, 3, 4], 'g-.')
ax.plot([1, 2, 3, 4], [1, 8, 27, 64], 'b:')
ax.plot([1, 2, 3, 4], [1, 16, 81, 256], 'y-.')

plt.show()
Output:
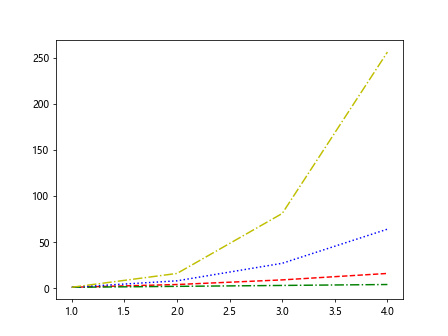
在这个示例中,我们使用了不同的线型和颜色样式来绘制折线图。
绘制多个子图
除了创建包含多个绘图区域的图像外,我们还可以通过plt.subplots()的返回值来绘制多个独立的子图。下面是一个示例代码:
import matplotlib.pyplot as plt

fig, ax = plt.subplots()

ax1 = fig.add_subplot(221)
ax2 = fig.add_subplot(222)
ax3 = fig.add_subplot(223)
ax4 = fig.add_subplot(224)

ax1.plot([1, 2, 3, 4], [1, 4, 9, 16])
ax2.plot([1, 2, 3, 4], [1, 2, 3, 4])
ax3.plot([1, 2, 3, 4], [1, 8, 27, 64])
ax4.plot([1, 2, 3, 4], [1, 16, 81, 256])

plt.show()
Output:
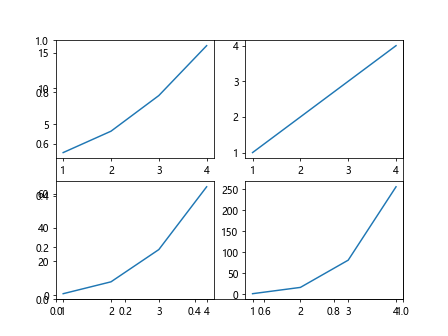
在这个示例中,我们通过fig.add_subplot()方法在同一个图像中创建了四个子图,并在每个子图中绘制了不同的折线图。
展示图像之间的关联
我们可以通过设置不同绘图区域的位置和尺寸,展示不同图像之间的关联。下面是一个示例代码:
import matplotlib.pyplot as plt

fig, axs = plt.subplots(2, 2, gridspec_kw={'width_ratios': [1, 2], 'height_ratios': [2, 1]})

axs[0, 0].plot([1, 2, 3, 4], [1, 4, 9, 16])
axs[0, 1].plot([1, 2, 3, 4], [1, 2, 3, 4])
axs[1, 0].plot([1, 2, 3, 4], [1, 8, 27, 64])
axs[1, 1].plot([1, 2, 3, 4], [1, 16, 81, 256])

plt.show()
Output:
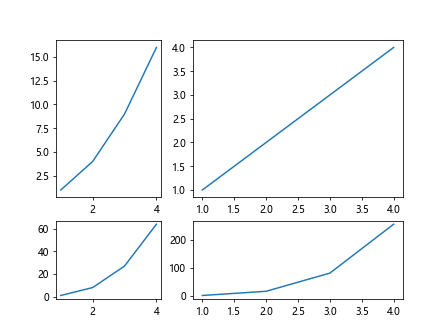
在这个示例中,我们通过设置width_ratios和height_ratios参数调整了不同绘图区域的宽高比例,展示了图像之间的关联。
控制坐标轴范围
我们可以通过ax对象来控制绘图区域的坐标轴范围。下面是一个示例代码:
import matplotlib.pyplot as plt

fig, ax = plt.subplots()

ax.plot([1, 2, 3, 4], [1, 4, 9, 16])

ax.set_xlim(0, 5)
ax.set_ylim(0, 20)

plt.show()
Output:
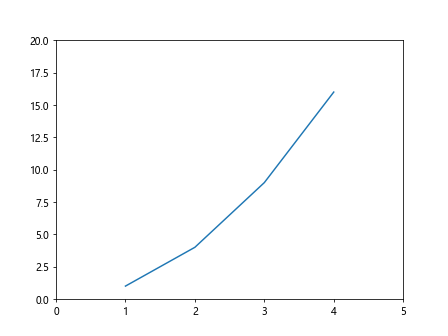
在这个示例中,我们通过set_xlim()和set_ylim()方法分别设置了横坐标和纵坐标的范围。
添加文本注释
我们可以通过ax对象来添加文本注释到绘图区域中。下面是一个示例代码:
import matplotlib.pyplot as plt

fig, ax = plt.subplots()

ax.plot([1, 2, 3, 4], [1, 4, 9, 16])

ax.text(2, 10, 'This is a text annotation', fontsize=12, color='red')

plt.show()
Output:
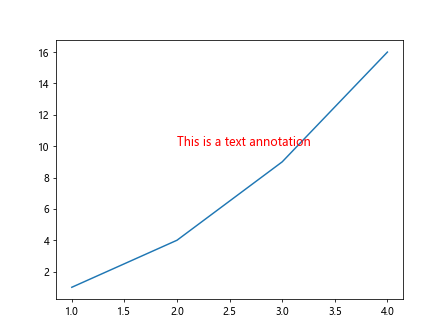
在这个示例中,我们使用了text()方法在坐标(2, 10)处添加了一个红色的文本注释。
绘制散点图
除了折线图外,我们还可以使用ax对象来绘制散点图。下面是一个示例代码:
import matplotlib.pyplot as plt

fig, ax = plt.subplots()

x = [1, 2, 3, 4]
y = [1, 4, 9, 16]
sizes = [20, 50, 80, 200]

ax.scatter(x, y, s=sizes)

plt.show()
Output:
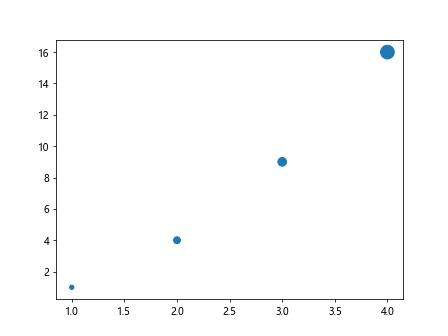
在这个示例中,我们使用了scatter()方法绘制了一个简单的散点图,并通过sizes参数设置了不同散点的大小。
以上就是关于fig, ax = plt.subplots()的详细介绍和示例代码,希望能帮助大家更好地理解和使用Matplotlib库中的这个重要函数。Matplotlib是一个功能强大的数据可视化工具,对于数据分析和展示起着至关重要的作用。
 极客教程
极客教程