Matplotlib设置图表标题
在Matplotlib中,我们可以使用set_title()方法来设置图表的标题。在本文中,我们将详细介绍如何使用set_title()方法来自定义图表的标题。
1. 设置简单文本标题
首先,让我们看一个简单的示例,演示如何设置一个简单的文本标题:
import matplotlib.pyplot as plt

x = [1, 2, 3, 4, 5]
y = [2, 3, 5, 7, 11]

fig, ax = plt.subplots()
ax.plot(x, y)
ax.set_title('Simple Title')
plt.show()
Output:

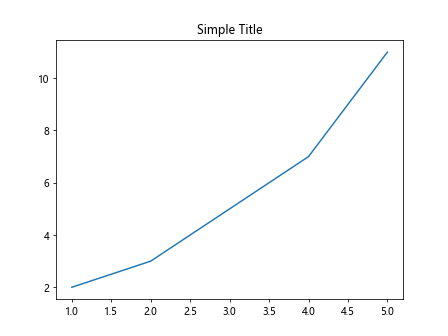
在这个示例中,我们使用set_title()方法将图表的标题设置为Simple Title。
2. 设置标题颜色、大小和字体
除了设置文本标题外,我们还可以通过参数来设置标题的颜色、大小和字体。下面是一个示例代码:
import matplotlib.pyplot as plt

x = [1, 2, 3, 4, 5]
y = [2, 3, 5, 7, 11]

fig, ax = plt.subplots()
ax.plot(x, y)
ax.set_title('Customized Title', color='blue', fontsize=15, fontweight='bold', fontname='Comic Sans MS')
plt.show()
Output:

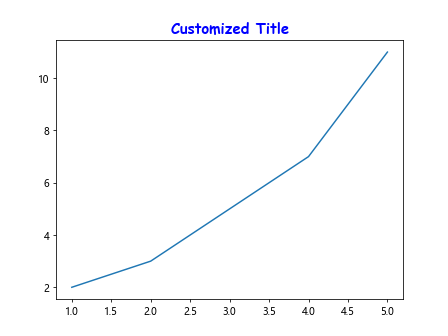
在这个示例中,我们通过设置color参数为blue来改变标题的颜色,fontsize参数为15来改变标题的大小,fontweight参数为bold来设置标题的粗细,fontname参数为Comic Sans MS来设置标题的字体。
3. 设置标题位置和对齐方式
我们还可以通过loc参数来设置标题的位置,通过ha和va参数来设置标题的水平和垂直对齐方式。下面是一个示例代码:
import matplotlib.pyplot as plt

x = [1, 2, 3, 4, 5]
y = [2, 3, 5, 7, 11]

fig, ax = plt.subplots()
ax.plot(x, y)
ax.set_title('Customized Title', loc='left', ha='right', va='top')
plt.show()
Output:

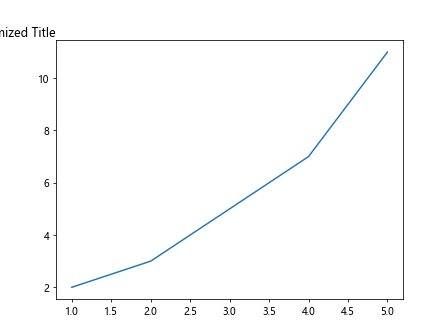
在这个示例中,我们通过设置loc参数为left来将标题放置在左侧,ha参数为right来右对齐标题,va参数为top来顶部对齐标题。
4. 设置标题背景和边框
我们还可以通过backgroundcolor和bbox参数来设置标题的背景色和边框。下面是一个示例代码:
import matplotlib.pyplot as plt

x = [1, 2, 3, 4, 5]
y = [2, 3, 5, 7, 11]

fig, ax = plt.subplots()
ax.plot(x, y)
ax.set_title('Customized Title', backgroundcolor='lightgrey', bbox=dict(facecolor='yellow', edgecolor='red', boxstyle='round,pad=1'))
plt.show()
Output:

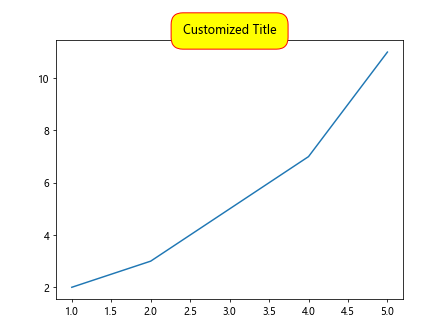
在这个示例中,我们通过设置backgroundcolor参数为lightgrey来设置标题的背景色,通过bbox参数来设置标题的边框颜色为red,背景色为yellow,形状为圆角矩形,并且设置填充1像素。
通过以上示例,我们可以看到如何使用set_title()方法来自定义图表的标题。
 极客教程
极客教程