errorbar linestyle
在图表中使用errorbar可以显示数据的误差范围,而linestyle则可以控制误差线的样式。本文将详细介绍如何在Matplotlib中使用errorbar linestyle,以及如何调整线型以展示数据的不确定性。
示例代码:
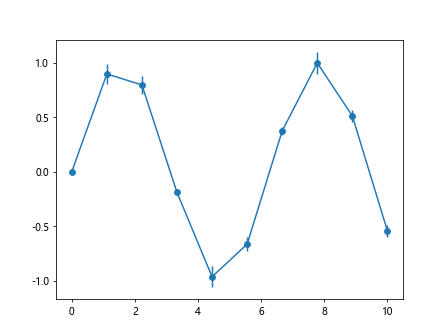
示例1:使用实线样式的errorbar
import matplotlib.pyplot as plt
import numpy as np

x = np.linspace(0, 10, 10)
y = np.sin(x)

errors = 0.1 * np.abs(y)

plt.errorbar(x, y, yerr=errors, linestyle='-', fmt='o')
plt.show()
Output:
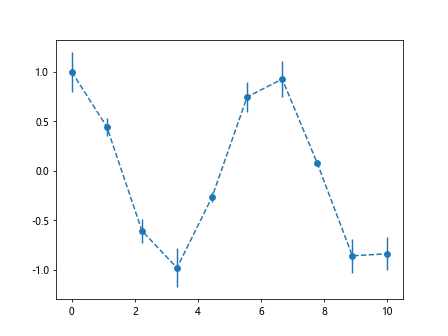
示例2:使用虚线样式的errorbar
import matplotlib.pyplot as plt
import numpy as np

x = np.linspace(0, 10, 10)
y = np.cos(x)

errors = 0.2 * np.abs(y)

plt.errorbar(x, y, yerr=errors, linestyle='--', fmt='o')
plt.show()
Output:
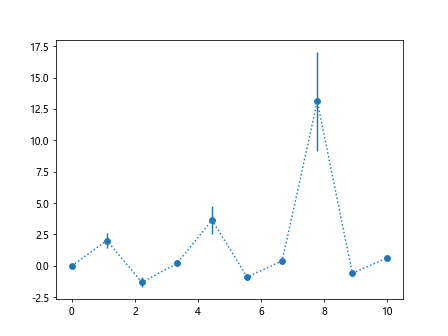
示例3:使用点线样式的errorbar
import matplotlib.pyplot as plt
import numpy as np

x = np.linspace(0, 10, 10)
y = np.tan(x)

errors = 0.3 * np.abs(y)

plt.errorbar(x, y, yerr=errors, linestyle=':', fmt='o')
plt.show()
Output:
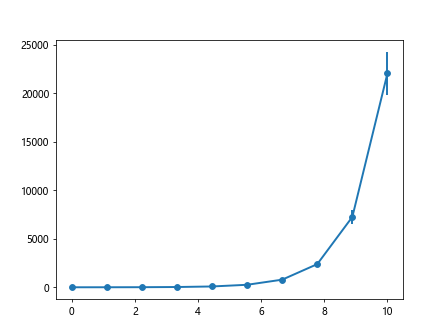
示例4:使用粗线样式的errorbar
import matplotlib.pyplot as plt
import numpy as np

x = np.linspace(0, 10, 10)
y = np.exp(x)

errors = 0.1 * np.abs(y)

plt.errorbar(x, y, yerr=errors, linestyle='-', linewidth=2, fmt='o')
plt.show()
Output:
示例5:使用圆点样式的errorbar
import matplotlib.pyplot as plt
import numpy as np

x = np.linspace(0, 10, 10)
y = np.log(x)

errors = 0.1 * np.abs(y)

plt.errorbar(x, y, yerr=errors, linestyle='-', marker='o')
plt.show()
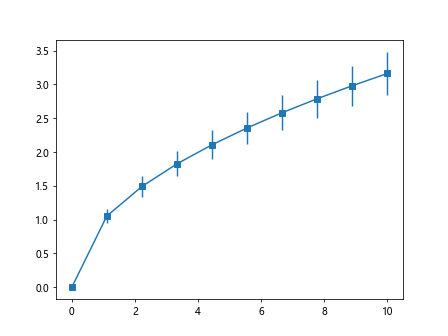
示例6:使用方块样式的errorbar
import matplotlib.pyplot as plt
import numpy as np

x = np.linspace(0, 10, 10)
y = np.sqrt(x)

errors = 0.1 * np.abs(y)

plt.errorbar(x, y, yerr=errors, linestyle='-', marker='s')
plt.show()
Output:
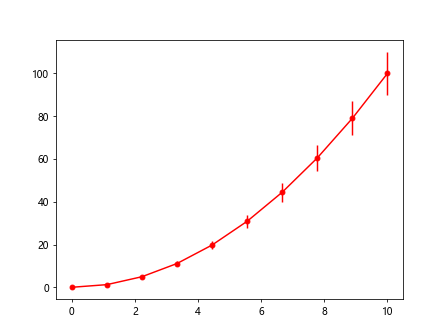
示例7:自定义errorbar的颜色和样式
import matplotlib.pyplot as plt
import numpy as np

x = np.linspace(0, 10, 10)
y = np.power(x, 2)

errors = 0.1 * np.abs(y)

plt.errorbar(x, y, yerr=errors, linestyle='-', color='red', marker='o', markersize=5)
plt.show()
Output:
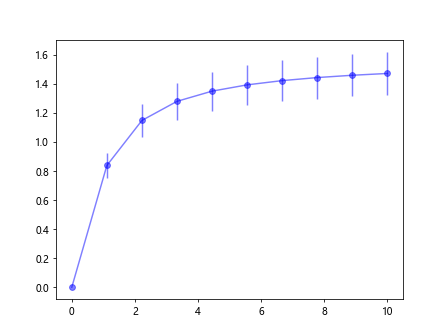
示例8:设置误差线的透明度
import matplotlib.pyplot as plt
import numpy as np

x = np.linspace(0, 10, 10)
y = np.arctan(x)

errors = 0.1 * np.abs(y)

plt.errorbar(x, y, yerr=errors, linestyle='-', color='blue', marker='o', alpha=0.5)
plt.show()
Output:
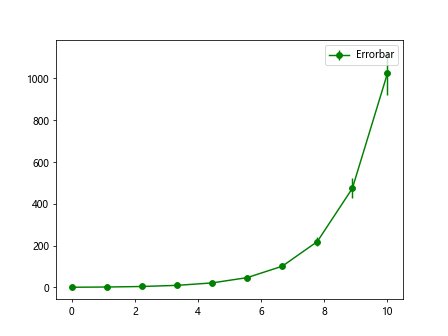
示例9:设置误差线的标签
import matplotlib.pyplot as plt
import numpy as np

x = np.linspace(0, 10, 10)
y = np.power(2, x)

errors = 0.1 * np.abs(y)

plt.errorbar(x, y, yerr=errors, linestyle='-', color='green', marker='o', label='Errorbar')
plt.legend()
plt.show()
Output:
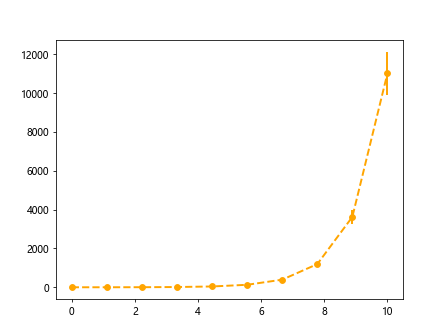
示例10:调整误差线的样式和粗细
import matplotlib.pyplot as plt
import numpy as np

x = np.linspace(0, 10, 10)
y = np.cosh(x)

errors = 0.1 * np.abs(y)

plt.errorbar(x, y, yerr=errors, linestyle='--', color='orange', linewidth=2, marker='o')
plt.show()
Output:
通过以上示例代码,我们可以看到如何在Matplotlib中使用errorbar linestyle来展示数据的误差范围,并根据需求调整误差线的样式、粗细、颜色等参数,使图表更加清晰和易于理解。
 极客教程
极客教程