Matplotlib中的事件处理:如何实现交互式可视化
参考:Event Handling in Matplotlib
Matplotlib是Python中最流行的数据可视化库之一,它不仅能够创建静态图表,还能够处理各种用户交互事件,从而实现动态和交互式的数据可视化。本文将深入探讨Matplotlib中的事件处理机制,帮助您掌握如何创建响应用户操作的交互式图表。
1. Matplotlib事件系统概述
Matplotlib的事件系统允许您捕获用户与图形界面的交互,如鼠标点击、键盘输入等。这些事件可以触发自定义的函数,从而实现各种交互式功能。
以下是一个简单的示例,展示如何连接一个鼠标点击事件:
import matplotlib.pyplot as plt

def on_click(event):
    print(f'Clicked at x={event.xdata}, y={event.ydata}')

fig, ax = plt.subplots()
ax.plot([1, 2, 3, 4], [1, 4, 2, 3])
ax.set_title('Click anywhere on the plot - how2matplotlib.com')

fig.canvas.mpl_connect('button_press_event', on_click)

plt.show()
Output:
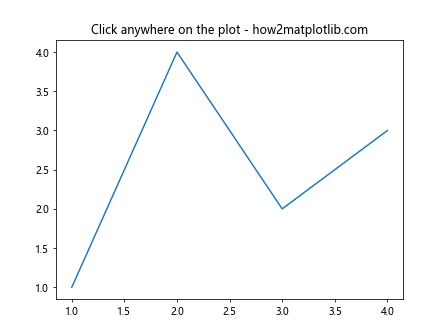
在这个例子中,我们定义了一个on_click函数来处理鼠标点击事件。通过fig.canvas.mpl_connect方法,我们将这个函数与’button_press_event’事件关联起来。当用户点击图表时,on_click函数将被调用,并打印出点击的坐标。
2. 常见的Matplotlib事件类型
Matplotlib提供了多种事件类型,以下是一些常见的事件:
- 鼠标事件:
- ‘button_press_event’:鼠标按下
- ‘button_release_event’:鼠标释放
- ‘motion_notify_event’:鼠标移动
- ‘scroll_event’:鼠标滚轮滚动
- 键盘事件:
- ‘key_press_event’:键盘按下
- ‘key_release_event’:键盘释放
- 图形事件:
- ‘figure_enter_event’:鼠标进入图形区域
- ‘figure_leave_event’:鼠标离开图形区域
- ‘axes_enter_event’:鼠标进入坐标轴区域
- ‘axes_leave_event’:鼠标离开坐标轴区域
- 绘图事件:
- ‘draw_event’:图形重绘
- ‘resize_event’:图形大小改变
下面是一个示例,展示如何处理键盘事件:
import matplotlib.pyplot as plt

def on_key(event):
    if event.key == 'left':
        print('Moving left - how2matplotlib.com')
    elif event.key == 'right':
        print('Moving right - how2matplotlib.com')

fig, ax = plt.subplots()
ax.set_title('Press left or right arrow keys - how2matplotlib.com')

fig.canvas.mpl_connect('key_press_event', on_key)

plt.show()
Output:
在这个例子中,我们定义了一个on_key函数来处理键盘按键事件。当用户按下左箭头或右箭头键时,会打印相应的消息。
3. 事件对象的属性
当事件发生时,Matplotlib会创建一个事件对象并将其传递给事件处理函数。这个对象包含了与事件相关的各种信息。以下是一些常用的事件对象属性:
event.x和event.y:事件发生的像素坐标event.xdata和event.ydata:事件发生的数据坐标event.inaxes:事件发生的Axes对象(如果在Axes内)event.button:鼠标按钮(对于鼠标事件)event.key:按下的键(对于键盘事件)
下面是一个示例,展示如何使用这些属性:
import matplotlib.pyplot as plt

def on_click(event):
    if event.inaxes:
        print(f'Clicked in Axes: x={event.xdata:.2f}, y={event.ydata:.2f}')
        print(f'Button: {event.button}')
    else:
        print('Clicked outside Axes')

fig, ax = plt.subplots()
ax.plot([1, 2, 3, 4], [1, 4, 2, 3])
ax.set_title('Click inside or outside the plot - how2matplotlib.com')

fig.canvas.mpl_connect('button_press_event', on_click)

plt.show()
Output:
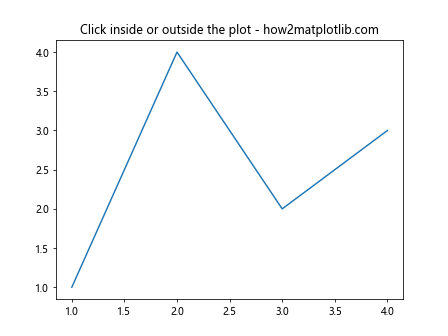
在这个例子中,我们检查点击是否发生在Axes内,并打印出相应的信息,包括数据坐标和按下的鼠标按钮。
4. 创建交互式工具
利用Matplotlib的事件系统,我们可以创建各种交互式工具。以下是一些常见的交互式功能示例:
4.1 缩放和平移
import matplotlib.pyplot as plt
from matplotlib.widgets import RectangleSelector

def on_select(eclick, erelease):
    x1, y1 = eclick.xdata, eclick.ydata
    x2, y2 = erelease.xdata, erelease.ydata
    ax.set_xlim(min(x1, x2), max(x1, x2))
    ax.set_ylim(min(y1, y2), max(y1, y2))
    fig.canvas.draw()

fig, ax = plt.subplots()
ax.plot([1, 2, 3, 4], [1, 4, 2, 3])
ax.set_title('Drag to zoom - how2matplotlib.com')

rs = RectangleSelector(ax, on_select, useblit=True,
                       button=[1], minspanx=5, minspany=5,
                       spancoords='pixels', interactive=True)

plt.show()
Output:
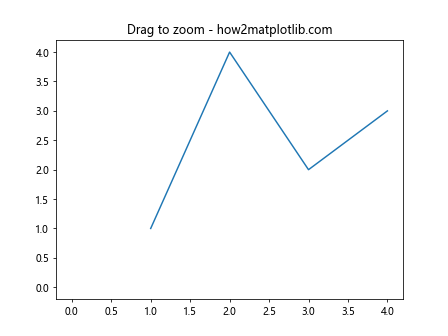
这个例子实现了一个简单的矩形选择缩放功能。用户可以通过拖动鼠标来选择一个矩形区域,图表会自动缩放到选定的区域。
4.2 数据点选择
import matplotlib.pyplot as plt
import numpy as np

def on_pick(event):
    ind = event.ind[0]
    print(f'Selected point: x={x[ind]:.2f}, y={y[ind]:.2f}')

x = np.random.rand(100)
y = np.random.rand(100)

fig, ax = plt.subplots()
scatter = ax.scatter(x, y, picker=True)
ax.set_title('Click on points to select - how2matplotlib.com')

fig.canvas.mpl_connect('pick_event', on_pick)

plt.show()
Output:
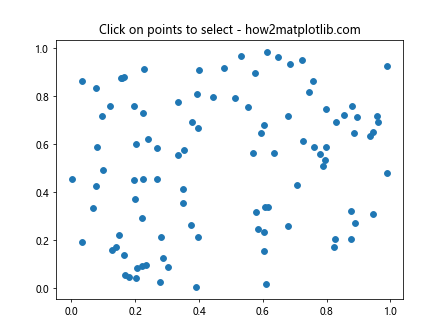
这个例子展示了如何实现数据点的选择功能。当用户点击散点图上的点时,会打印出被选中点的坐标。
4.3 动态更新图表
import matplotlib.pyplot as plt
import numpy as np

fig, ax = plt.subplots()
x = np.linspace(0, 10, 100)
line, = ax.plot(x, np.sin(x))
ax.set_title('Click to update sine wave - how2matplotlib.com')

def on_click(event):
    if event.inaxes == ax:
        freq = event.xdata
        line.set_ydata(np.sin(freq * x))
        fig.canvas.draw()

fig.canvas.mpl_connect('button_press_event', on_click)

plt.show()
Output:
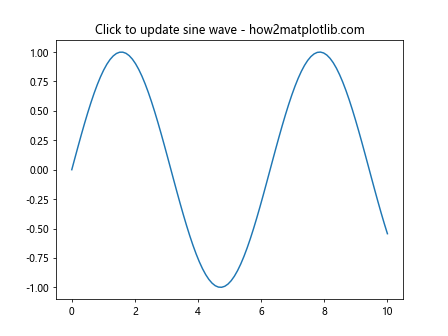
这个例子演示了如何动态更新图表。当用户点击图表时,正弦波的频率会根据点击位置的x坐标进行调整。
5. 高级事件处理技巧
5.1 事件过滤
有时我们可能只对特定类型的事件感兴趣。以下是一个示例,展示如何过滤鼠标右键点击事件:
import matplotlib.pyplot as plt

def on_right_click(event):
    if event.button == 3:  # 3 represents right mouse button
        print(f'Right-clicked at x={event.xdata:.2f}, y={event.ydata:.2f}')

fig, ax = plt.subplots()
ax.plot([1, 2, 3, 4], [1, 4, 2, 3])
ax.set_title('Right-click anywhere on the plot - how2matplotlib.com')

fig.canvas.mpl_connect('button_press_event', on_right_click)

plt.show()
Output:
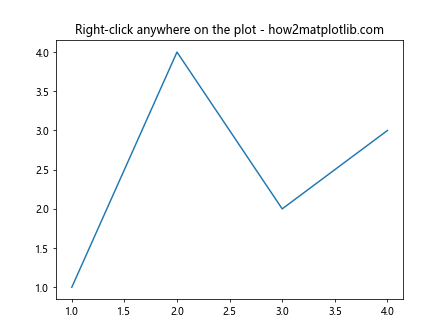
在这个例子中,我们只处理鼠标右键点击事件,忽略其他类型的鼠标点击。
5.2 多事件处理
有时我们需要在一个函数中处理多种类型的事件。以下是一个示例:
import matplotlib.pyplot as plt

def handle_events(event):
    if event.name == 'button_press_event':
        print(f'Mouse clicked at x={event.xdata:.2f}, y={event.ydata:.2f}')
    elif event.name == 'key_press_event':
        print(f'Key pressed: {event.key}')
    elif event.name == 'motion_notify_event':
        print(f'Mouse moved to x={event.xdata:.2f}, y={event.ydata:.2f}')

fig, ax = plt.subplots()
ax.plot([1, 2, 3, 4], [1, 4, 2, 3])
ax.set_title('Interact with the plot - how2matplotlib.com')

fig.canvas.mpl_connect('button_press_event', handle_events)
fig.canvas.mpl_connect('key_press_event', handle_events)
fig.canvas.mpl_connect('motion_notify_event', handle_events)

plt.show()
Output:
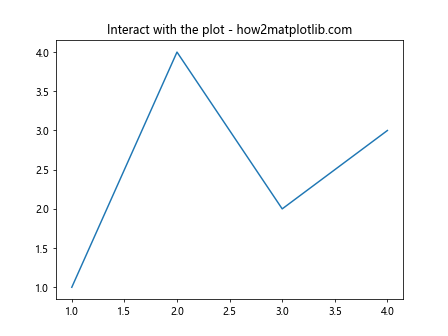
在这个例子中,我们使用一个函数来处理多种类型的事件,包括鼠标点击、键盘按键和鼠标移动。
5.3 自定义工具栏
Matplotlib允许我们自定义图形工具栏,添加自己的交互工具。以下是一个示例:
import matplotlib.pyplot as plt
from matplotlib.backends.backend_tkagg import NavigationToolbar2Tk

class CustomToolbar(NavigationToolbar2Tk):
    def __init__(self, canvas, parent):
        super().__init__(canvas, parent)
        self.add_custom_tool()

    def add_custom_tool(self):
        self.custom_btn = self.add_tool("Custom", self.on_custom_tool, "Custom tool")

    def on_custom_tool(self, event):
        print("Custom tool clicked - how2matplotlib.com")

fig, ax = plt.subplots()
ax.plot([1, 2, 3, 4], [1, 4, 2, 3])
ax.set_title('Plot with custom toolbar - how2matplotlib.com')

canvas = fig.canvas
toolbar = CustomToolbar(canvas, canvas.get_tk_widget().master)
canvas.get_tk_widget().pack()

plt.show()
在这个例子中,我们创建了一个自定义的工具栏类,并添加了一个自定义工具。当用户点击这个工具时,会打印一条消息。
6. 事件处理的最佳实践
在使用Matplotlib的事件处理系统时,以下是一些最佳实践:
- 保持事件处理函数简洁:避免在事件处理函数中执行耗时的操作,以保持界面的响应性。
-
使用防抖动(debounce)技术:对于频繁触发的事件(如鼠标移动),可以使用防抖动技术来限制事件处理的频率。
-
错误处理:在事件处理函数中添加适当的错误处理,以防止异常导致程序崩溃。
-
解耦事件处理逻辑:将事件处理逻辑与主要的绘图代码分开,以提高代码的可维护性。
-
使用面向对象的方法:对于复杂的交互式应用,考虑使用面向对象的方法来组织代码。
以下是一个结合了这些最佳实践的示例:
import matplotlib.pyplot as plt
from matplotlib.widgets import Button
import numpy as np
from functools import partial

class InteractivePlot:
    def __init__(self):
        self.fig, self.ax = plt.subplots()
        self.x = np.linspace(0, 10, 100)
        self.line, = self.ax.plot(self.x, np.sin(self.x))
        self.ax.set_title('Interactive Sine Wave - how2matplotlib.com')

        self.freq = 1.0
        self.amp = 1.0

        self.setup_buttons()
        self.connect_events()

    def setup_buttons(self):
        ax_freq = plt.axes([0.81, 0.05, 0.1, 0.075])
        ax_amp = plt.axes([0.81, 0.15, 0.1, 0.075])
        self.btn_freq = Button(ax_freq, 'Freq +0.1')
        self.btn_amp = Button(ax_amp, 'Amp +0.1')

    def connect_events(self):
        self.btn_freq.on_clicked(partial(self.update_param, 'freq'))
        self.btn_amp.on_clicked(partial(self.update_param, 'amp'))
        self.fig.canvas.mpl_connect('button_press_event', self.on_click)

    def update_param(self, param, event):
        if param == 'freq':
            self.freq += 0.1
        elif param == 'amp':
            self.amp += 0.1
        self.update_plot()

    def on_click(self, event):
        if event.inaxes == self.ax:
            self.freq = event.xdata
            self.update_plot()

    def update_plot(self):
        try:
            self.line.set_ydata(self.amp* np.sin(self.freq * self.x))
            self.fig.canvas.draw_idle()
        except Exception as e:
            print(f"Error updating plot: {e}")

if __name__ == "__main__":
    plot = InteractivePlot()
    plt.show()
Output:
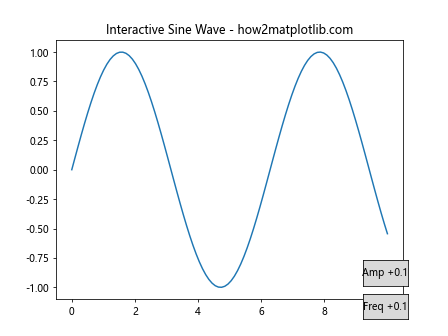
这个例子展示了一个交互式的正弦波图表。用户可以通过点击图表来改变频率,或者使用按钮来增加频率和振幅。代码使用了面向对象的方法,将事件处理逻辑封装在一个类中,并使用了错误处理来增强稳定性。
7. 高级交互式可视化示例
让我们来看一些更复杂的交互式可视化示例,这些例子展示了如何结合多种事件处理技术来创建丰富的用户交互体验。
7.1 交互式数据探索器
import matplotlib.pyplot as plt
import numpy as np
from matplotlib.widgets import RectangleSelector, Button

class DataExplorer:
    def __init__(self):
        self.fig, self.ax = plt.subplots()
        self.x = np.random.rand(1000)
        self.y = np.random.rand(1000)
        self.scatter = self.ax.scatter(self.x, self.y, picker=True)
        self.ax.set_title('Interactive Data Explorer - how2matplotlib.com')

        self.selected = []
        self.setup_widgets()
        self.connect_events()

    def setup_widgets(self):
        ax_reset = plt.axes([0.81, 0.05, 0.1, 0.075])
        self.btn_reset = Button(ax_reset, 'Reset')

    def connect_events(self):
        self.rs = RectangleSelector(self.ax, self.on_select, useblit=True,
                                    button=[1], minspanx=5, minspany=5,
                                    spancoords='pixels', interactive=True)
        self.fig.canvas.mpl_connect('pick_event', self.on_pick)
        self.btn_reset.on_clicked(self.reset)

    def on_select(self, eclick, erelease):
        x1, y1 = eclick.xdata, eclick.ydata
        x2, y2 = erelease.xdata, erelease.ydata
        self.selected = np.where((self.x > min(x1, x2)) & (self.x < max(x1, x2)) &
                                 (self.y > min(y1, y2)) & (self.y < max(y1, y2)))[0]
        self.update_plot()

    def on_pick(self, event):
        ind = event.ind[0]
        if ind in self.selected:
            self.selected.remove(ind)
        else:
            self.selected.append(ind)
        self.update_plot()

    def update_plot(self):
        colors = ['blue' if i not in self.selected else 'red' for i in range(len(self.x))]
        self.scatter.set_facecolors(colors)
        self.fig.canvas.draw_idle()

    def reset(self, event):
        self.selected = []
        self.update_plot()

if __name__ == "__main__":
    explorer = DataExplorer()
    plt.show()
Output:
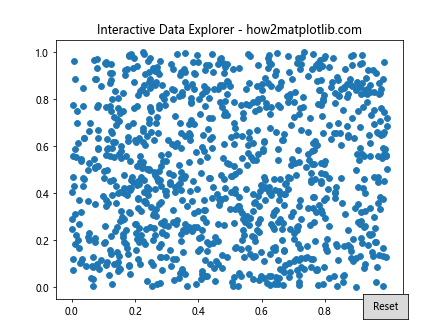
这个例子创建了一个交互式的数据探索器。用户可以通过矩形选择或点击来选择数据点,选中的点会变成红色。还有一个重置按钮可以清除所有选择。
7.2 实时数据可视化
import matplotlib.pyplot as plt
import numpy as np
from matplotlib.animation import FuncAnimation

class RealtimePlot:
    def __init__(self):
        self.fig, self.ax = plt.subplots()
        self.line, = self.ax.plot([], [], lw=2)
        self.ax.set_xlim(0, 100)
        self.ax.set_ylim(-1, 1)
        self.ax.set_title('Realtime Data Visualization - how2matplotlib.com')
        self.ax.grid()

        self.xdata, self.ydata = [], []
        self.paused = False

        self.setup_widgets()
        self.connect_events()

    def setup_widgets(self):
        ax_pause = plt.axes([0.81, 0.05, 0.1, 0.075])
        self.btn_pause = plt.Button(ax_pause, 'Pause')

    def connect_events(self):
        self.fig.canvas.mpl_connect('button_press_event', self.on_click)
        self.btn_pause.on_clicked(self.toggle_pause)

    def on_click(self, event):
        if event.inaxes == self.ax:
            self.ax.set_ylim(event.ydata - 1, event.ydata + 1)

    def toggle_pause(self, event):
        self.paused = not self.paused
        self.btn_pause.label.set_text('Resume' if self.paused else 'Pause')

    def update(self, frame):
        if not self.paused:
            t = frame / 10.0
            y = np.sin(2 * np.pi * t) * np.exp(-t/10.)
            self.xdata.append(frame)
            self.ydata.append(y)
            self.line.set_data(self.xdata, self.ydata)
            self.ax.relim()
            self.ax.autoscale_view()
        return self.line,

if __name__ == "__main__":
    plot = RealtimePlot()
    ani = FuncAnimation(plot.fig, plot.update, frames=range(1000),
                        blit=True, interval=50, repeat=False)
    plt.show()
Output:
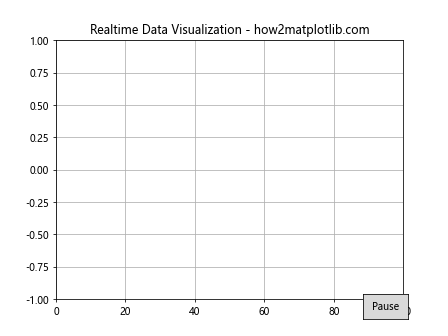
这个例子展示了一个实时数据可视化工具。它模拟了一个不断更新的数据流,并实时绘制在图表上。用户可以暂停/恢复动画,也可以通过点击来调整y轴的范围。
7.3 交互式图像处理器
import matplotlib.pyplot as plt
import numpy as np
from matplotlib.widgets import Slider, Button

class ImageProcessor:
    def __init__(self):
        self.fig, self.ax = plt.subplots()
        self.image = np.random.rand(100, 100)
        self.im = self.ax.imshow(self.image, cmap='viridis')
        self.ax.set_title('Interactive Image Processor - how2matplotlib.com')

        self.setup_widgets()
        self.connect_events()

    def setup_widgets(self):
        ax_brightness = plt.axes([0.25, 0.1, 0.65, 0.03])
        ax_contrast = plt.axes([0.25, 0.15, 0.65, 0.03])
        ax_reset = plt.axes([0.8, 0.025, 0.1, 0.04])

        self.slider_brightness = Slider(ax_brightness, 'Brightness', -1.0, 1.0, valinit=0)
        self.slider_contrast = Slider(ax_contrast, 'Contrast', 0.1, 3.0, valinit=1)
        self.btn_reset = Button(ax_reset, 'Reset')

    def connect_events(self):
        self.slider_brightness.on_changed(self.update)
        self.slider_contrast.on_changed(self.update)
        self.btn_reset.on_clicked(self.reset)

    def update(self, val):
        brightness = self.slider_brightness.val
        contrast = self.slider_contrast.val
        img = contrast * (self.image + brightness)
        img = np.clip(img, 0, 1)
        self.im.set_data(img)
        self.fig.canvas.draw_idle()

    def reset(self, event):
        self.slider_brightness.reset()
        self.slider_contrast.reset()

if __name__ == "__main__":
    processor = ImageProcessor()
    plt.show()
Output:
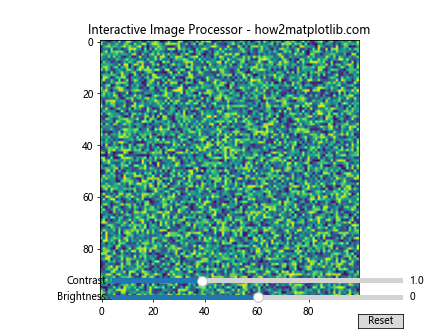
这个例子创建了一个交互式的图像处理器。用户可以通过滑块来调整图像的亮度和对比度,还可以使用重置按钮恢复原始状态。
8. 结合其他库的事件处理
Matplotlib的事件处理系统可以与其他Python库结合使用,以创建更复杂的交互式应用。以下是一些例子:
8.1 结合Tkinter的事件处理
import tkinter as tk
from matplotlib.backends.backend_tkagg import FigureCanvasTkAgg
import matplotlib.pyplot as plt
import numpy as np

class TkinterMatplotlibApp:
    def __init__(self, master):
        self.master = master
        self.master.title("Tkinter + Matplotlib - how2matplotlib.com")

        self.fig, self.ax = plt.subplots()
        self.x = np.linspace(0, 10, 100)
        self.line, = self.ax.plot(self.x, np.sin(self.x))

        self.canvas = FigureCanvasTkAgg(self.fig, master=self.master)
        self.canvas.draw()
        self.canvas.get_tk_widget().pack(side=tk.TOP, fill=tk.BOTH, expand=1)

        self.button = tk.Button(master, text="Update", command=self.update_plot)
        self.button.pack()

        self.canvas.mpl_connect('button_press_event', self.on_click)

    def update_plot(self):
        self.line.set_ydata(np.sin(self.x + np.random.rand()))
        self.canvas.draw()

    def on_click(self, event):
        if event.inaxes == self.ax:
            print(f"Clicked at x={event.xdata:.2f}, y={event.ydata:.2f}")

if __name__ == "__main__":
    root = tk.Tk()
    app = TkinterMatplotlibApp(root)
    root.mainloop()
这个例子展示了如何将Matplotlib嵌入到Tkinter应用中,并结合两者的事件处理系统。
8.2 结合PyQt的事件处理
import sys
from PyQt5.QtWidgets import QApplication, QMainWindow, QVBoxLayout, QPushButton, QWidget
from matplotlib.backends.backend_qt5agg import FigureCanvasQTAgg as FigureCanvas
import matplotlib.pyplot as plt
import numpy as np

class PyQtMatplotlibApp(QMainWindow):
    def __init__(self):
        super().__init__()
        self.setWindowTitle("PyQt + Matplotlib - how2matplotlib.com")
        self.setGeometry(100, 100, 600, 400)

        central_widget = QWidget()
        self.setCentralWidget(central_widget)
        layout = QVBoxLayout(central_widget)

        self.fig, self.ax = plt.subplots()
        self.x = np.linspace(0, 10, 100)
        self.line, = self.ax.plot(self.x, np.sin(self.x))

        self.canvas = FigureCanvas(self.fig)
        layout.addWidget(self.canvas)

        button = QPushButton("Update")
        button.clicked.connect(self.update_plot)
        layout.addWidget(button)

        self.canvas.mpl_connect('button_press_event', self.on_click)

    def update_plot(self):
        self.line.set_ydata(np.sin(self.x + np.random.rand()))
        self.canvas.draw()

    def on_click(self, event):
        if event.inaxes == self.ax:
            print(f"Clicked at x={event.xdata:.2f}, y={event.ydata:.2f}")

if __name__ == "__main__":
    app = QApplication(sys.argv)
    window = PyQtMatplotlibApp()
    window.show()
    sys.exit(app.exec_())
这个例子展示了如何将Matplotlib嵌入到PyQt应用中,并结合两者的事件处理系统。
9. 性能优化
在处理大量数据或频繁更新的情况下,可能会遇到性能问题。以下是一些优化Matplotlib事件处理性能的技巧:
- 使用blitting:对于动画或频繁更新的图表,使用blitting技术可以显著提高性能。
-
限制重绘区域:只重绘发生变化的区域,而不是整个图表。
-
使用适当的数据结构:对于大量数据点,考虑使用更高效的数据结构,如pandas DataFrame或NumPy数组。
-
异步更新:对于耗时的操作,考虑使用异步更新来保持UI的响应性。
-
使用缓存:对于计算密集型的操作,可以缓存中间结果以避免重复计算。
以下是一个使用blitting技术的优化示例:
import matplotlib.pyplot as plt
import numpy as np
from matplotlib.animation import FuncAnimation

class OptimizedPlot:
    def __init__(self):
        self.fig, self.ax = plt.subplots()
        self.ax.set_xlim(0, 2*np.pi)
        self.ax.set_ylim(-1, 1)
        self.ax.set_title('Optimized Animation - how2matplotlib.com')

        self.line, = self.ax.plot([], [], lw=2)
        self.x = np.linspace(0, 2*np.pi, 200)

        # Set up the background for blitting
        self.fig.canvas.draw()
        self.background = self.fig.canvas.copy_from_bbox(self.ax.bbox)

    def init(self):
        self.line.set_data([], [])
        return self.line,

    def update(self, frame):
        y = np.sin(self.x + frame/10.0)

        # Restore the background
        self.fig.canvas.restore_region(self.background)

        # Update the line
        self.line.set_data(self.x, y)
        self.ax.draw_artist(self.line)

        # Blit only the necessary part
        self.fig.canvas.blit(self.ax.bbox)

        return self.line,

if __name__ == "__main__":
    plot = OptimizedPlot()
    ani = FuncAnimation(plot.fig, plot.update, frames=range(200),
                        init_func=plot.init, blit=True, interval=20)
    plt.show()
Output:
这个例子使用了blitting技术来优化动画性能。通过只更新发生变化的部分,而不是重绘整个图表,可以显著提高动画的帧率和流畅度。
10. 调试事件处理
在开发复杂的交互式可视化时,调试事件处理代码可能会比较困难。以下是一些有用的调试技巧:
- 使用日志记录:在事件处理函数中添加日志记录,以跟踪事件的触发和处理过程。
-
事件监听器:创建一个通用的事件监听器来捕获所有事件,这可以帮助你了解事件的触发顺序和频率。
-
使用断点:在关键的事件处理函数中设置断点,以便在调试器中逐步执行代码。
-
状态打印:在更新图表之前打印当前的状态变量,以确保数据更新正确。
-
使用Matplotlib的verbose模式:设置Matplotlib的verbose模式可以获得更多的调试信息。
以下是一个包含调试技巧的示例:
import matplotlib.pyplot as plt
import numpy as np
import logging

# 设置日志记录
logging.basicConfig(level=logging.DEBUG)
logger = logging.getLogger(__name__)

class DebuggablePlot:
    def __init__(self):
        self.fig, self.ax = plt.subplots()
        self.x = np.linspace(0, 10, 100)
        self.line, = self.ax.plot(self.x, np.sin(self.x))
        self.ax.set_title('Debuggable Plot - how2matplotlib.com')

        self.freq = 1.0
        self.amp = 1.0

        self.connect_events()

    def connect_events(self):
        self.fig.canvas.mpl_connect('button_press_event', self.on_click)
        self.fig.canvas.mpl_connect('key_press_event', self.on_key)

    def on_click(self, event):
        if event.inaxes == self.ax:
            logger.debug(f"Click event: x={event.xdata:.2f}, y={event.ydata:.2f}")
            self.freq = event.xdata
            self.update_plot()

    def on_key(self, event):
        logger.debug(f"Key press event: key={event.key}")
        if event.key == 'up':
            self.amp += 0.1
        elif event.key == 'down':
            self.amp -= 0.1
        self.update_plot()

    def update_plot(self):
        logger.info(f"Updating plot: freq={self.freq:.2f}, amp={self.amp:.2f}")
        y = self.amp * np.sin(self.freq * self.x)
        self.line.set_ydata(y)
        self.fig.canvas.draw_idle()

if __name__ == "__main__":
    plt.rcParams['verbose.level'] = 'debug'  # 设置Matplotlib的verbose模式
    plot = DebuggablePlot()
    plt.show()
这个例子展示了如何在交互式图表中添加日志记录和调试信息。它记录了鼠标点击和键盘事件,以及图表更新时的状态信息。
11. 事件处理的高级应用
随着对Matplotlib事件处理系统的深入理解,我们可以创建更复杂和强大的交互式可视化应用。以下是一些高级应用的示例:
11.1 自定义交互式工具
我们可以创建自定义的交互式工具,比如一个可以在图表上绘制和编辑形状的工具:
import matplotlib.pyplot as plt
from matplotlib.patches import Rectangle
from matplotlib.widgets import Button

class ShapeDrawer:
    def __init__(self):
        self.fig, self.ax = plt.subplots()
        self.ax.set_xlim(0, 10)
        self.ax.set_ylim(0, 10)
        self.ax.set_title('Shape Drawer - how2matplotlib.com')

        self.shapes = []
        self.current_shape = None
        self.start_point = None

        self.setup_buttons()
        self.connect_events()

    def setup_buttons(self):
        ax_rect = plt.axes([0.81, 0.05, 0.1, 0.075])
        self.btn_rect = Button(ax_rect, 'Rectangle')

    def connect_events(self):
        self.fig.canvas.mpl_connect('button_press_event', self.on_press)
        self.fig.canvas.mpl_connect('button_release_event', self.on_release)
        self.fig.canvas.mpl_connect('motion_notify_event', self.on_motion)
        self.btn_rect.on_clicked(self.set_rectangle_mode)

    def set_rectangle_mode(self, event):
        self.current_shape = 'rectangle'

    def on_press(self, event):
        if event.inaxes != self.ax or self.current_shape is None:
            return
        self.start_point = (event.xdata, event.ydata)

    def on_release(self, event):
        if event.inaxes != self.ax or self.current_shape is None:
            return
        end_point = (event.xdata, event.ydata)
        if self.current_shape == 'rectangle':
            self.draw_rectangle(self.start_point, end_point)
        self.start_point = None

    def on_motion(self, event):
        if event.inaxes != self.ax or self.start_point is None:
            return
        if self.current_shape == 'rectangle':
            self.update_rectangle(event.xdata, event.ydata)

    def draw_rectangle(self, start, end):
        x = min(start[0], end[0])
        y = min(start[1], end[1])
        width = abs(end[0] - start[0])
        height = abs(end[1] - start[1])
        rect = Rectangle((x, y), width, height, fill=False)
        self.ax.add_patch(rect)
        self.shapes.append(rect)
        self.fig.canvas.draw()

    def update_rectangle(self, x, y):
        if self.shapes and isinstance(self.shapes[-1], Rectangle):
            rect = self.shapes[-1]
            x0, y0 = self.start_point
            width = abs(x - x0)
            height = abs(y - y0)
            rect.set_width(width)
            rect.set_height(height)
            rect.set_xy((min(x0, x), min(y0, y)))
            self.fig.canvas.draw()

if __name__ == "__main__":
    drawer = ShapeDrawer()
    plt.show()
Output:
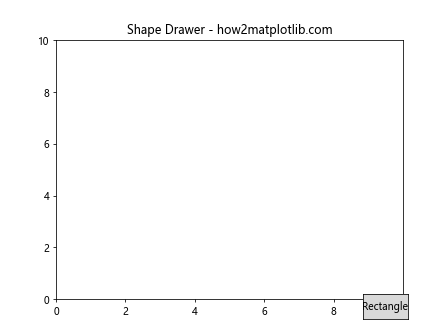
这个例子创建了一个简单的形状绘制工具,允许用户在图表上绘制矩形。
11.2 数据分析工具
我们可以创建一个交互式的数据分析工具,允许用户选择数据点并执行简单的统计分析:
import matplotlib.pyplot as plt
import numpy as np
from matplotlib.widgets import RectangleSelector, Button

class DataAnalyzer:
    def __init__(self):
        self.fig, self.ax = plt.subplots()
        self.x = np.random.rand(1000)
        self.y = np.random.rand(1000)
        self.scatter = self.ax.scatter(self.x, self.y, picker=True)
        self.ax.set_title('Data Analyzer - how2matplotlib.com')

        self.selected = []
        self.setup_widgets()
        self.connect_events()

    def setup_widgets(self):
        ax_analyze = plt.axes([0.81, 0.05, 0.1, 0.075])
        self.btn_analyze = Button(ax_analyze, 'Analyze')

    def connect_events(self):
        self.rs = RectangleSelector(self.ax, self.on_select, useblit=True,
                                    button=[1], minspanx=5, minspany=5,
                                    spancoords='pixels', interactive=True)
        self.fig.canvas.mpl_connect('pick_event', self.on_pick)
        self.btn_analyze.on_clicked(self.analyze_data)

    def on_select(self, eclick, erelease):
        x1, y1 = eclick.xdata, eclick.ydata
        x2, y2 = erelease.xdata, erelease.ydata
        self.selected = np.where((self.x > min(x1, x2)) & (self.x < max(x1, x2)) &
                                 (self.y > min(y1, y2)) & (self.y < max(y1, y2)))[0]
        self.update_plot()

    def on_pick(self, event):
        ind = event.ind[0]
        if ind in self.selected:
            self.selected.remove(ind)
        else:
            self.selected.append(ind)
        self.update_plot()

    def update_plot(self):
        colors = ['blue' if i not in self.selected else 'red' for i in range(len(self.x))]
        self.scatter.set_facecolors(colors)
        self.fig.canvas.draw_idle()

    def analyze_data(self, event):
        if len(self.selected) > 0:
            selected_x = self.x[self.selected]
            selected_y = self.y[self.selected]
            mean_x = np.mean(selected_x)
            mean_y = np.mean(selected_y)
            std_x = np.std(selected_x)
            std_y = np.std(selected_y)
            correlation = np.corrcoef(selected_x, selected_y)[0, 1]

            print(f"Analysis results for {len(self.selected)} selected points:")
            print(f"Mean X: {mean_x:.4f}")
            print(f"Mean Y: {mean_y:.4f}")
            print(f"Std X: {std_x:.4f}")
            print(f"Std Y: {std_y:.4f}")
            print(f"Correlation: {correlation:.4f}")
        else:
            print("No data points selected for analysis.")

if __name__ == "__main__":
    analyzer = DataAnalyzer()
    plt.show()
Output:
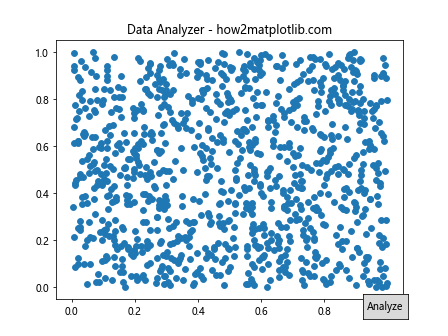
这个例子创建了一个数据分析工具,允许用户选择数据点并计算基本的统计信息。
12. 结论
Matplotlib的事件处理系统为创建交互式数据可视化提供了强大的工具。通过本文的介绍,我们探讨了从基本概念到高级应用的各个方面,包括:
- 事件系统的基本原理和常见事件类型
- 如何连接事件处理函数和使用事件对象
- 创建各种交互式工具和可视化应用
- 结合其他GUI库使用Matplotlib
- 性能优化和调试技巧
- 高级应用示例
掌握这些技能将使您能够创建丰富、交互式的数据可视化应用,大大增强数据分析和展示的效果。随着实践的深入,您将能够开发出更复杂、更强大的交互式可视化工具,为数据分析和科学研究提供有力支持。
记住,创建优秀的交互式可视化不仅需要技术技能,还需要对数据和用户需求的深入理解。持续学习和实践将帮助您在这个领域不断进步,创造出更有价值的数据可视化作品。
 极客教程
极客教程