Matplotlib绘制水平条形图:全面指南与实例
参考:Draw a horizontal bar chart with Matplotlib
Matplotlib是Python中最流行的数据可视化库之一,它提供了丰富的绘图功能,其中包括绘制水平条形图。水平条形图是一种常用的数据可视化方式,特别适合展示分类数据的比较和排序。本文将全面介绍如何使用Matplotlib绘制水平条形图,包括基础绘制、自定义样式、多组数据比较等多个方面,并提供详细的示例代码和解释。
1. 基础水平条形图
首先,让我们从最基本的水平条形图开始。使用Matplotlib的barh()函数可以轻松创建水平条形图。
import matplotlib.pyplot as plt

categories = ['Category A', 'Category B', 'Category C', 'Category D']
values = [4, 7, 2, 5]

plt.figure(figsize=(10, 6))
plt.barh(categories, values)
plt.title('Basic Horizontal Bar Chart - how2matplotlib.com')
plt.xlabel('Values')
plt.ylabel('Categories')
plt.show()
Output:
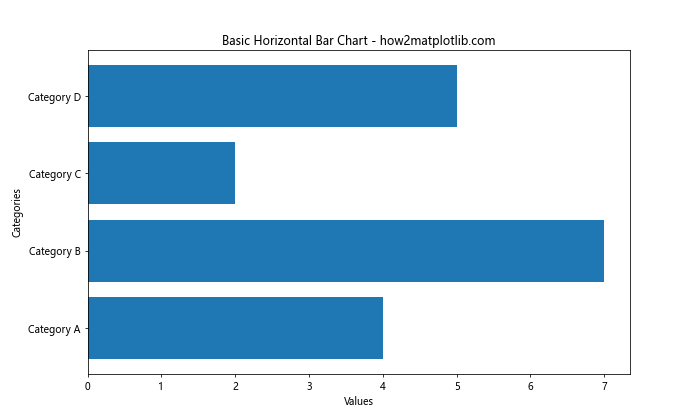
这段代码创建了一个简单的水平条形图。plt.barh()函数接受两个主要参数:类别标签和对应的数值。figsize参数设置图表的大小,title、xlabel和ylabel分别设置图表标题和坐标轴标签。
2. 自定义条形颜色
可以通过color参数自定义条形的颜色,使图表更具吸引力。
import matplotlib.pyplot as plt

categories = ['Product A', 'Product B', 'Product C', 'Product D']
sales = [300, 400, 350, 450]

plt.figure(figsize=(10, 6))
plt.barh(categories, sales, color='skyblue')
plt.title('Sales by Product - how2matplotlib.com')
plt.xlabel('Sales (units)')
plt.ylabel('Products')
plt.show()
Output:
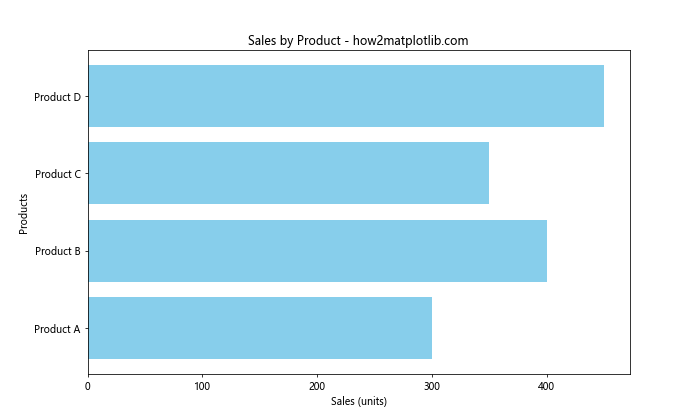
在这个例子中,我们将所有条形的颜色设置为天蓝色(skyblue)。你可以使用任何有效的颜色名称或十六进制颜色代码。
3. 添加数值标签
为了使图表更加信息丰富,我们可以在每个条形的末端添加数值标签。
import matplotlib.pyplot as plt

categories = ['Team A', 'Team B', 'Team C', 'Team D']
scores = [85, 92, 78, 89]

fig, ax = plt.subplots(figsize=(10, 6))
bars = ax.barh(categories, scores, color='lightgreen')

ax.set_title('Team Scores - how2matplotlib.com')
ax.set_xlabel('Scores')
ax.set_ylabel('Teams')

for bar in bars:
    width = bar.get_width()
    ax.text(width, bar.get_y() + bar.get_height()/2, f'{width}',
            ha='left', va='center')

plt.show()
Output:
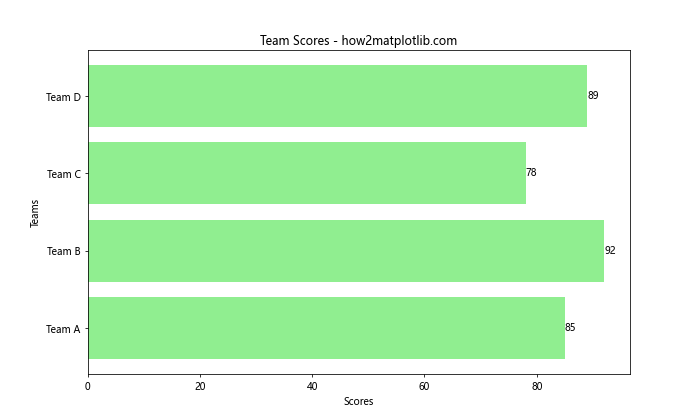
这个例子展示了如何在每个条形的右侧添加数值标签。我们遍历每个条形对象,获取其宽度(即数值),然后使用ax.text()方法在适当的位置添加文本。
4. 排序条形
通常,我们希望按照数值大小对条形进行排序,以便更清晰地展示数据的排名。
import matplotlib.pyplot as plt

countries = ['USA', 'China', 'Japan', 'Germany', 'UK']
gdp = [21.43, 14.34, 5.08, 3.86, 2.67]

# 对数据进行排序
sorted_data = sorted(zip(gdp, countries), reverse=True)
gdp_sorted, countries_sorted = zip(*sorted_data)

plt.figure(figsize=(10, 6))
plt.barh(countries_sorted, gdp_sorted, color='coral')
plt.title('Top 5 Countries by GDP (Trillion USD) - how2matplotlib.com')
plt.xlabel('GDP (Trillion USD)')
plt.ylabel('Countries')

for i, v in enumerate(gdp_sorted):
    plt.text(v, i, f' {v}', va='center')

plt.show()
Output:
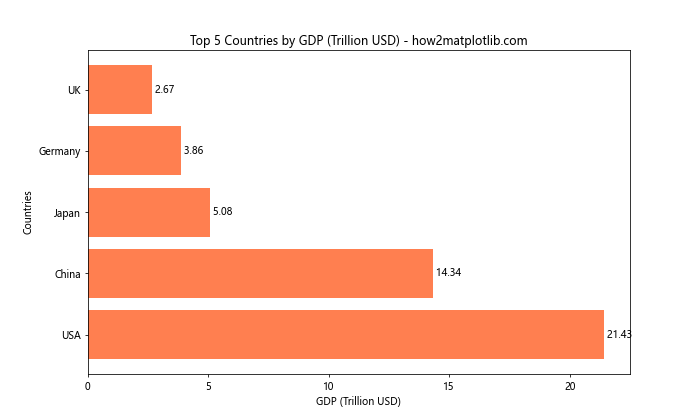
在这个例子中,我们首先将GDP数据和国家名称配对,然后按GDP降序排序。这样可以确保条形图从上到下按GDP值从大到小排列。
5. 使用不同颜色
为每个条形使用不同的颜色可以增加图表的视觉吸引力,并有助于区分不同类别。
import matplotlib.pyplot as plt

fruits = ['Apples', 'Bananas', 'Oranges', 'Grapes', 'Strawberries']
sales = [35, 25, 30, 20, 15]
colors = ['red', 'yellow', 'orange', 'purple', 'pink']

plt.figure(figsize=(10, 6))
bars = plt.barh(fruits, sales, color=colors)
plt.title('Fruit Sales - how2matplotlib.com')
plt.xlabel('Sales (tons)')
plt.ylabel('Fruits')

for bar in bars:
    width = bar.get_width()
    plt.text(width, bar.get_y() + bar.get_height()/2, f'{width}',
             ha='left', va='center')

plt.show()
Output:
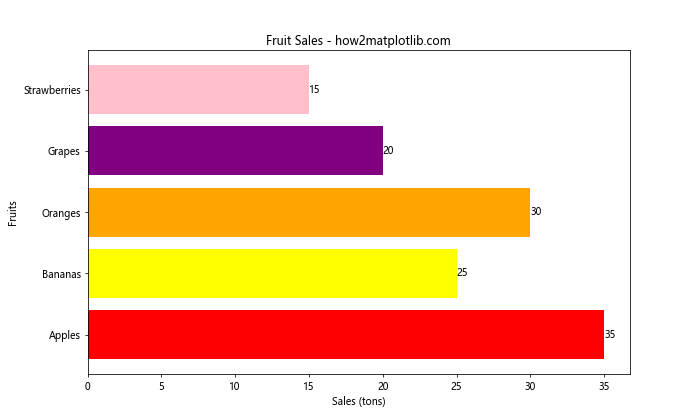
这个例子为每种水果分配了一个独特的颜色,使得图表更加生动有趣。
6. 添加误差条
在某些情况下,我们可能需要显示数据的不确定性或变异性。这可以通过添加误差条来实现。
import matplotlib.pyplot as plt
import numpy as np

categories = ['Category A', 'Category B', 'Category C', 'Category D']
values = [4, 7, 2, 5]
errors = [0.5, 1, 0.3, 0.8]

plt.figure(figsize=(10, 6))
plt.barh(categories, values, xerr=errors, capsize=5, color='lightblue', ecolor='red')
plt.title('Horizontal Bar Chart with Error Bars - how2matplotlib.com')
plt.xlabel('Values')
plt.ylabel('Categories')
plt.show()
Output:
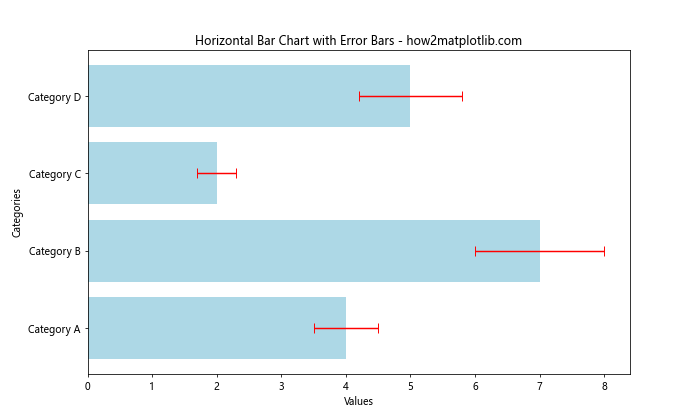
在这个例子中,xerr参数用于指定误差值,capsize参数设置误差条末端横线的长度,ecolor参数设置误差条的颜色。
7. 堆叠水平条形图
堆叠条形图可以用来展示多个相关类别的数据。
import matplotlib.pyplot as plt
import numpy as np

categories = ['Category A', 'Category B', 'Category C', 'Category D']
men_values = [20, 35, 30, 35]
women_values = [25, 32, 34, 20]

plt.figure(figsize=(10, 6))
plt.barh(categories, men_values, label='Men', color='skyblue')
plt.barh(categories, women_values, left=men_values, label='Women', color='pink')

plt.title('Stacked Horizontal Bar Chart - how2matplotlib.com')
plt.xlabel('Values')
plt.ylabel('Categories')
plt.legend()
plt.show()
Output:
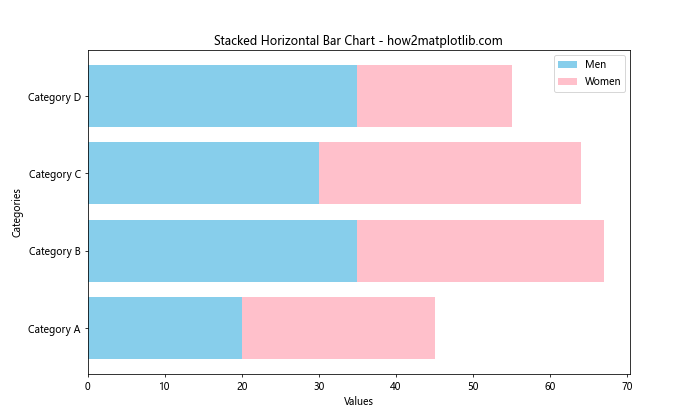
这个例子创建了一个堆叠水平条形图,展示了男性和女性在不同类别中的数值。left参数用于指定每个条形的起始位置。
8. 分组水平条形图
分组条形图可以用来并排比较多个类别的数据。
import matplotlib.pyplot as plt
import numpy as np

categories = ['Category A', 'Category B', 'Category C', 'Category D']
group1 = [4, 7, 2, 5]
group2 = [3, 6, 4, 3]

y = np.arange(len(categories))
height = 0.35

fig, ax = plt.subplots(figsize=(10, 6))
ax.barh(y - height/2, group1, height, label='Group 1', color='skyblue')
ax.barh(y + height/2, group2, height, label='Group 2', color='lightgreen')

ax.set_yticks(y)
ax.set_yticklabels(categories)
ax.legend()

plt.title('Grouped Horizontal Bar Chart - how2matplotlib.com')
plt.xlabel('Values')
plt.show()
Output:
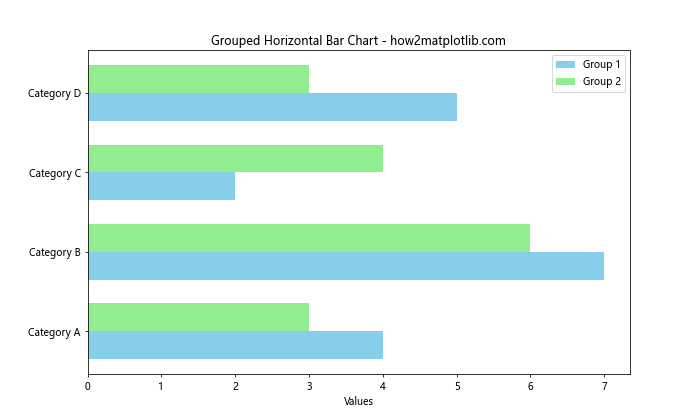
这个例子创建了一个分组水平条形图,展示了两个组的数据。我们使用y - height/2和y + height/2来调整每组条形的位置,使它们并排显示。
9. 添加网格线
添加网格线可以帮助读者更准确地解读数据。
import matplotlib.pyplot as plt

categories = ['Product A', 'Product B', 'Product C', 'Product D', 'Product E']
sales = [120, 98, 145, 87, 132]

plt.figure(figsize=(10, 6))
plt.barh(categories, sales, color='lightcoral')
plt.title('Product Sales - how2matplotlib.com')
plt.xlabel('Sales (units)')
plt.ylabel('Products')

plt.grid(axis='x', linestyle='--', alpha=0.7)
plt.show()
Output:
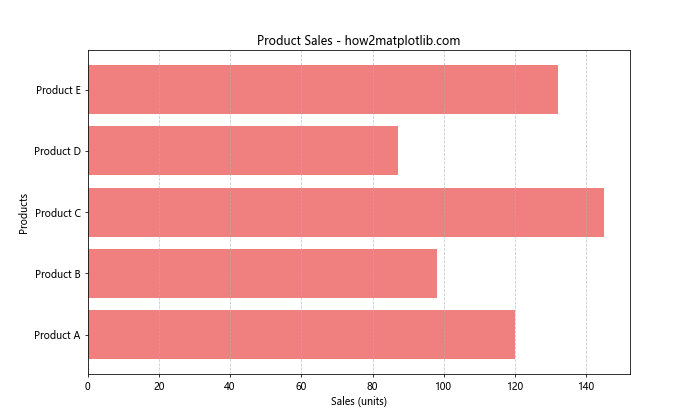
在这个例子中,我们使用plt.grid()函数添加了垂直网格线。axis='x'参数指定只显示垂直网格线,linestyle='--'设置网格线为虚线,alpha=0.7调整网格线的透明度。
10. 自定义刻度标签
有时我们可能需要自定义坐标轴的刻度标签,以更好地展示数据。
import matplotlib.pyplot as plt

categories = ['A', 'B', 'C', 'D', 'E']
values = [100, 200, 300, 400, 500]

fig, ax = plt.subplots(figsize=(10, 6))
bars = ax.barh(categories, values, color='lightseagreen')

ax.set_title('Custom Tick Labels - how2matplotlib.com')
ax.set_xlabel('Values (in thousands)')
ax.set_ylabel('Categories')

# 自定义x轴刻度标签
ax.set_xticks([0, 100, 200, 300, 400, 500])
ax.set_xticklabels(['0', '100K', '200K', '300K', '400K', '500K'])

for bar in bars:
    width = bar.get_width()
    ax.text(width, bar.get_y() + bar.get_height()/2, f'{width}K',
            ha='left', va='center')

plt.show()
Output:
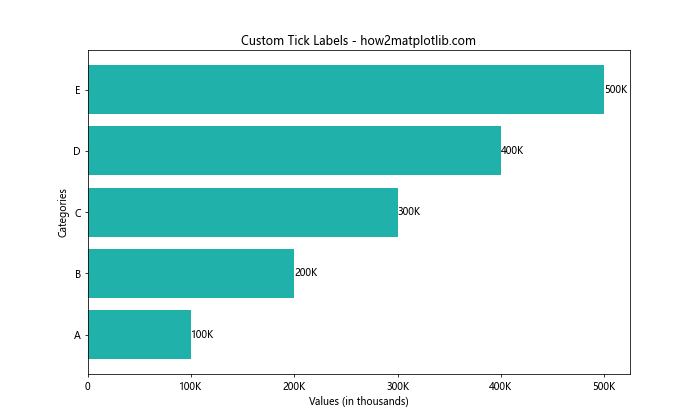
这个例子展示了如何自定义x轴的刻度标签。我们使用set_xticks()设置刻度位置,然后用set_xticklabels()自定义刻度标签的文本。
11. 添加平均线
在某些情况下,添加一条表示平均值的垂直线可以帮助读者快速了解数据的整体情况。
import matplotlib.pyplot as plt
import numpy as np

categories = ['Item 1', 'Item 2', 'Item 3', 'Item 4', 'Item 5']
values = [23, 17, 35, 29, 12]

fig, ax = plt.subplots(figsize=(10, 6))
ax.barh(categories, values, color='lightsalmon')

mean_value = np.mean(values)
ax.axvline(mean_value, color='red', linestyle='--', label='Mean')

ax.set_title('Sales with Mean Line - how2matplotlib.com')
ax.set_xlabel('Sales')
ax.set_ylabel('Items')

ax.legend()
plt.show()
Output:
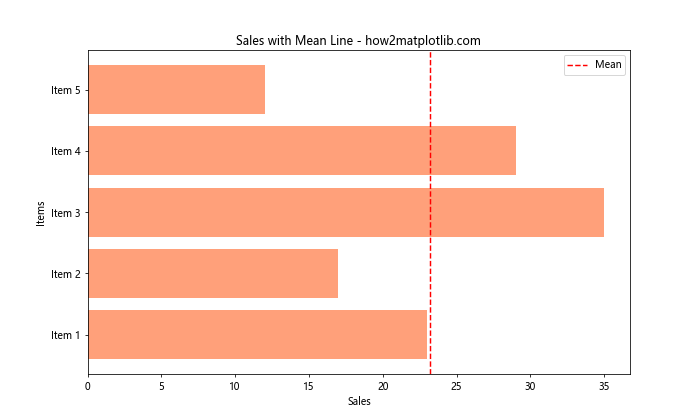
这个例子使用np.mean()计算平均值,然后用ax.axvline()添加一条垂直线来表示平均值。
12. 条形图与折线图结合
有时,我们可能需要在同一图表中展示不同类型的数据,比如将条形图与折线图结合。
import matplotlib.pyplot as plt

categories = ['Jan', 'Feb', 'Mar', 'Apr', 'May']
sales = [100, 120, 80, 140, 110]
profit_margin = [10, 15, 8, 12, 14]

fig, ax1 = plt.subplots(figsize=(10, 6))

# 绘制条形图
ax1.barh(categories, sales, color='skyblue', alpha=0.7)
ax1.set_xlabel('Sales')
ax1.set_ylabel('Months')
ax1.set_title('Sales and Profit Margin - how2matplotlib.com')

# 创建第二个y轴
ax2 = ax1.twiny()

# 绘制折线图
ax2.plot(profit_margin, categories, color='red', marker='o')
ax2.set_xlabel('Profit Margin (%)')

plt.tight_layout()
plt.show()
Output:
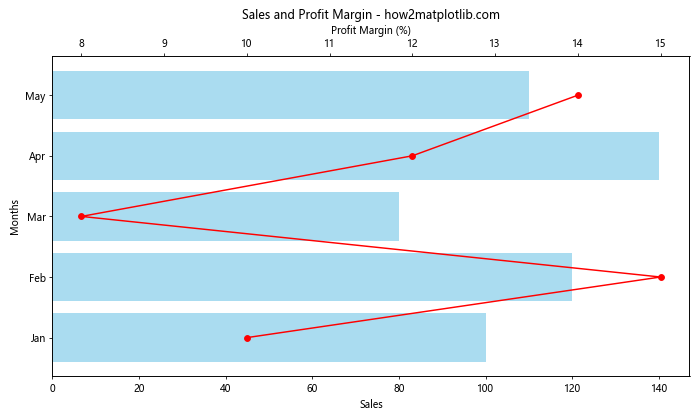
这个例子展示了如何在一个图表中结合水平条形图和折线图。我们使用ax1.barh()绘制销售数据的条形图,然后使用ax1.twiny()创建一个共享y轴的新x轴。最后,我们在新的坐标系上使用ax2.plot()绘制利润率的折线图。
13. 条形图内添加文本
有时,我们可能希望在条形内部添加文本信息,以提供更多上下文。
import matplotlib.pyplot as plt

categories = ['Category A', 'Category B', 'Category C', 'Category D']
values = [75, 55, 80, 40]

fig, ax = plt.subplots(figsize=(10, 6))
bars = ax.barh(categories, values, color='lightgreen')

ax.set_title('Categories and Values - how2matplotlib.com')
ax.set_xlabel('Values')
ax.set_ylabel('Categories')

for i, bar in enumerate(bars):
    width = bar.get_width()
    ax.text(width/2, bar.get_y() + bar.get_height()/2, f'Value: {values[i]}',
            ha='center', va='center')

plt.show()
Output:
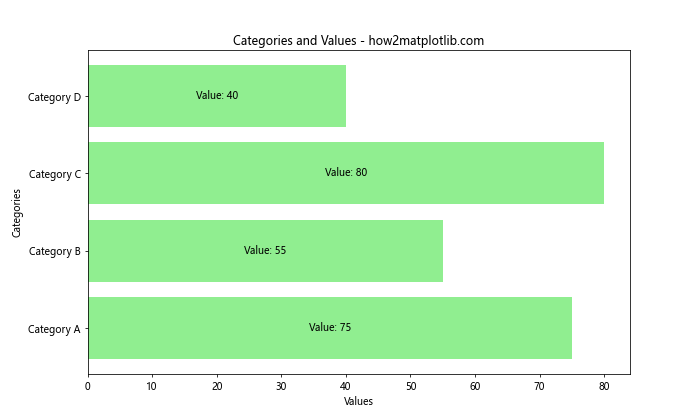
在这个例子中,我们使用ax.text()方法在每个条形的中心位置添加了文本。通过计算条形的宽度和高度的中点,我们可以精确地将文本放置在条形的中央。
14. 条形图与数据表结合
有时,将图表与数据表结合可以提供更全面的信息展示。
import matplotlib.pyplot as plt

categories = ['Product A', 'Product B', 'Product C', 'Product D']
sales = [1200, 1500, 1100, 1800]
growth = ['+5%', '+10%', '-2%', '+15%']

fig, (ax1, ax2) = plt.subplots(nrows=2, figsize=(10, 8), gridspec_kw={'height_ratios': [3, 1]})

# 绘制条形图
bars = ax1.barh(categories, sales, color='lightblue')
ax1.set_title('Product Sales and Growth - how2matplotlib.com')
ax1.set_xlabel('Sales')

# 添加数值标签
for bar in bars:
    width = bar.get_width()
    ax1.text(width, bar.get_y() + bar.get_height()/2, f'{width}', ha='left', va='center')

# 创建数据表
ax2.axis('tight')
ax2.axis('off')
table = ax2.table(cellText=[sales, growth], rowLabels=['Sales', 'Growth'],
                  colLabels=categories, loc='center', cellLoc='center')
table.auto_set_font_size(False)
table.set_fontsize(10)
table.scale(1, 1.5)

plt.tight_layout()
plt.show()
Output:
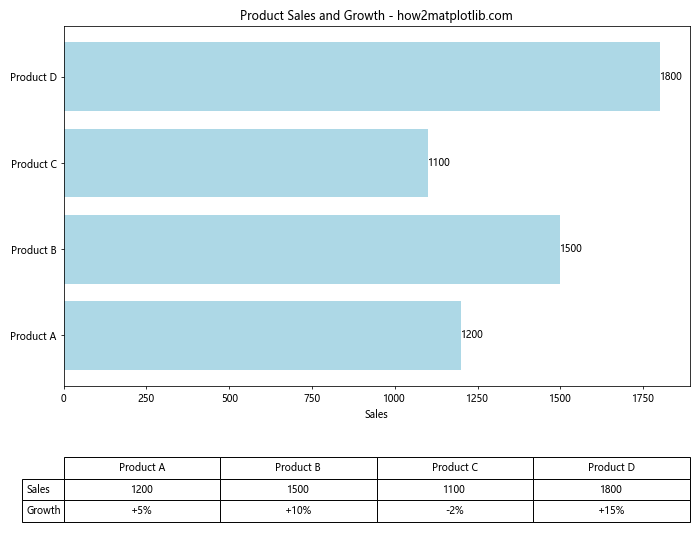
这个例子展示了如何在同一图表中结合水平条形图和数据表。我们使用plt.subplots()创建两个子图,一个用于条形图,另一个用于数据表。ax2.table()函数用于创建数据表。
15. 条形图与饼图结合
有时,我们可能希望同时展示总体分布和各部分的具体数值。这时可以考虑将条形图与饼图结合。
import matplotlib.pyplot as plt

categories = ['Category A', 'Category B', 'Category C', 'Category D']
values = [35, 25, 20, 20]

fig, (ax1, ax2) = plt.subplots(ncols=2, figsize=(12, 6))

# 绘制水平条形图
ax1.barh(categories, values, color='skyblue')
ax1.set_title('Values by Category - how2matplotlib.com')
ax1.set_xlabel('Values')
ax1.set_ylabel('Categories')

# 绘制饼图
ax2.pie(values, labels=categories, autopct='%1.1f%%', startangle=90)
ax2.set_title('Percentage Distribution - how2matplotlib.com')

plt.tight_layout()
plt.show()
Output:
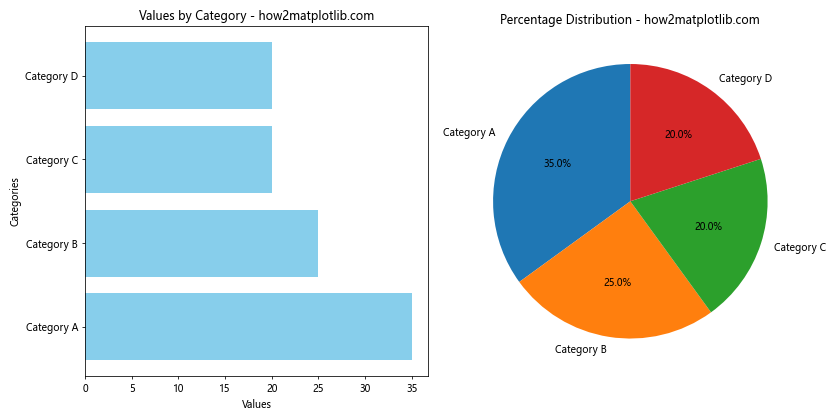
这个例子展示了如何在同一图表中结合水平条形图和饼图。左侧的条形图显示了各类别的具体数值,而右侧的饼图展示了各类别在总体中的占比。
16. 动态更新的条形图
在某些应用场景中,我们可能需要创建一个动态更新的条形图。虽然这超出了静态图表的范畴,但了解这种可能性也是有益的。
import matplotlib.pyplot as plt
import matplotlib.animation as animation
import numpy as np

categories = ['A', 'B', 'C', 'D', 'E']
values = [0, 0, 0, 0, 0]

fig, ax = plt.subplots(figsize=(10, 6))

def animate(frame):
    ax.clear()
    values[frame % 5] = np.random.randint(1, 100)
    bars = ax.barh(categories, values, color='lightgreen')
    ax.set_title('Dynamic Horizontal Bar Chart - how2matplotlib.com')
    ax.set_xlabel('Values')
    ax.set_ylabel('Categories')
    ax.set_xlim(0, 100)
    for bar in bars:
        width = bar.get_width()
        ax.text(width, bar.get_y() + bar.get_height()/2, f'{width}', ha='left', va='center')

ani = animation.FuncAnimation(fig, animate, frames=50, interval=500, repeat=False)
plt.show()
Output:
这个例子创建了一个动态更新的水平条形图。每500毫秒,其中一个类别的值会被随机更新。虽然这个动画在静态环境中无法展示,但它展示了Matplotlib的动态图表功能。
17. 条形图与误差线结合
在某些科学或统计分析中,我们可能需要同时展示数据的中心趋势和离散程度。
import matplotlib.pyplot as plt
import numpy as np

categories = ['Group A', 'Group B', 'Group C', 'Group D']
means = [25, 32, 28, 35]
std_devs = [2, 3, 4, 1]

fig, ax = plt.subplots(figsize=(10, 6))

ax.barh(categories, means, xerr=std_devs, capsize=5, color='lightblue', ecolor='black')
ax.set_title('Data with Error Bars - how2matplotlib.com')
ax.set_xlabel('Values')
ax.set_ylabel('Groups')

for i, v in enumerate(means):
    ax.text(v, i, f' {v}±{std_devs[i]}', va='center')

plt.tight_layout()
plt.show()
Output:
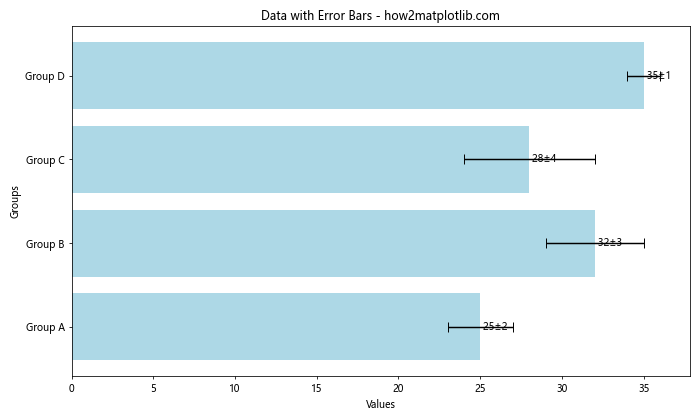
这个例子展示了如何在水平条形图中添加误差线。xerr参数用于指定误差值,capsize参数设置误差线末端横线的长度。我们还在每个条形旁边添加了均值和标准差的文本标签。
18. 多层次分类的条形图
有时,我们可能需要展示具有多层次分类的数据。
import matplotlib.pyplot as plt
import numpy as np

categories = ['Category 1', 'Category 2', 'Category 3']
subcategories = ['A', 'B', 'C']

data = np.array([[10, 20, 15],
                 [25, 22, 18],
                 [15, 18, 20]])

fig, ax = plt.subplots(figsize=(12, 6))

x = np.arange(len(categories))
width = 0.25

for i in range(len(subcategories)):
    ax.barh(x + i*width, data[:, i], width, label=subcategories[i])

ax.set_title('Multi-level Categorized Data - how2matplotlib.com')
ax.set_xlabel('Values')
ax.set_yticks(x + width)
ax.set_yticklabels(categories)
ax.legend()

plt.tight_layout()
plt.show()
Output:
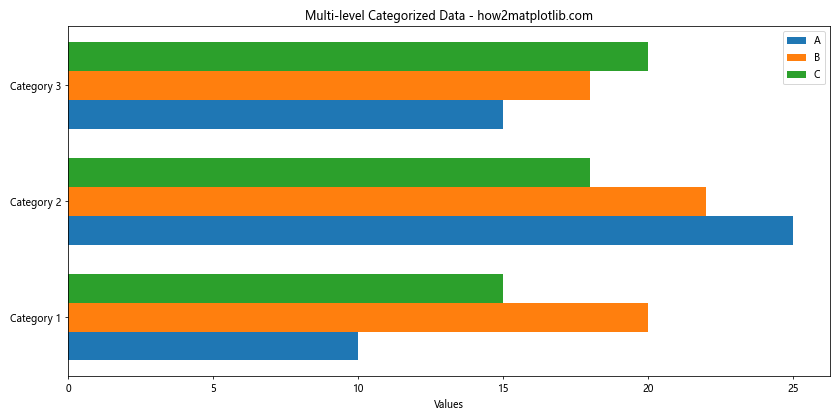
这个例子展示了如何创建一个多层次分类的水平条形图。我们使用嵌套循环来绘制每个子类别的条形,并通过调整条形的位置来实现分组效果。
19. 条形图与散点图结合
在某些情况下,我们可能希望在条形图的基础上添加额外的数据点。
import matplotlib.pyplot as plt
import numpy as np

categories = ['Product A', 'Product B', 'Product C', 'Product D', 'Product E']
sales = [120, 98, 145, 87, 132]
ratings = [4.2, 3.8, 4.5, 3.9, 4.1]

fig, ax1 = plt.subplots(figsize=(10, 6))

# 绘制条形图
bars = ax1.barh(categories, sales, color='lightgreen', alpha=0.7)
ax1.set_xlabel('Sales')
ax1.set_title('Product Sales and Ratings - how2matplotlib.com')

# 创建共享y轴的新x轴
ax2 = ax1.twiny()

# 绘制散点图
ax2.scatter(ratings, categories, color='red', s=50)
ax2.set_xlabel('Ratings')
ax2.set_xlim(3.5, 5)

# 添加销售数据标签
for bar in bars:
    width = bar.get_width()
    ax1.text(width, bar.get_y() + bar.get_height()/2, f'{width}', ha='left', va='center')

plt.tight_layout()
plt.show()
Output:
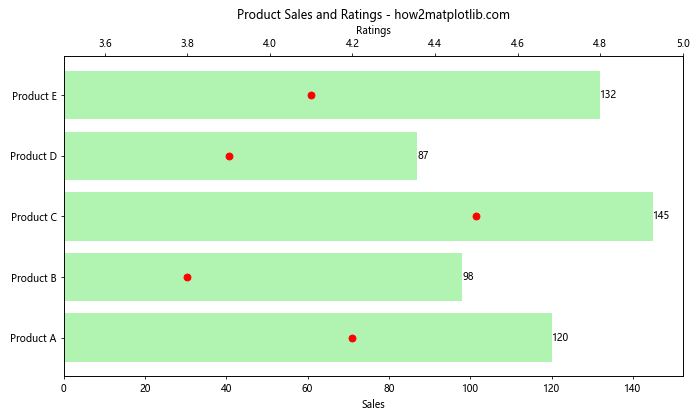
这个例子展示了如何在水平条形图的基础上添加散点图。条形图表示产品销售量,而散点图表示产品评分。通过使用共享y轴的两个x轴,我们可以在同一图表中展示这两种不同类型的数据。
20. 条形图与文本注释
有时,我们可能需要为图表中的某些特定数据点添加详细的文本注释。
import matplotlib.pyplot as plt

categories = ['Project A', 'Project B', 'Project C', 'Project D', 'Project E']
progress = [75, 45, 90, 60, 80]

fig, ax = plt.subplots(figsize=(12, 6))

bars = ax.barh(categories, progress, color='skyblue')
ax.set_title('Project Progress - how2matplotlib.com')
ax.set_xlabel('Progress (%)')
ax.set_xlim(0, 100)

for i, bar in enumerate(bars):
    width = bar.get_width()
    ax.text(width, bar.get_y() + bar.get_height()/2, f'{width}%', ha='left', va='center')

    if categories[i] == 'Project B':
        ax.annotate('Delayed due to resource constraints',
                    xy=(width, bar.get_y() + bar.get_height()),
                    xytext=(width+10, bar.get_y() + bar.get_height() + 0.5),
                    arrowprops=dict(facecolor='black', shrink=0.05))
    elif categories[i] == 'Project C':
        ax.annotate('Ahead of schedule',
                    xy=(width, bar.get_y()),
                    xytext=(width+10, bar.get_y() - 0.5),
                    arrowprops=dict(facecolor='black', shrink=0.05))

plt.tight_layout()
plt.show()
Output:
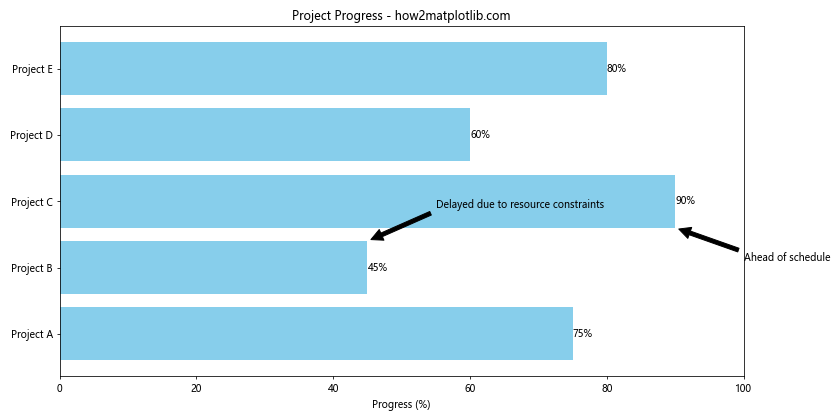
这个例子展示了如何在水平条形图中添加详细的文本注释。我们使用ax.annotate()函数为特定的项目添加了带箭头的文本注释,以提供额外的上下文信息。
总结:
本文全面介绍了使用Matplotlib绘制水平条形图的各种技巧和方法。从基础的绘图开始,我们逐步探讨了自定义样式、添加数据标签、排序、多组数据比较、添加误差条、结合其他图表类型等多个方面。通过这些示例,读者可以掌握如何创建信息丰富、视觉吸引力强的水平条形图,以更好地展示和分析数据。
水平条形图是一种非常实用的数据可视化工具,特别适合展示分类数据的比较和排序。通过合理使用颜色、标签、排序和组合等技巧,我们可以创建出既美观又富有信息量的图表。希望这篇文章能够帮助读者更好地利用Matplotlib创建出符合自己需求的水平条形图。
 极客教程
极客教程