Python中使用Matplotlib绘制甜甜圈图表的全面指南
参考:Donut Chart using Matplotlib in Python
Matplotlib是Python中最流行的数据可视化库之一,它提供了丰富的绘图功能,包括创建甜甜圈图表(Donut Chart)。甜甜圈图是饼图的变体,中心有一个空洞,看起来像一个甜甜圈。这种图表类型特别适合展示部分与整体的关系,同时比传统饼图更具视觉吸引力。本文将详细介绍如何使用Matplotlib在Python中创建各种类型的甜甜圈图表,从基础到高级,包括自定义样式、添加标签、多层甜甜圈图等。
1. 基础甜甜圈图
首先,让我们从最基本的甜甜圈图开始。创建一个简单的甜甜圈图需要使用Matplotlib的pie函数,并设置wedgeprops参数来创建中心的空洞。
import matplotlib.pyplot as plt

# 数据
sizes = [30, 20, 25, 15, 10]
labels = ['A', 'B', 'C', 'D', 'E']

# 创建图表
fig, ax = plt.subplots()

# 绘制甜甜圈图
ax.pie(sizes, labels=labels, autopct='%1.1f%%', startangle=90,
       wedgeprops=dict(width=0.5, edgecolor='white'))

# 设置标题
ax.set_title('How2matplotlib.com Basic Donut Chart')

# 确保图表是圆形的
ax.axis('equal')

plt.show()
Output:
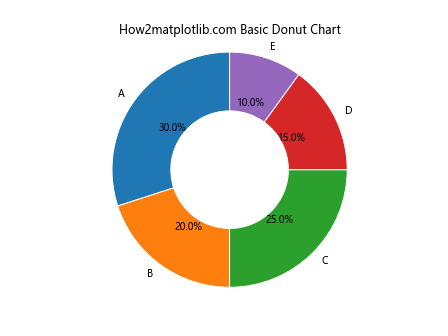
在这个例子中,我们使用pie函数创建了一个基本的甜甜圈图。sizes参数定义了每个扇区的大小,labels参数为每个扇区添加标签。autopct参数用于在每个扇区显示百分比。startangle参数设置起始角度,wedgeprops参数中的width设置甜甜圈的宽度(值越小,中心空洞越大)。
2. 自定义颜色
接下来,我们可以自定义甜甜圈图的颜色,使其更具吸引力。
import matplotlib.pyplot as plt

# 数据
sizes = [30, 20, 25, 15, 10]
labels = ['A', 'B', 'C', 'D', 'E']
colors = ['#ff9999', '#66b3ff', '#99ff99', '#ffcc99', '#ff99cc']

# 创建图表
fig, ax = plt.subplots()

# 绘制甜甜圈图
ax.pie(sizes, labels=labels, colors=colors, autopct='%1.1f%%', startangle=90,
       wedgeprops=dict(width=0.5, edgecolor='white'))

# 设置标题
ax.set_title('How2matplotlib.com Donut Chart with Custom Colors')

# 确保图表是圆形的
ax.axis('equal')

plt.show()
Output:
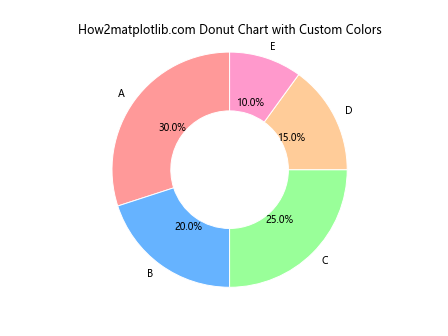
在这个例子中,我们添加了一个colors列表来自定义每个扇区的颜色。这使得甜甜圈图更加丰富多彩,更容易区分不同的部分。
3. 添加图例
有时,我们可能希望将标签移到图表外部,并添加一个图例。这可以通过以下方式实现:
import matplotlib.pyplot as plt

# 数据
sizes = [30, 20, 25, 15, 10]
labels = ['A', 'B', 'C', 'D', 'E']
colors = ['#ff9999', '#66b3ff', '#99ff99', '#ffcc99', '#ff99cc']

# 创建图表
fig, ax = plt.subplots()

# 绘制甜甜圈图
wedges, texts, autotexts = ax.pie(sizes, colors=colors, autopct='%1.1f%%', startangle=90,
                                  wedgeprops=dict(width=0.5, edgecolor='white'))

# 添加图例
ax.legend(wedges, labels, title="Categories", loc="center left", bbox_to_anchor=(1, 0, 0.5, 1))

# 设置标题
ax.set_title('How2matplotlib.com Donut Chart with Legend')

# 确保图表是圆形的
ax.axis('equal')

plt.show()
Output:
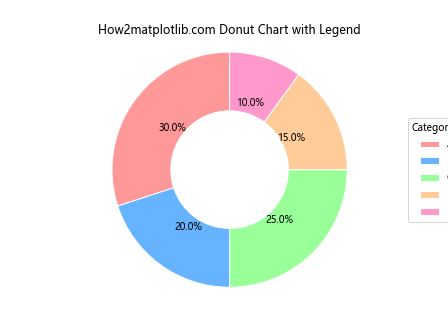
在这个例子中,我们使用legend函数添加了一个图例。loc参数设置图例的位置,bbox_to_anchor参数用于微调图例的位置。
4. 突出显示特定扇区
有时我们可能想要突出显示某个特定的扇区。这可以通过设置该扇区的explode参数来实现:
import matplotlib.pyplot as plt

# 数据
sizes = [30, 20, 25, 15, 10]
labels = ['A', 'B', 'C', 'D', 'E']
colors = ['#ff9999', '#66b3ff', '#99ff99', '#ffcc99', '#ff99cc']
explode = (0, 0.1, 0, 0, 0)  # 突出显示第二个扇区

# 创建图表
fig, ax = plt.subplots()

# 绘制甜甜圈图
ax.pie(sizes, explode=explode, labels=labels, colors=colors, autopct='%1.1f%%', startangle=90,
       wedgeprops=dict(width=0.5, edgecolor='white'))

# 设置标题
ax.set_title('How2matplotlib.com Donut Chart with Exploded Sector')

# 确保图表是圆形的
ax.axis('equal')

plt.show()
Output:
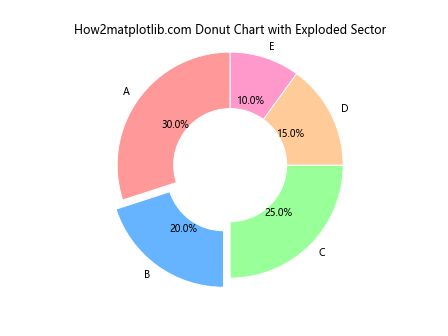
在这个例子中,我们使用explode参数来突出显示第二个扇区。explode是一个元组,其长度应该与sizes相同,对应要突出显示的扇区设置一个非零值。
5. 添加中心文本
甜甜圈图的一个优势是可以在中心添加文本或图像。让我们看看如何在甜甜圈图的中心添加文本:
import matplotlib.pyplot as plt

# 数据
sizes = [30, 20, 25, 15, 10]
labels = ['A', 'B', 'C', 'D', 'E']
colors = ['#ff9999', '#66b3ff', '#99ff99', '#ffcc99', '#ff99cc']

# 创建图表
fig, ax = plt.subplots()

# 绘制甜甜圈图
wedges, texts, autotexts = ax.pie(sizes, labels=labels, colors=colors, autopct='%1.1f%%', startangle=90,
                                  wedgeprops=dict(width=0.5, edgecolor='white'))

# 添加中心文本
ax.text(0, 0, 'How2matplotlib.com', ha='center', va='center', fontsize=12)

# 设置标题
ax.set_title('Donut Chart with Center Text')

# 确保图表是圆形的
ax.axis('equal')

plt.show()
Output:
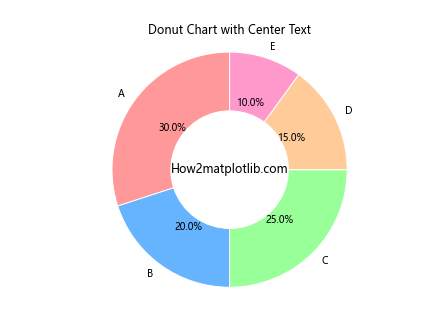
在这个例子中,我们使用ax.text函数在甜甜圈图的中心添加了文本。ha和va参数用于设置文本的水平和垂直对齐方式。
6. 多层甜甜圈图
多层甜甜圈图可以用来展示更复杂的数据关系。让我们创建一个两层的甜甜圈图:
import matplotlib.pyplot as plt
import numpy as np

# 数据
sizes_outer = [30, 20, 25, 15, 10]
sizes_inner = [20, 15, 10, 5]
labels_outer = ['A', 'B', 'C', 'D', 'E']
labels_inner = ['W', 'X', 'Y', 'Z']
colors_outer = ['#ff9999', '#66b3ff', '#99ff99', '#ffcc99', '#ff99cc']
colors_inner = ['#ff6666', '#3399ff', '#66ff66', '#ff9966']

# 创建图表
fig, ax = plt.subplots()

# 绘制外层甜甜圈
ax.pie(sizes_outer, labels=labels_outer, colors=colors_outer, autopct='%1.1f%%', startangle=90,
       wedgeprops=dict(width=0.3, edgecolor='white'))

# 绘制内层甜甜圈
ax.pie(sizes_inner, labels=labels_inner, colors=colors_inner, autopct='%1.1f%%', startangle=90,
       wedgeprops=dict(width=0.3, edgecolor='white'), radius=0.7)

# 设置标题
ax.set_title('How2matplotlib.com Multi-layer Donut Chart')

# 确保图表是圆形的
ax.axis('equal')

plt.show()
Output:
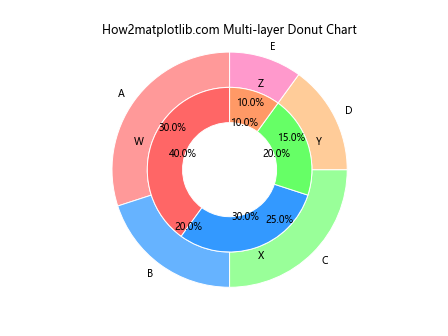
在这个例子中,我们绘制了两个甜甜圈图。外层甜甜圈使用默认的半径,内层甜甜圈的半径设置为0.7,使其位于外层甜甜圈的内部。
7. 动态甜甜圈图
有时我们可能需要根据数据动态生成甜甜圈图。以下是一个根据用户输入生成甜甜圈图的例子:
import matplotlib.pyplot as plt

def create_donut_chart(data):
    sizes = list(data.values())
    labels = list(data.keys())
    colors = plt.cm.Pastel1(np.linspace(0, 1, len(sizes)))

    fig, ax = plt.subplots()

    ax.pie(sizes, labels=labels, colors=colors, autopct='%1.1f%%', startangle=90,
           wedgeprops=dict(width=0.5, edgecolor='white'))

    ax.set_title('How2matplotlib.com Dynamic Donut Chart')
    ax.axis('equal')

    plt.show()

# 用户输入数据
data = {}
while True:
    label = input("Enter a label (or press Enter to finish): ")
    if label == "":
        break
    size = float(input("Enter the size for {}: ".format(label)))
    data[label] = size

create_donut_chart(data)
这个脚本允许用户输入标签和对应的大小,然后生成一个甜甜圈图。它使用plt.cm.Pastel1颜色映射来自动生成颜色。
8. 带有子图的甜甜圈图
如果我们想要在一个图表中展示多个甜甜圈图,可以使用子图:
import matplotlib.pyplot as plt

# 数据
data1 = [30, 20, 25, 15, 10]
data2 = [35, 25, 20, 20]
labels1 = ['A', 'B', 'C', 'D', 'E']
labels2 = ['W', 'X', 'Y', 'Z']

# 创建图表和子图
fig, (ax1, ax2) = plt.subplots(1, 2, figsize=(12, 6))

# 绘制第一个甜甜圈图
ax1.pie(data1, labels=labels1, autopct='%1.1f%%', startangle=90,
        wedgeprops=dict(width=0.5, edgecolor='white'))
ax1.set_title('How2matplotlib.com Donut Chart 1')

# 绘制第二个甜甜圈图
ax2.pie(data2, labels=labels2, autopct='%1.1f%%', startangle=90,
        wedgeprops=dict(width=0.5, edgecolor='white'))
ax2.set_title('How2matplotlib.com Donut Chart 2')

# 确保图表是圆形的
ax1.axis('equal')
ax2.axis('equal')

plt.tight_layout()
plt.show()
Output:
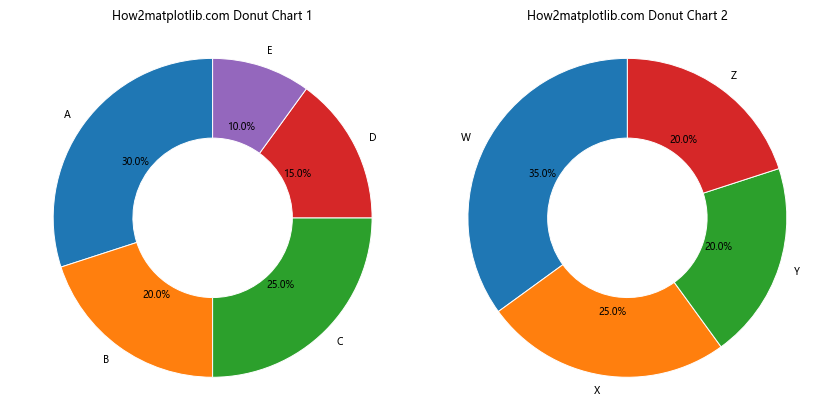
这个例子创建了两个并排的甜甜圈图。plt.subplots(1, 2)创建了一行两列的子图布局。
9. 带有阴影的甜甜圈图
为了增加视觉效果,我们可以给甜甜圈图添加阴影:
import matplotlib.pyplot as plt

# 数据
sizes = [30, 20, 25, 15, 10]
labels = ['A', 'B', 'C', 'D', 'E']
colors = ['#ff9999', '#66b3ff', '#99ff99', '#ffcc99', '#ff99cc']

# 创建图表
fig, ax = plt.subplots()

# 绘制甜甜圈图
wedges, texts, autotexts = ax.pie(sizes, labels=labels, colors=colors, autopct='%1.1f%%', startangle=90,
                                  wedgeprops=dict(width=0.5, edgecolor='white'),
                                  shadow=True, radius=1.2)

# 设置标题
ax.set_title('How2matplotlib.com Donut Chart with Shadow')

# 确保图表是圆形的
ax.axis('equal')

plt.show()
Output:
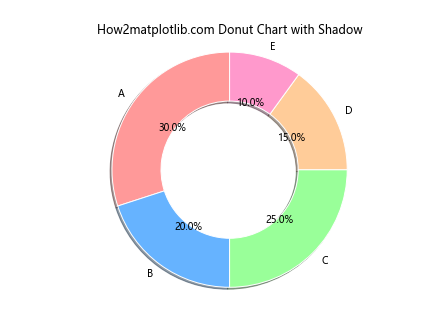
在这个例子中,我们添加了shadow=True参数来给甜甜圈图添加阴影效果。radius=1.2参数稍微增大了甜甜圈的半径,以便更好地显示阴影。
10. 带有渐变色的甜甜圈图
我们可以使用Matplotlib的颜色映射功能来创建带有渐变色的甜甜圈图:
import matplotlib.pyplot as plt
import numpy as np

# 数据
sizes = [30, 20, 25, 15, 10]
labels = ['A', 'B', 'C', 'D', 'E']

# 创建渐变色
cmap = plt.get_cmap("coolwarm")
colors = cmap(np.linspace(0.1, 0.9, len(sizes)))

# 创建图表
fig, ax =plt.subplots()

# 绘制甜甜圈图
wedges, texts, autotexts = ax.pie(sizes, labels=labels, colors=colors, autopct='%1.1f%%', startangle=90,
                                  wedgeprops=dict(width=0.5, edgecolor='white'))

# 设置标题
ax.set_title('How2matplotlib.com Donut Chart with Gradient Colors')

# 确保图表是圆形的
ax.axis('equal')

plt.show()
Output:
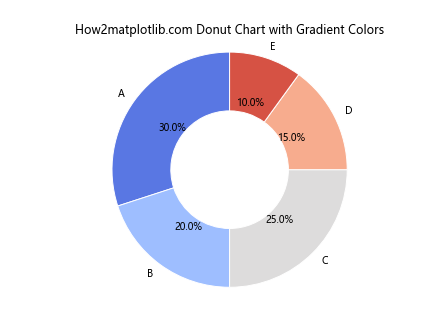
在这个例子中,我们使用plt.get_cmap("coolwarm")获取了一个颜色映射,然后使用np.linspace创建了一个均匀分布的颜色序列。这样可以创建一个渐变色的效果,使甜甜圈图更加美观。
11. 带有标注的甜甜圈图
有时我们可能需要为甜甜圈图的某些部分添加额外的标注。以下是一个示例:
import matplotlib.pyplot as plt

# 数据
sizes = [30, 20, 25, 15, 10]
labels = ['A', 'B', 'C', 'D', 'E']
colors = ['#ff9999', '#66b3ff', '#99ff99', '#ffcc99', '#ff99cc']

# 创建图表
fig, ax = plt.subplots()

# 绘制甜甜圈图
wedges, texts, autotexts = ax.pie(sizes, labels=labels, colors=colors, autopct='%1.1f%%', startangle=90,
                                  wedgeprops=dict(width=0.5, edgecolor='white'))

# 添加标注
ax.annotate('Important!', xy=(0.3, 0.5), xytext=(0.7, 0.7),
            arrowprops=dict(facecolor='black', shrink=0.05))

# 设置标题
ax.set_title('How2matplotlib.com Donut Chart with Annotation')

# 确保图表是圆形的
ax.axis('equal')

plt.show()
Output:
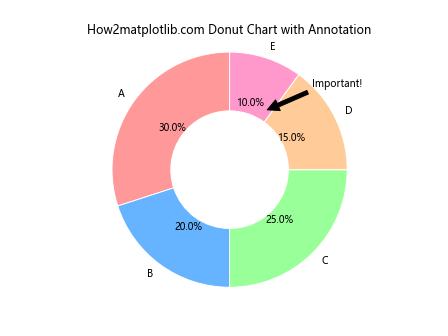
在这个例子中,我们使用ax.annotate函数添加了一个指向特定扇区的标注。xy参数指定了箭头的终点,xytext参数指定了文本的位置,arrowprops参数定义了箭头的属性。
12. 带有子扇区的甜甜圈图
我们可以创建一个更复杂的甜甜圈图,其中某些主要扇区包含子扇区:
import matplotlib.pyplot as plt

# 数据
sizes_outer = [30, 20, 25, 15, 10]
sizes_inner = [10, 15, 5, 10, 5, 7, 8, 5, 5]
labels_outer = ['A', 'B', 'C', 'D', 'E']
labels_inner = ['A1', 'A2', 'B1', 'B2', 'C1', 'C2', 'D1', 'D2', 'E1']
colors_outer = ['#ff9999', '#66b3ff', '#99ff99', '#ffcc99', '#ff99cc']
colors_inner = plt.cm.Pastel1(np.linspace(0, 1, len(sizes_inner)))

# 创建图表
fig, ax = plt.subplots()

# 绘制外层甜甜圈
wedges_outer, texts_outer, autotexts_outer = ax.pie(sizes_outer, labels=labels_outer, colors=colors_outer,
                                                    autopct='%1.1f%%', startangle=90,
                                                    wedgeprops=dict(width=0.3, edgecolor='white'))

# 绘制内层甜甜圈
wedges_inner, texts_inner, autotexts_inner = ax.pie(sizes_inner, labels=labels_inner, colors=colors_inner,
                                                    autopct='%1.1f%%', startangle=90,
                                                    wedgeprops=dict(width=0.3, edgecolor='white'), radius=0.7)

# 设置标题
ax.set_title('How2matplotlib.com Donut Chart with Subgroups')

# 确保图表是圆形的
ax.axis('equal')

plt.show()
这个例子创建了一个双层甜甜圈图,内层代表外层各扇区的子类别。
13. 带有数据标签的甜甜圈图
有时我们可能想要在甜甜圈图上显示实际的数值,而不仅仅是百分比。以下是一个示例:
import matplotlib.pyplot as plt

# 数据
sizes = [30, 20, 25, 15, 10]
labels = ['A', 'B', 'C', 'D', 'E']
colors = ['#ff9999', '#66b3ff', '#99ff99', '#ffcc99', '#ff99cc']

# 创建图表
fig, ax = plt.subplots()

# 绘制甜甜圈图
wedges, texts, autotexts = ax.pie(sizes, labels=labels, colors=colors,
                                  autopct=lambda pct: f'{pct:.1f}%\n({pct*sum(sizes)/100:.0f})',
                                  startangle=90, wedgeprops=dict(width=0.5, edgecolor='white'))

# 设置标题
ax.set_title('How2matplotlib.com Donut Chart with Data Labels')

# 确保图表是圆形的
ax.axis('equal')

plt.show()
Output:
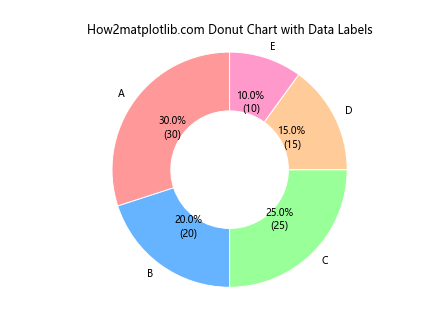
在这个例子中,我们使用了一个lambda函数作为autopct参数的值。这个函数不仅显示百分比,还计算并显示实际的数值。
14. 带有图例和数据表的甜甜圈图
为了提供更多信息,我们可以在甜甜圈图旁边添加一个数据表:
import matplotlib.pyplot as plt

# 数据
sizes = [30, 20, 25, 15, 10]
labels = ['A', 'B', 'C', 'D', 'E']
colors = ['#ff9999', '#66b3ff', '#99ff99', '#ffcc99', '#ff99cc']

# 创建图表
fig, (ax1, ax2) = plt.subplots(1, 2, figsize=(12, 6))

# 绘制甜甜圈图
wedges, texts, autotexts = ax1.pie(sizes, labels=labels, colors=colors, autopct='%1.1f%%', startangle=90,
                                   wedgeprops=dict(width=0.5, edgecolor='white'))

# 添加图例
ax1.legend(wedges, labels, title="Categories", loc="center left", bbox_to_anchor=(1, 0, 0.5, 1))

# 创建数据表
cell_text = [[label, str(size)] for label, size in zip(labels, sizes)]
ax2.axis('tight')
ax2.axis('off')
table = ax2.table(cellText=cell_text, colLabels=['Category', 'Value'], loc='center')

# 设置标题
fig.suptitle('How2matplotlib.com Donut Chart with Legend and Data Table')

# 确保图表是圆形的
ax1.axis('equal')

plt.tight_layout()
plt.show()
Output:
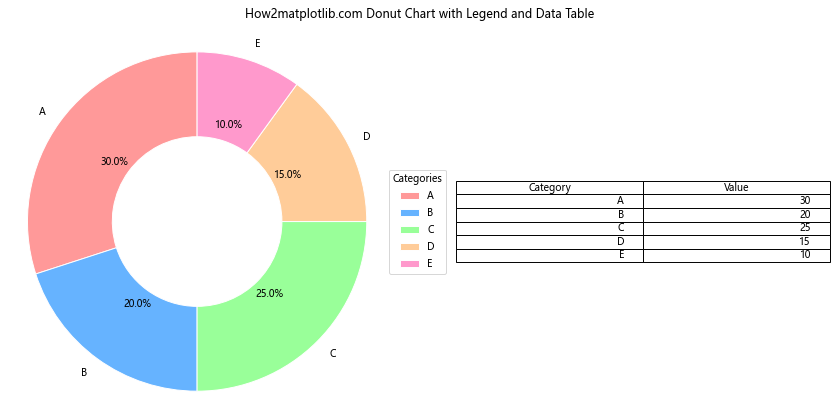
这个例子创建了一个包含甜甜圈图和数据表的复合图表。左侧是带有图例的甜甜圈图,右侧是一个显示原始数据的表格。
15. 动画甜甜圈图
最后,让我们创建一个动画甜甜圈图,展示数据随时间的变化:
import matplotlib.pyplot as plt
import matplotlib.animation as animation
import numpy as np

# 初始数据
sizes = [30, 20, 25, 15, 10]
labels = ['A', 'B', 'C', 'D', 'E']
colors = ['#ff9999', '#66b3ff', '#99ff99', '#ffcc99', '#ff99cc']

# 创建图表
fig, ax = plt.subplots()

def update(frame):
    # 更新数据
    new_sizes = [size + np.random.randint(-5, 6) for size in sizes]
    new_sizes = [max(0, size) for size in new_sizes]  # 确保所有值非负

    # 清除当前图表
    ax.clear()

    # 重新绘制甜甜圈图
    wedges, texts, autotexts = ax.pie(new_sizes, labels=labels, colors=colors, autopct='%1.1f%%', startangle=90,
                                      wedgeprops=dict(width=0.5, edgecolor='white'))

    ax.set_title(f'How2matplotlib.com Animated Donut Chart (Frame {frame})')
    ax.axis('equal')

# 创建动画
ani = animation.FuncAnimation(fig, update, frames=100, repeat=True, interval=200)

plt.show()
Output:
这个例子创建了一个动画甜甜圈图,每200毫秒更新一次数据。每次更新时,各扇区的大小都会随机增加或减少一些,创造出数据变化的效果。
总结
通过以上15个示例,我们详细探讨了如何使用Matplotlib在Python中创建各种类型的甜甜圈图表。从基础的静态甜甜圈图到复杂的多层甜甜圈图,再到动画甜甜圈图,我们涵盖了广泛的应用场景。这些技术可以帮助你更有效地可视化和展示数据,使你的数据分析结果更加直观和吸引人。
记住,甜甜圈图虽然视觉效果很好,但并不适合所有类型的数据。在选择使用甜甜圈图时,要考虑你的数据类型和你想要传达的信息。对于展示部分与整体的关系,甜甜圈图是一个很好的选择。但如果你的数据包含太多类别,或者类别之间的差异很小,可能需要考虑使用其他类型的图表。
最后,Matplotlib提供了丰富的自定义选项,你可以根据需要调整颜色、标签、字体等各种元素,以创建最适合你的数据和受众的甜甜圈图。希望这篇文章能够帮助你掌握使用Matplotlib创建甜甜圈图的技巧,并在你的数据可视化工作中充分发挥这一强大工具的潜力。
 极客教程
极客教程