Matplotlib中创建堆叠条形图的全面指南
参考:Create a stacked bar plot in Matplotlib
堆叠条形图是数据可视化中一种强大而versatile的图表类型,它能够同时展示多个类别的数据及其组成部分。在Python的Matplotlib库中,创建堆叠条形图是一项常见且有用的技能。本文将全面介绍如何使用Matplotlib创建堆叠条形图,从基础概念到高级技巧,帮助你掌握这一数据可视化利器。
1. 堆叠条形图的基本概念
堆叠条形图是条形图的一种变体,它将多个数据系列垂直堆叠在一起,每个条形代表一个类别,而条形的不同部分则代表该类别的不同组成部分。这种图表类型特别适合展示部分与整体的关系,以及随时间或类别变化的数据组成。
在Matplotlib中,我们主要使用bar()函数来创建堆叠条形图。通过巧妙地设置每个数据系列的底部位置,我们可以实现堆叠效果。
让我们从一个简单的例子开始:
import matplotlib.pyplot as plt
import numpy as np

categories = ['A', 'B', 'C', 'D']
values1 = [10, 20, 15, 25]
values2 = [5, 10, 12, 8]

plt.figure(figsize=(10, 6))
plt.bar(categories, values1, label='Series 1')
plt.bar(categories, values2, bottom=values1, label='Series 2')

plt.xlabel('Categories')
plt.ylabel('Values')
plt.title('Simple Stacked Bar Plot - how2matplotlib.com')
plt.legend()
plt.show()
Output:
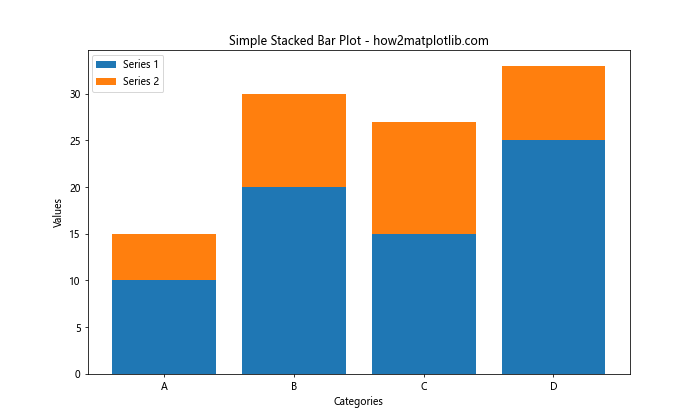
在这个例子中,我们创建了两个数据系列,values1和values2。第一个bar()函数绘制了底部的条形,而第二个bar()函数则通过设置bottom参数为values1,将第二个系列堆叠在第一个系列之上。
2. 数据准备和组织
创建有效的堆叠条形图的关键在于正确组织你的数据。通常,你需要将数据组织成一个二维数组或者字典,其中行表示不同的类别,列表示每个堆叠的组成部分。
以下是一个更复杂的数据组织示例:
import matplotlib.pyplot as plt
import numpy as np

data = {
    'Category A': [10, 20, 30],
    'Category B': [15, 25, 35],
    'Category C': [5, 15, 25],
    'Category D': [12, 22, 32]
}

categories = list(data.keys())
values = np.array(list(data.values()))

plt.figure(figsize=(12, 6))
bottom = np.zeros(4)

for i in range(3):
    plt.bar(categories, values[:, i], bottom=bottom, label=f'Series {i+1}')
    bottom += values[:, i]

plt.xlabel('Categories')
plt.ylabel('Values')
plt.title('Stacked Bar Plot with Multiple Series - how2matplotlib.com')
plt.legend()
plt.show()
Output:
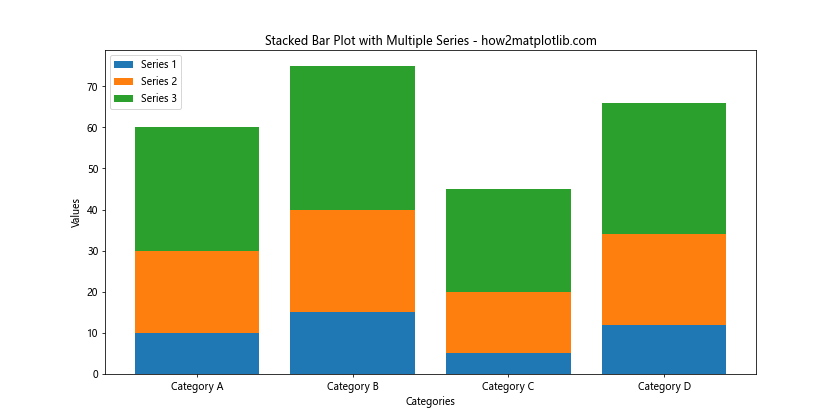
在这个例子中,我们使用字典来组织数据,每个键代表一个类别,对应的值是一个列表,表示该类别的不同组成部分。我们使用NumPy将数据转换为二维数组,然后通过循环来创建堆叠效果。
3. 自定义颜色和样式
Matplotlib提供了丰富的选项来自定义堆叠条形图的外观。你可以为每个系列指定不同的颜色,调整条形的宽度,添加边框等。
下面是一个展示如何自定义堆叠条形图样式的例子:
import matplotlib.pyplot as plt
import numpy as np

categories = ['A', 'B', 'C', 'D']
series1 = [10, 20, 15, 25]
series2 = [5, 10, 12, 8]
series3 = [8, 7, 10, 12]

plt.figure(figsize=(12, 7))

plt.bar(categories, series1, color='#ff9999', edgecolor='white', width=0.5, label='Series 1')
plt.bar(categories, series2, bottom=series1, color='#66b3ff', edgecolor='white', width=0.5, label='Series 2')
plt.bar(categories, series3, bottom=np.array(series1)+np.array(series2), color='#99ff99', edgecolor='white', width=0.5, label='Series 3')

plt.xlabel('Categories', fontsize=12)
plt.ylabel('Values', fontsize=12)
plt.title('Customized Stacked Bar Plot - how2matplotlib.com', fontsize=16)
plt.legend(loc='upper left', bbox_to_anchor=(1, 1))
plt.tight_layout()
plt.show()
Output:
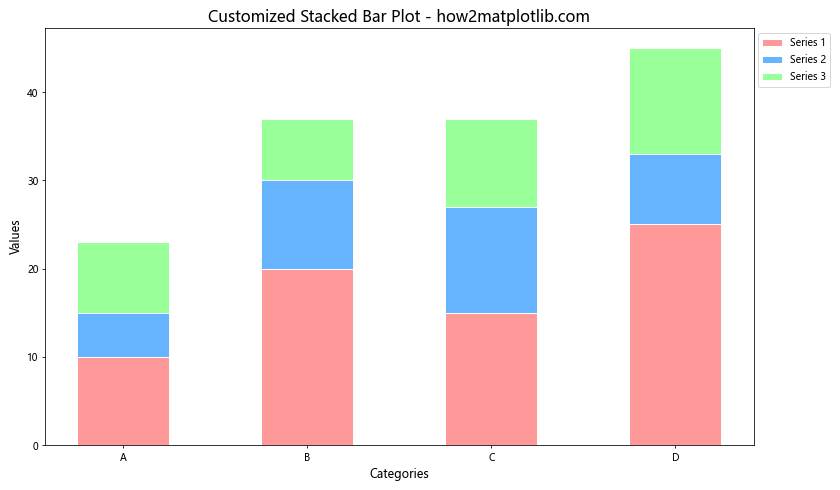
在这个例子中,我们为每个系列指定了不同的颜色,设置了白色的边框,调整了条形的宽度,并将图例放置在图表的右侧。
4. 添加数据标签
为堆叠条形图添加数据标签可以提高图表的可读性。你可以选择在每个条形的顶部或中间添加标签,显示具体的数值或百分比。
以下是一个添加数据标签的示例:
import matplotlib.pyplot as plt
import numpy as np

categories = ['A', 'B', 'C', 'D']
series1 = [10, 20, 15, 25]
series2 = [5, 10, 12, 8]

fig, ax = plt.subplots(figsize=(10, 6))

ax.bar(categories, series1, label='Series 1')
ax.bar(categories, series2, bottom=series1, label='Series 2')

ax.set_xlabel('Categories')
ax.set_ylabel('Values')
ax.set_title('Stacked Bar Plot with Data Labels - how2matplotlib.com')
ax.legend()

for i, (s1, s2) in enumerate(zip(series1, series2)):
    ax.text(i, s1/2, str(s1), ha='center', va='center')
    ax.text(i, s1+s2/2, str(s2), ha='center', va='center')

plt.tight_layout()
plt.show()
Output:
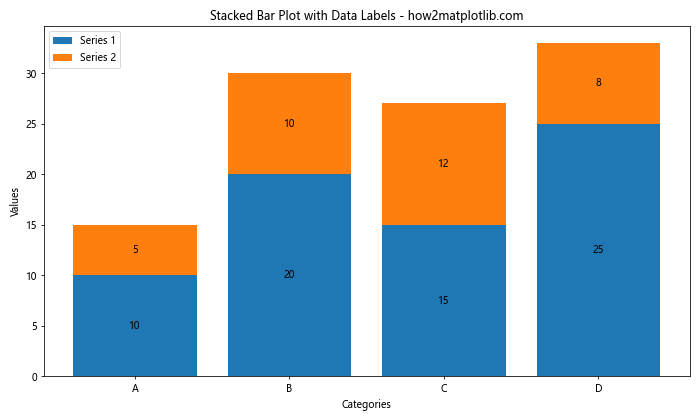
在这个例子中,我们使用ax.text()函数为每个条形的中间添加了数值标签。通过调整文本的位置,我们可以确保标签显示在每个条形的中心。
5. 水平堆叠条形图
除了垂直的堆叠条形图,Matplotlib还支持创建水平的堆叠条形图。这种类型的图表在某些情况下可能更适合,特别是当你有很长的类别名称时。
下面是一个创建水平堆叠条形图的例子:
import matplotlib.pyplot as plt
import numpy as np

categories = ['Category A', 'Category B', 'Category C', 'Category D', 'Category E']
series1 = [10, 20, 15, 25, 18]
series2 = [5, 10, 12, 8, 15]

fig, ax = plt.subplots(figsize=(10, 8))

ax.barh(categories, series1, label='Series 1')
ax.barh(categories, series2, left=series1, label='Series 2')

ax.set_xlabel('Values')
ax.set_ylabel('Categories')
ax.set_title('Horizontal Stacked Bar Plot - how2matplotlib.com')
ax.legend()

plt.tight_layout()
plt.show()
Output:
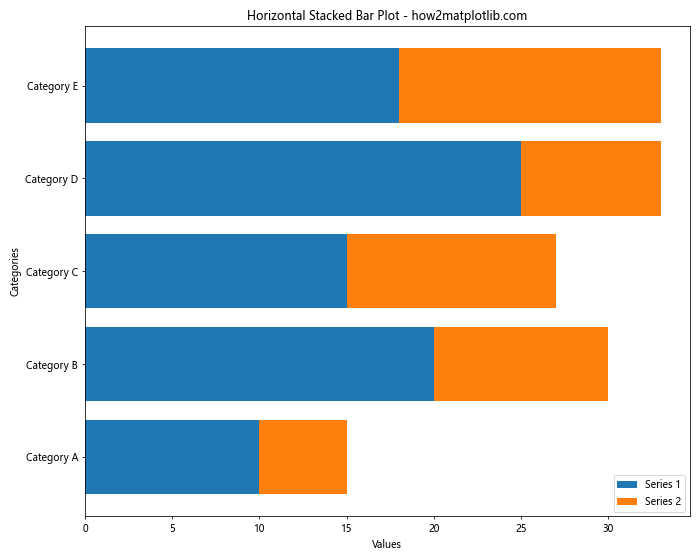
在这个例子中,我们使用barh()函数来创建水平条形,并使用left参数来实现堆叠效果。
6. 百分比堆叠条形图
有时,你可能想要展示每个类别中不同组成部分的相对比例,而不是绝对值。在这种情况下,百分比堆叠条形图就非常有用。
以下是一个创建百分比堆叠条形图的示例:
import matplotlib.pyplot as plt
import numpy as np

categories = ['A', 'B', 'C', 'D']
series1 = [10, 20, 15, 25]
series2 = [5, 10, 12, 8]
series3 = [8, 7, 10, 12]

total = np.array(series1) + np.array(series2) + np.array(series3)
series1_percent = np.array(series1) / total * 100
series2_percent = np.array(series2) / total * 100
series3_percent = np.array(series3) / total * 100

fig, ax = plt.subplots(figsize=(10, 6))

ax.bar(categories, series1_percent, label='Series 1')
ax.bar(categories, series2_percent, bottom=series1_percent, label='Series 2')
ax.bar(categories, series3_percent, bottom=series1_percent+series2_percent, label='Series 3')

ax.set_xlabel('Categories')
ax.set_ylabel('Percentage')
ax.set_title('Percentage Stacked Bar Plot - how2matplotlib.com')
ax.legend()

for i in range(len(categories)):
    ax.text(i, 50, f'{total[i]}', ha='center', va='center')

plt.tight_layout()
plt.show()
Output:
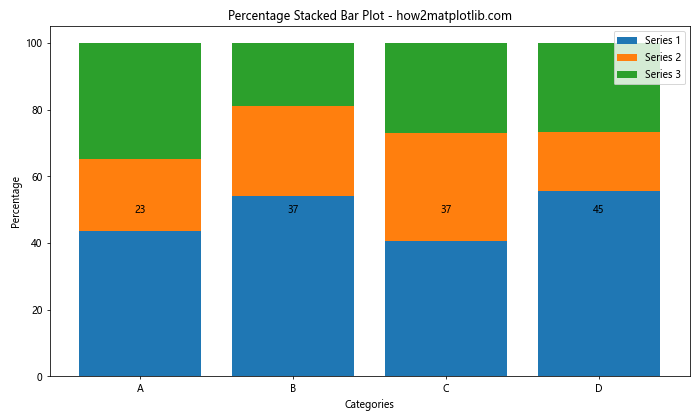
在这个例子中,我们首先计算每个系列的百分比,然后使用这些百分比值来创建堆叠条形图。我们还在每个条形的中间添加了总数标签。
7. 分组堆叠条形图
当你需要比较多个组之间的堆叠数据时,分组堆叠条形图是一个很好的选择。这种图表类型结合了分组条形图和堆叠条形图的特点。
以下是一个创建分组堆叠条形图的示例:
import matplotlib.pyplot as plt
import numpy as np

categories = ['Group 1', 'Group 2', 'Group 3']
series1 = [[10, 20, 30], [15, 25, 35], [5, 15, 25]]
series2 = [[5, 10, 15], [8, 18, 28], [12, 22, 32]]

x = np.arange(len(categories))
width = 0.35

fig, ax = plt.subplots(figsize=(12, 7))

ax.bar(x - width/2, [s[0] for s in series1], width, label='Series 1A')
ax.bar(x - width/2, [s[1] for s in series1], width, bottom=[s[0] for s in series1], label='Series 1B')
ax.bar(x - width/2, [s[2] for s in series1], width, bottom=[s[0]+s[1] for s in series1], label='Series 1C')

ax.bar(x + width/2, [s[0] for s in series2], width, label='Series 2A')
ax.bar(x + width/2, [s[1] for s in series2], width, bottom=[s[0] for s in series2], label='Series 2B')
ax.bar(x + width/2, [s[2] for s in series2], width, bottom=[s[0]+s[1] for s in series2], label='Series 2C')

ax.set_xlabel('Categories')
ax.set_ylabel('Values')
ax.set_title('Grouped Stacked Bar Plot - how2matplotlib.com')
ax.set_xticks(x)
ax.set_xticklabels(categories)
ax.legend()

plt.tight_layout()
plt.show()
Output:
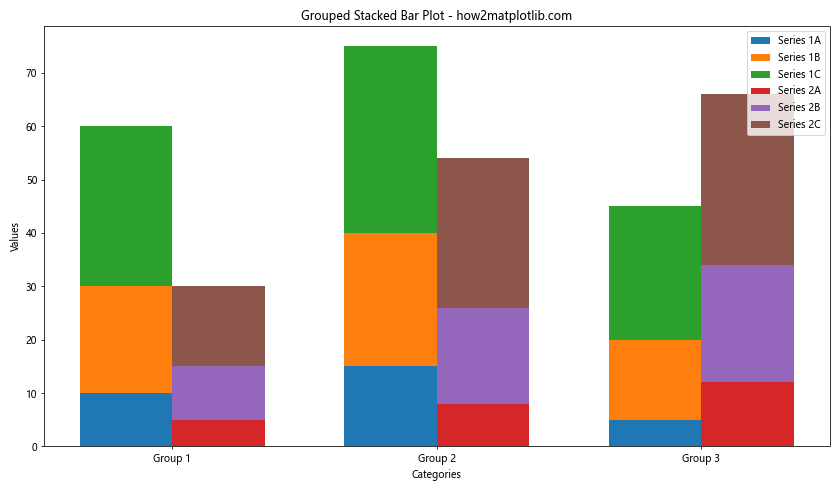
在这个例子中,我们创建了两组堆叠条形图,并将它们并排放置。通过调整条形的位置和宽度,我们实现了分组效果。
8. 添加误差条
在某些情况下,你可能需要在堆叠条形图中显示误差范围。Matplotlib允许你为每个条形添加误差条来表示数据的不确定性。
以下是一个在堆叠条形图中添加误差条的示例:
import matplotlib.pyplot as plt
import numpy as np

categories = ['A', 'B', 'C', 'D']
series1 = [10, 20, 15, 25]
series2 = [5, 10, 12, 8]
error1 = [1, 2, 1.5, 2.5]
error2 = [0.5, 1, 1.2, 0.8]

fig, ax = plt.subplots(figsize=(10, 6))

ax.bar(categories, series1, yerr=error1, capsize=5, label='Series 1')
ax.bar(categories, series2, bottom=series1, yerr=error2, capsize=5, label='Series 2')

ax.set_xlabel('Categories')
ax.set_ylabel('Values')
ax.set_title('Stacked Bar Plot with Error Bars - how2matplotlib.com')
ax.legend()

plt.tight_layout()
plt.show()
Output:
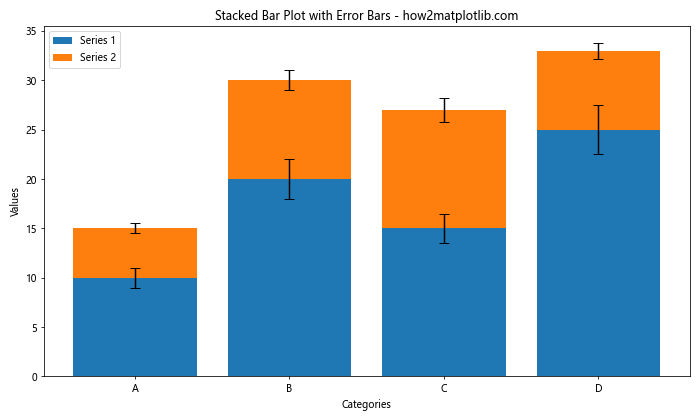
在这个例子中,我们使用yerr参数为每个系列添加了误差条。capsize参数控制误差条末端横线的长度。
9. 自定义图例
图例是帮助读者理解图表的重要元素。Matplotlib提供了多种方式来自定义图例的外观和位置。
以下是一个展示如何自定义图例的示例:
import matplotlib.pyplot as plt
import numpy as np

categories = ['A', 'B', 'C', 'D']
series1 = [10, 20, 15, 25]
series2 = [5, 10, 12, 8]
series3 = [8, 7, 10, 12]

fig, ax = plt.subplots(figsize=(12, 7))

ax.bar(categories, series1, label='Series 1')
ax.bar(categories, series2, bottom=series1, label='Series 2')
ax.bar(categories, series3, bottom=np.array(series1)+np.array(series2), label='Series 3')

ax.set_xlabel('Categories')
ax.set_ylabel('Values')
ax.set_title('Stacked Bar Plot with Custom Legend - how2matplotlib.com')

# 自定义图例
legend = ax.legend(loc='upper left', bbox_to_anchor=(1, 1),
                   ncol=1, fancybox=True, shadow=True)

# 设置图例标题
legend.set_title("Data Series", prop={'weight':'bold'})

# 调整图例中的字体大小
for text in legend.get_texts():
    text.set_fontsize('small')

plt.tight_layout()
plt.show()
Output:
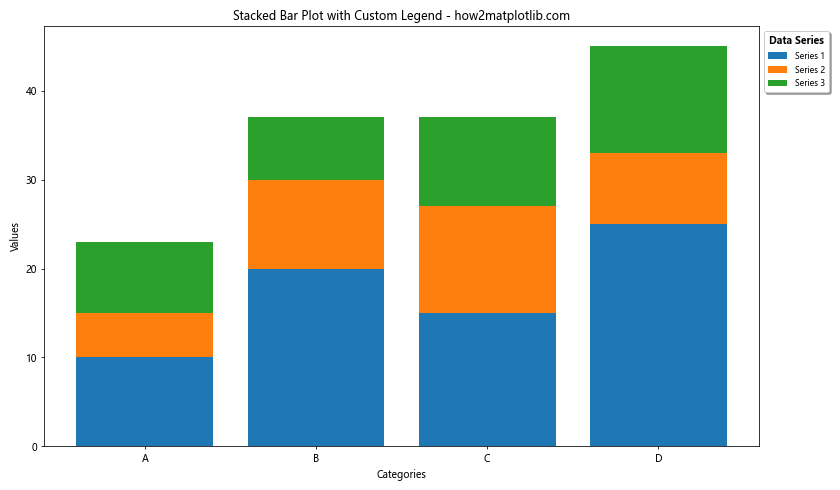
在这个例子中,我们将图例放置在图表的右侧,添加了阴影效果,设置了图例标题,并调整了图例中的字体大小。
10. 添加网格线
网格线可以帮助读者更准确地读取数值。Matplotlib允许你轻松地为堆叠条形图添加网格线。
以下是一个添加网格线的示例:
import matplotlib.pyplot as plt
import numpy as np

categories = ['A', 'B', 'C', 'D']
series1 = [10, 20, 15, 25]
series2 = [5, 10, 12, 8]

fig, ax = plt.subplots(figsize=(10, 6))

ax.bar(categories, series1, label='Series 1')
ax.bar(categories, series2, bottom=series1, label='Series 2')

ax.set_xlabel('Categories')
ax.set_ylabel('Values')
ax.set_title('Stacked Bar Plot with Grid - how2matplotlib.com')
ax.legend()

# 添加网格线
ax.grid(True, axis='y', linestyle='--', alpha=0.7)

plt.tight_layout()
plt.show()
Output:
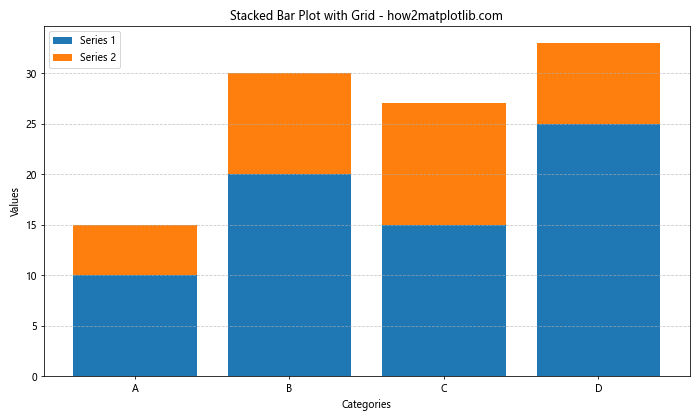
在这个例子中,我们使用ax.grid()函数添加了水平网格线。linestyle参数设置网格线的样式,alpha参数控制网格线的透明度。
11. 调整坐标轴
有时,你可能需要调整坐标轴的范围、刻度或标签,以更好地展示你的数据。Matplotlib提供了多种方法来自定义坐标轴。
以下是一个展示如何调整坐标轴的示例:
import matplotlib.pyplot as plt
import numpy as np

categories = ['Category A', 'Category B', 'Category C', 'Category D']
series1 = [100, 200, 150, 250]
series2 = [50, 100, 120, 80]

fig, ax = plt.subplots(figsize=(12, 7))

ax.bar(categories, series1, label='Series 1')
ax.bar(categories, series2, bottom=series1, label='Series 2')

ax.set_xlabel('Categories')
ax.set_ylabel('Values (in thousands)')
ax.set_title('Stacked Bar Plot with Customized Axes - how2matplotlib.com')
ax.legend()

# 设置y轴范围
ax.set_ylim(0, 400)

# 自定义y轴刻度
ax.set_yticks(np.arange(0, 401, 100))
ax.set_yticklabels(['0', '100', '200', '300', '400'])

# 旋转x轴标签
plt.xticks(rotation=45, ha='right')

# 添加次要刻度
ax.minorticks_on()

plt.tight_layout()
plt.show()
Output:
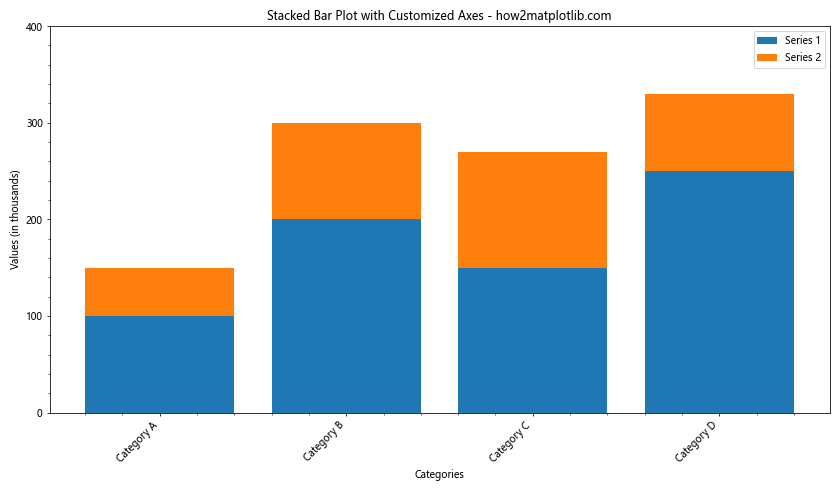
在这个例子中,我们设置了y轴的范围和刻度,旋转了x轴的标签以避免重叠,并添加了次要刻度线。
12. 添加注释
注释可以帮助突出显示图表中的重要信息或趋势。Matplotlib提供了多种方式来添加注释。
以下是一个在堆叠条形图中添加注释的示例:
import matplotlib.pyplot as plt
import numpy as np

categories = ['A', 'B', 'C', 'D']
series1 = [10, 20, 15, 25]
series2 = [5, 10, 12, 8]

fig, ax = plt.subplots(figsize=(10, 6))

ax.bar(categories, series1, label='Series 1')
ax.bar(categories, series2, bottom=series1, label='Series 2')

ax.set_xlabel('Categories')
ax.set_ylabel('Values')
ax.set_title('Stacked Bar Plot with Annotations - how2matplotlib.com')
ax.legend()

# 添加注释
ax.annotate('Highest total', xy=('B', 30), xytext=(3, 35),
            arrowprops=dict(facecolor='black', shrink=0.05))

ax.annotate('Lowest Series 2', xy=('A', 15), xytext=(-0.5, 20),
            arrowprops=dict(facecolor='black', shrink=0.05))

plt.tight_layout()
plt.show()
Output:
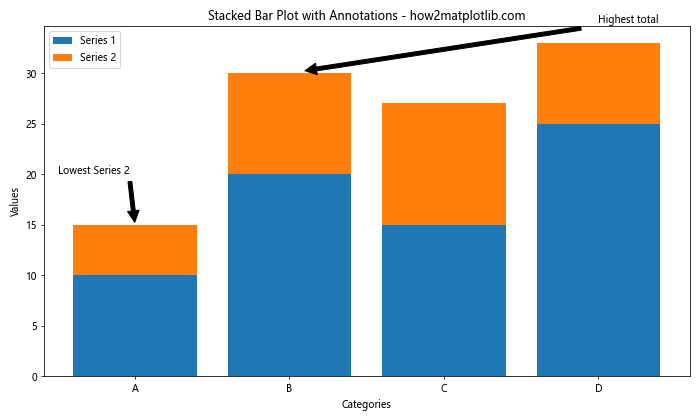
在这个例子中,我们使用ax.annotate()函数添加了两个带箭头的注释,分别指向最高总值和最低的Series 2值。
13. 多子图布局
当你需要比较多个堆叠条形图时,可以使用Matplotlib的子图功能来创建多个图表。
以下是一个创建多个子图的示例:
import matplotlib.pyplot as plt
import numpy as np

categories = ['A', 'B', 'C', 'D']
data1 = {'Series 1': [10, 20, 15, 25], 'Series 2': [5, 10, 12, 8]}
data2 = {'Series 1': [15, 25, 20, 30], 'Series 2': [8, 12, 15, 10]}

fig, (ax1, ax2) = plt.subplots(1, 2, figsize=(15, 6))

# 第一个子图
bottom = np.zeros(4)
for series, values in data1.items():
    ax1.bar(categories, values, bottom=bottom, label=series)
    bottom += values
ax1.set_title('Stacked Bar Plot 1 - how2matplotlib.com')
ax1.legend()

# 第二个子图
bottom = np.zeros(4)
for series, values in data2.items():
    ax2.bar(categories, values, bottom=bottom, label=series)
    bottom += values
ax2.set_title('Stacked Bar Plot 2 - how2matplotlib.com')
ax2.legend()

plt.tight_layout()
plt.show()
Output:
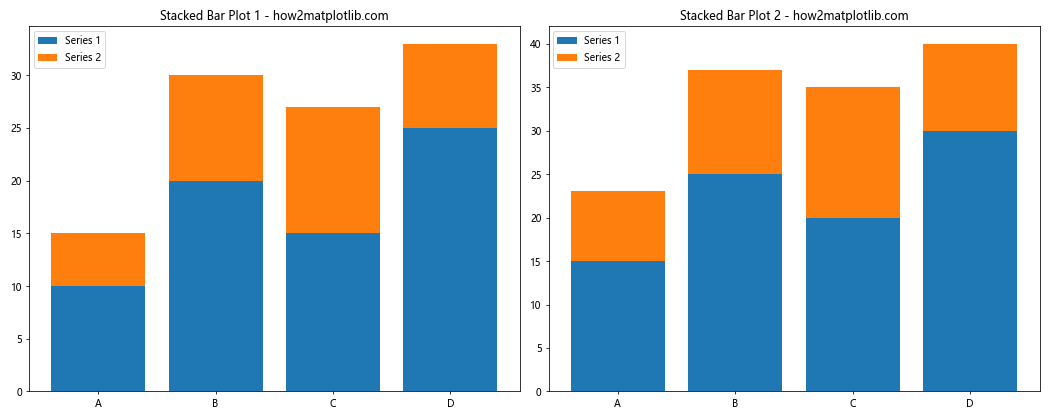
在这个例子中,我们创建了两个并排的堆叠条形图,每个图表显示不同的数据集。
14. 动态更新堆叠条形图
在某些应用中,你可能需要动态更新堆叠条形图,例如实时数据可视化。虽然Matplotlib主要用于静态图表,但它也支持简单的动画。
以下是一个展示如何创建动态更新的堆叠条形图的示例:
import matplotlib.pyplot as plt
import numpy as np
from matplotlib.animation import FuncAnimation

categories = ['A', 'B', 'C', 'D']
series1 = [10, 20, 15, 25]
series2 = [5, 10, 12, 8]

fig, ax = plt.subplots(figsize=(10, 6))

def update(frame):
    ax.clear()
    new_series1 = [x + np.random.randint(-5, 6) for x in series1]
    new_series2 = [x + np.random.randint(-3, 4) for x in series2]

    ax.bar(categories, new_series1, label='Series 1')
    ax.bar(categories, new_series2, bottom=new_series1, label='Series 2')

    ax.set_xlabel('Categories')
    ax.set_ylabel('Values')
    ax.set_title(f'Dynamic Stacked Bar Plot - Frame {frame} - how2matplotlib.com')
    ax.legend()
    ax.set_ylim(0, 50)

ani = FuncAnimation(fig, update, frames=range(50), repeat=False, interval=200)

plt.tight_layout()
plt.show()
Output:
在这个例子中,我们使用FuncAnimation创建了一个动画,每帧都会更新堆叠条形图的数据。
15. 保存堆叠条形图
创建完堆叠条形图后,你可能想要保存它以便later使用或分享。Matplotlib支持多种图像格式的保存。
以下是一个展示如何保存堆叠条形图的示例:
import matplotlib.pyplot as plt
import numpy as np

categories = ['A', 'B', 'C', 'D']
series1 = [10, 20, 15, 25]
series2 = [5, 10, 12, 8]

fig, ax = plt.subplots(figsize=(10, 6))

ax.bar(categories, series1, label='Series 1')
ax.bar(categories, series2, bottom=series1, label='Series 2')

ax.set_xlabel('Categories')
ax.set_ylabel('Values')
ax.set_title('Stacked Bar Plot to Save - how2matplotlib.com')
ax.legend()

plt.tight_layout()

# 保存为PNG格式
plt.savefig('stacked_bar_plot.png', dpi=300, bbox_inches='tight')

# 保存为PDF格式
plt.savefig('stacked_bar_plot.pdf', bbox_inches='tight')

# 保存为SVG格式
plt.savefig('stacked_bar_plot.svg', bbox_inches='tight')

plt.show()
Output:
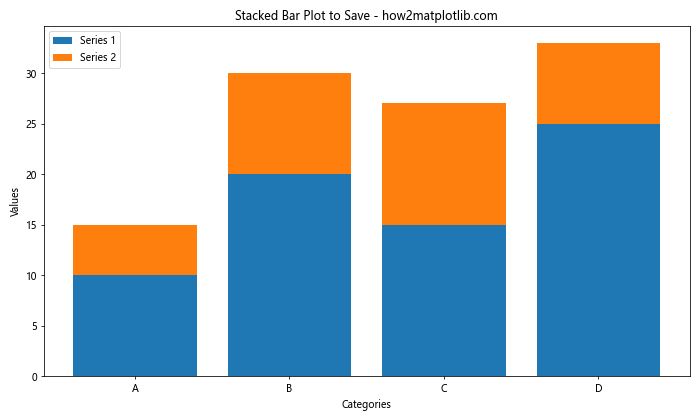
在这个例子中,我们将同一个图表保存为PNG、PDF和SVG三种不同的格式。dpi参数控制图像的分辨率,bbox_inches='tight'参数确保图表的所有部分都被包含在保存的文件中。
结论
堆叠条形图是一种强大的数据可视化工具,能够有效地展示多个类别和系列的数据。通过Matplotlib,我们可以创建各种类型的堆叠条形图,从简单的双系列图到复杂的多系列、多组图表。本文介绍了创建堆叠条形图的基本方法,以及如何自定义图表的各个方面,包括颜色、标签、图例、坐标轴等。我们还探讨了一些高级技巧,如添加误差条、创建动态图表和保存图表。
掌握这些技能将使你能够创建更加丰富和信息量大的数据可视化,帮助你更好地理解和展示数据。记住,好的数据可视化不仅仅是about美观,更重要的是能够清晰、准确地传达信息。因此,在创建堆叠条形图时,始终要考虑你的目标受众和你想要传达的主要信息。
随着实践的增加,你将能够更加熟练地使用Matplotlib创建各种类型的堆叠条形图,并能够根据具体需求进行灵活的调整和优化。希望本文能够为你的数据可视化之旅提供有价值的指导和启发。
 极客教程
极客教程