Matplotlib中如何在条形图上显示百分比标签
参考:Display percentage above bar chart in Matplotlib
Matplotlib是Python中最流行的数据可视化库之一,它提供了丰富的绘图功能,包括条形图的绘制。在数据分析和展示中,我们经常需要在条形图上显示百分比标签,以便更直观地展示数据的比例关系。本文将详细介绍如何在Matplotlib中的条形图上显示百分比标签,包括基本方法、自定义样式、处理多组数据等多个方面。
1. 基本条形图的绘制
在开始为条形图添加百分比标签之前,我们首先需要了解如何使用Matplotlib绘制基本的条形图。以下是一个简单的示例:
import matplotlib.pyplot as plt

categories = ['A', 'B', 'C', 'D']
values = [25, 40, 30, 55]

plt.figure(figsize=(10, 6))
plt.bar(categories, values)
plt.title('Basic Bar Chart - how2matplotlib.com')
plt.xlabel('Categories')
plt.ylabel('Values')
plt.show()
Output:
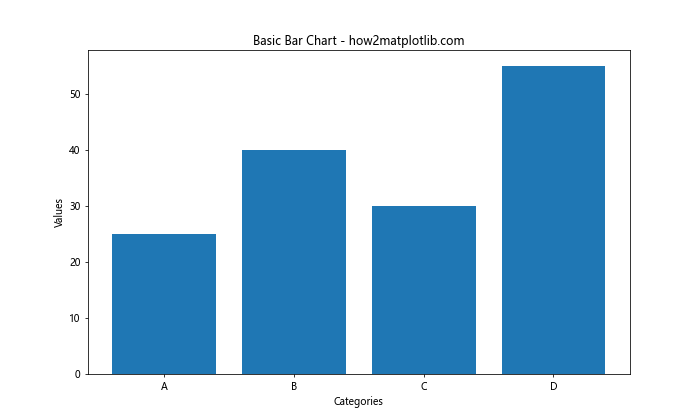
这段代码创建了一个简单的条形图,其中包含四个类别(A、B、C、D)和对应的数值。plt.figure(figsize=(10, 6))用于设置图表的大小,plt.bar(categories, values)创建条形图,plt.title()、plt.xlabel()和plt.ylabel()分别用于设置图表标题和坐标轴标签。
2. 在条形图上添加简单的百分比标签
现在,让我们在上面的基本条形图上添加百分比标签:
import matplotlib.pyplot as plt

categories = ['A', 'B', 'C', 'D']
values = [25, 40, 30, 55]
total = sum(values)
percentages = [value / total * 100 for value in values]

plt.figure(figsize=(10, 6))
bars = plt.bar(categories, values)

for bar, percentage in zip(bars, percentages):
    plt.text(bar.get_x() + bar.get_width() / 2, bar.get_height(),
             f'{percentage:.1f}%',
             ha='center', va='bottom')

plt.title('Bar Chart with Percentages - how2matplotlib.com')
plt.xlabel('Categories')
plt.ylabel('Values')
plt.show()
Output:
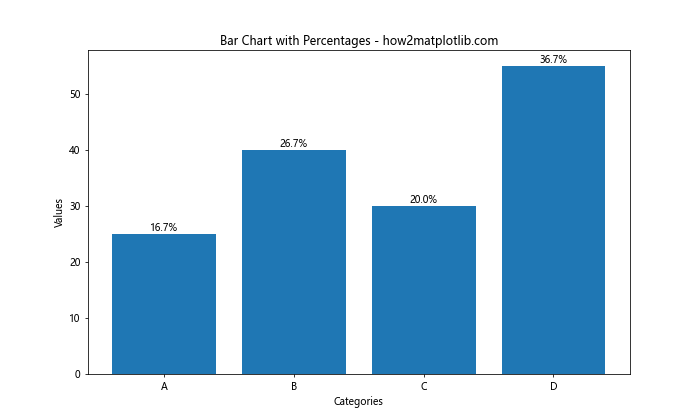
在这个示例中,我们首先计算了每个类别的百分比。然后,我们使用plt.text()函数在每个条形上方添加文本。bar.get_x() + bar.get_width() / 2用于计算条形的中心x坐标,bar.get_height()获取条形的高度,ha='center'和va='bottom'用于设置文本的水平和垂直对齐方式。
3. 自定义百分比标签的样式
为了使百分比标签更加醒目,我们可以自定义其样式,例如改变字体大小、颜色等:
import matplotlib.pyplot as plt

categories = ['A', 'B', 'C', 'D']
values = [25, 40, 30, 55]
total = sum(values)
percentages = [value / total * 100 for value in values]

plt.figure(figsize=(10, 6))
bars = plt.bar(categories, values)

for bar, percentage in zip(bars, percentages):
    plt.text(bar.get_x() + bar.get_width() / 2, bar.get_height(),
             f'{percentage:.1f}%',
             ha='center', va='bottom', fontweight='bold', fontsize=12, color='red')

plt.title('Bar Chart with Styled Percentages - how2matplotlib.com')
plt.xlabel('Categories')
plt.ylabel('Values')
plt.show()
Output:
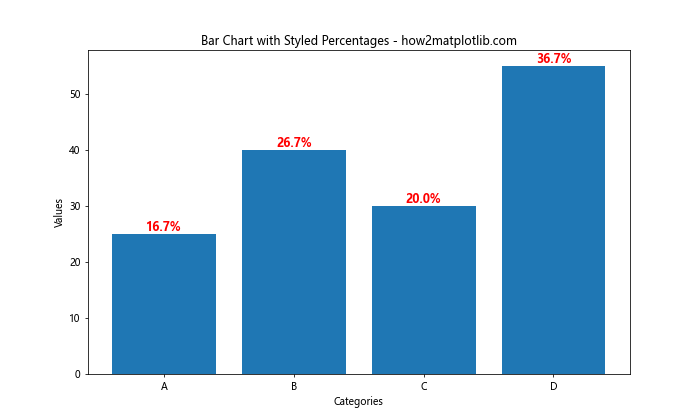
在这个示例中,我们为plt.text()函数添加了额外的参数:fontweight='bold'使文本加粗,fontsize=12设置字体大小,color='red'将文本颜色设置为红色。
4. 处理负值和零值
在实际应用中,我们可能会遇到负值或零值的情况。以下示例展示了如何处理这些特殊情况:
import matplotlib.pyplot as plt

categories = ['A', 'B', 'C', 'D', 'E']
values = [25, -10, 0, 40, 15]
total = sum(abs(v) for v in values)
percentages = [abs(value) / total * 100 for value in values]

plt.figure(figsize=(10, 6))
bars = plt.bar(categories, values)

for bar, percentage, value in zip(bars, percentages, values):
    if value >= 0:
        va = 'bottom'
        y = bar.get_height()
    else:
        va = 'top'
        y = bar.get_y()

    plt.text(bar.get_x() + bar.get_width() / 2, y,
             f'{percentage:.1f}%',
             ha='center', va=va)

plt.title('Bar Chart with Percentages (Including Negative Values) - how2matplotlib.com')
plt.xlabel('Categories')
plt.ylabel('Values')
plt.axhline(y=0, color='k', linestyle='-', linewidth=0.5)
plt.show()
Output:
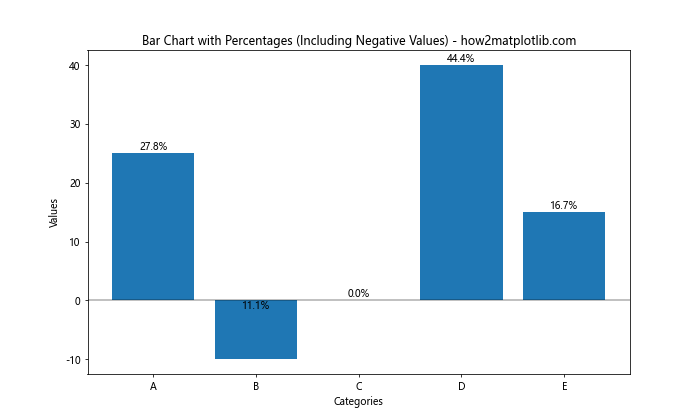
在这个示例中,我们使用abs()函数来处理负值,并根据值的正负来调整标签的位置。对于正值,标签放在条形顶部;对于负值,标签放在条形底部。我们还添加了一条水平线(plt.axhline())来标记零点。
5. 堆叠条形图中显示百分比
堆叠条形图是另一种常见的图表类型,我们也可以在其中显示百分比标签:
import matplotlib.pyplot as plt
import numpy as np

categories = ['A', 'B', 'C', 'D']
values1 = [20, 35, 30, 35]
values2 = [25, 25, 15, 30]
values3 = [15, 15, 20, 20]

total = np.array(values1) + np.array(values2) + np.array(values3)
percentages1 = values1 / total * 100
percentages2 = values2 / total * 100
percentages3 = values3 / total * 100

plt.figure(figsize=(10, 6))
bars1 = plt.bar(categories, values1, label='Group 1')
bars2 = plt.bar(categories, values2, bottom=values1, label='Group 2')
bars3 = plt.bar(categories, values3, bottom=np.array(values1) + np.array(values2), label='Group 3')

def add_labels(bars, percentages):
    for bar, percentage in zip(bars, percentages):
        height = bar.get_height()
        plt.text(bar.get_x() + bar.get_width() / 2, bar.get_y() + height / 2,
                 f'{percentage:.1f}%', ha='center', va='center')

add_labels(bars1, percentages1)
add_labels(bars2, percentages2)
add_labels(bars3, percentages3)

plt.title('Stacked Bar Chart with Percentages - how2matplotlib.com')
plt.xlabel('Categories')
plt.ylabel('Values')
plt.legend()
plt.show()
Output:
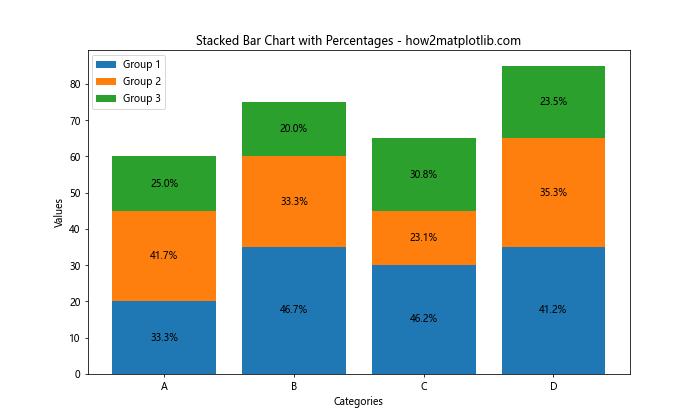
在这个示例中,我们创建了一个堆叠条形图,包含三组数据。我们定义了一个add_labels()函数来添加百分比标签,并将标签放置在每个条形的中心位置。
6. 水平条形图中显示百分比
除了垂直条形图,我们也可以在水平条形图中显示百分比标签:
import matplotlib.pyplot as plt

categories = ['A', 'B', 'C', 'D']
values = [25, 40, 30, 55]
total = sum(values)
percentages = [value / total * 100 for value in values]

plt.figure(figsize=(10, 6))
bars = plt.barh(categories, values)

for bar, percentage in zip(bars, percentages):
    plt.text(bar.get_width(), bar.get_y() + bar.get_height() / 2,
             f'{percentage:.1f}%',
             ha='left', va='center')

plt.title('Horizontal Bar Chart with Percentages - how2matplotlib.com')
plt.xlabel('Values')
plt.ylabel('Categories')
plt.show()
Output:
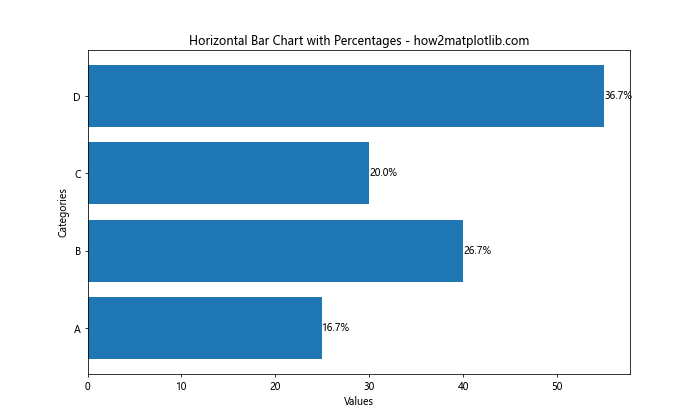
这个示例使用plt.barh()函数创建水平条形图。我们调整了plt.text()函数的参数,将标签放置在每个条形的右侧。
7. 使用自定义颜色和渐变
为了使图表更加吸引人,我们可以为条形图添加自定义颜色和渐变效果:
import matplotlib.pyplot as plt
from matplotlib.colors import LinearSegmentedColormap

categories = ['A', 'B', 'C', 'D', 'E']
values = [25, 40, 30, 55, 35]
total = sum(values)
percentages = [value / total * 100 for value in values]

# 创建自定义颜色映射
colors = ['#FF9999', '#66B2FF', '#99FF99', '#FFCC99', '#FF99CC']
cmap = LinearSegmentedColormap.from_list("custom", colors, N=len(categories))

plt.figure(figsize=(10, 6))
bars = plt.bar(categories, values, color=cmap(np.linspace(0, 1, len(categories))))

for bar, percentage in zip(bars, percentages):
    plt.text(bar.get_x() + bar.get_width() / 2, bar.get_height(),
             f'{percentage:.1f}%',
             ha='center', va='bottom', fontweight='bold')

plt.title('Bar Chart with Custom Colors and Percentages - how2matplotlib.com')
plt.xlabel('Categories')
plt.ylabel('Values')
plt.show()
在这个示例中,我们使用LinearSegmentedColormap创建了一个自定义的颜色映射,并将其应用到条形图中。这样可以为每个条形赋予不同的颜色,使图表更加丰富多彩。
8. 在分组条形图中显示百分比
分组条形图是另一种常见的图表类型,我们也可以在其中显示百分比标签:
import matplotlib.pyplot as plt
import numpy as np

categories = ['A', 'B', 'C', 'D']
group1 = [20, 35, 30, 35]
group2 = [25, 32, 34, 20]

x = np.arange(len(categories))
width = 0.35

fig, ax = plt.subplots(figsize=(10, 6))
rects1 = ax.bar(x - width/2, group1, width, label='Group 1')
rects2 = ax.bar(x + width/2, group2, width, label='Group 2')

def add_percentage_labels(rects):
    for rect in rects:
        height = rect.get_height()
        ax.annotate(f'{height/sum(group1+group2)*100:.1f}%',
                    xy=(rect.get_x() + rect.get_width() / 2, height),
                    xytext=(0, 3),  # 3 points vertical offset
                    textcoords="offset points",
                    ha='center', va='bottom')

add_percentage_labels(rects1)
add_percentage_labels(rects2)

ax.set_ylabel('Values')
ax.set_title('Grouped Bar Chart with Percentages - how2matplotlib.com')
ax.set_xticks(x)
ax.set_xticklabels(categories)
ax.legend()

fig.tight_layout()
plt.show()
Output:
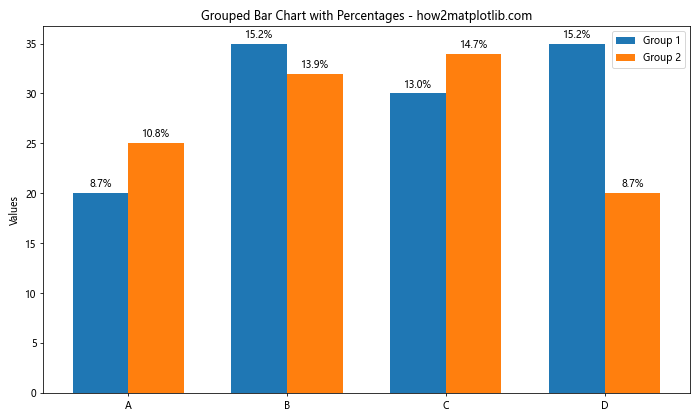
在这个示例中,我们创建了一个分组条形图,包含两组数据。我们定义了一个add_percentage_labels()函数来为每个条形添加百分比标签。百分比是相对于所有数据的总和计算的。
9. 使用极坐标系显示百分比
为了创建更独特的可视化效果,我们可以使用极坐标系来显示百分比:
import matplotlib.pyplot as plt
import numpy as np

categories = ['A', 'B', 'C', 'D', 'E']
values = [25, 40, 30, 55, 35]
total = sum(values)
percentages = [value / total * 100 for value in values]

angles = [n / float(len(categories)) * 2 * np.pi for n in range(len(categories))]
angles += angles[:1]

percentages += percentages[:1]

fig, ax = plt.subplots(figsize=(10, 10), subplot_kw=dict(projection='polar'))
ax.plot(angles, percentages)
ax.fill(angles, percentages, alpha=0.3)

ax.set_xticks(angles[:-1])
ax.set_xticklabels(categories)

for angle, percentage in zip(angles[:-1], percentages[:-1]):
    ax.text(angle, percentage + 5, f'{percentage:.1f}%', ha='center', va='center')

plt.title('Polar Chart with Percentages - how2matplotlib.com')
plt.show()
Output:
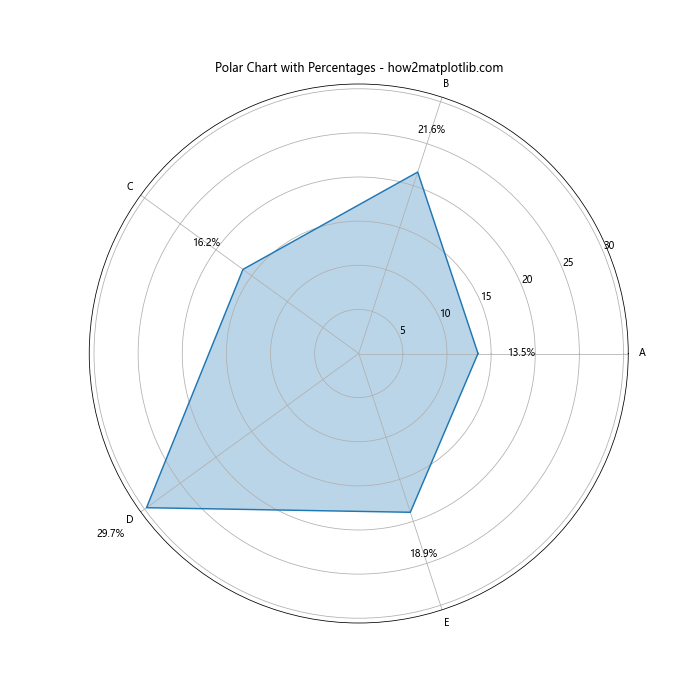
这个示例使用极坐标系创建了一个雷达图,并在每个数据点旁边显示百分比标签。这种方式特别适合展示循环数据或比较多个维度的数据。
10. 使用饼图显示百分比
饼图是显示百分比数据的另一种常用方式:
import matplotlib.pyplot as plt

categories = ['A', 'B', 'C', 'D', 'E']
values = [25, 40, 30, 55, 35]

plt.figure(figsize=(10, 10))
plt.pie(values, labels=categories, autopct='%1.1f%%', startangle=90)
plt.title('Pie Chart with Percentages - how2matplotlib.com')
plt.axis('equal')  # Equal aspect ratio ensures that pie is drawn as a circle
plt.show()
Output:
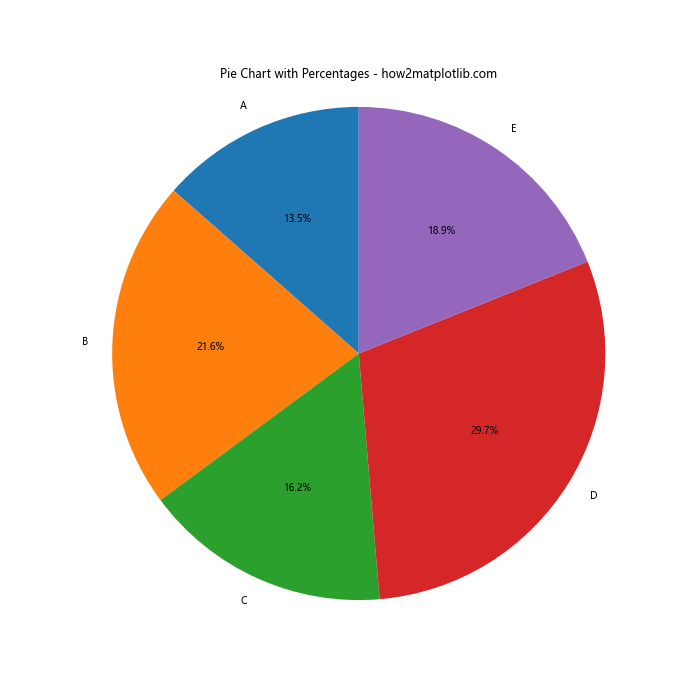
在这个示例中,我们使用plt.pie()函数创建饼图。autopct='%1.1f%%'参数自动为每个扇形添加百分比标签。startangle=90参数设置起始角度为90度,使第一个扇形从12点钟位置开始。
11. 在条形图中显示累积百分比
有时我们需要显示累积百分比,以下是一个示例:
import matplotlib.pyplot as plt
import numpy as np

categories = ['A', 'B', 'C', 'D', 'E']
values = [25, 40, 30, 55, 35]
total = sum(values)
percentages = [value / total * 100 for value in values]
cumulative_percentages = np.cumsum(percentages)

plt.figure(figsize=(10, 6))
bars = plt.bar(categories, values)

for i, (bar, percentage, cum_percentage) in enumerate(zip(bars, percentages, cumulative_percentages)):
    plt.text(bar.get_x() + bar.get_width() / 2, bar.get_height(),
             f'{percentage:.1f}%\n({cum_percentage:.1f}%)',
             ha='center', va='bottom')

plt.plot(categories, cumulative_percentages, 'ro-')

plt.title('Bar Chart with Cumulative Percentages - how2matplotlib.com')
plt.xlabel('Categories')
plt.ylabel('Values')
plt.show()
Output:
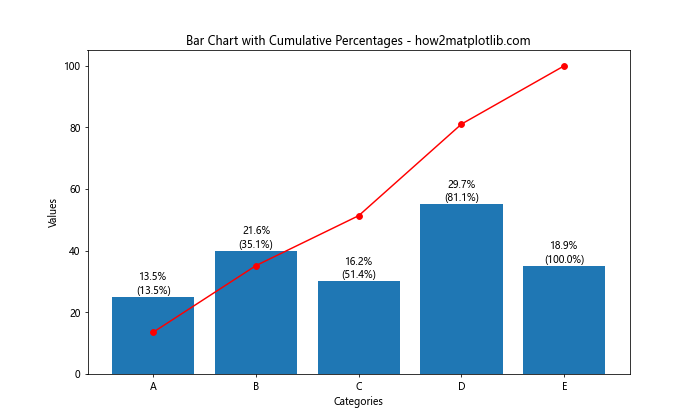
这个示例不仅显示了每个类别的百分比,还显示了累积百分比。我们使用np.cumsum()函数计算累积百分比,并用红色的线和点表示累积百分比的变化。
12. 在条形图中显示相对百分比
有时我们可能需要显示相对于某个基准值的百分比,而不是相对于总和的百分比:
import matplotlib.pyplot as plt

categories = ['A', 'B', 'C', 'D', 'E']
values = [25, 40, 30, 55, 35]
baseline = 35  # 假设35是基准值

percentages = [(value - baseline) / baseline * 100 for value in values]

plt.figure(figsize=(10, 6))
bars = plt.bar(categories, values)

for bar, percentage in zip(bars, percentages):
    color = 'green' if percentage >= 0 else 'red'
    plt.text(bar.get_x() + bar.get_width() / 2, bar.get_height(),
             f'{percentage:+.1f}%',
             ha='center', va='bottom', color=color)

plt.axhline(y=baseline, color='r', linestyle='--')
plt.text(len(categories), baseline, 'Baseline', ha='right', va='bottom')

plt.title('Bar Chart with Relative Percentages - how2matplotlib.com')
plt.xlabel('Categories')
plt.ylabel('Values')
plt.show()
Output:
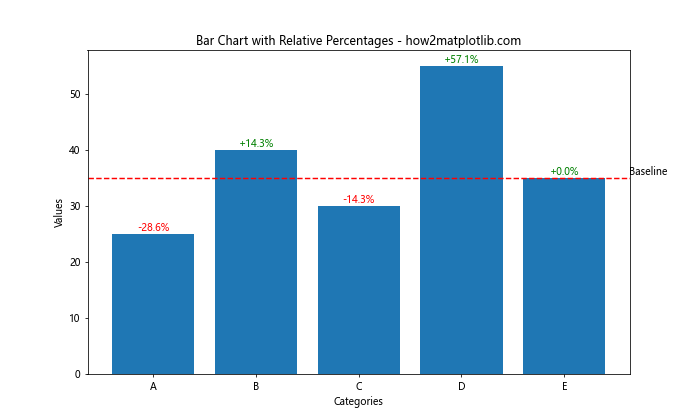
在这个示例中,我们计算了每个值相对于基准值的百分比变化。正值用绿色表示,负值用红色表示。我们还添加了一条红色虚线来标记基准值。
13. 在3D条形图中显示百分比
Matplotlib也支持创建3D图表,我们可以在3D条形图中显示百分比:
import matplotlib.pyplot as plt
import numpy as np
from mpl_toolkits.mplot3d import Axes3D

fig = plt.figure(figsize=(10, 8))
ax = fig.add_subplot(111, projection='3d')

x = ['A', 'B', 'C', 'D']
y = ['Group 1', 'Group 2', 'Group 3']
z = np.array([[20, 35, 30, 35],
              [25, 32, 34, 20],
              [15, 15, 20, 25]])

x_pos, y_pos = np.meshgrid(range(len(x)), range(len(y)))
x_pos = x_pos.flatten()
y_pos = y_pos.flatten()
z_pos = np.zeros_like(x_pos)

dx = dy = 0.5
dz = z.flatten()

total = np.sum(z)
percentages = dz / total * 100

ax.bar3d(x_pos, y_pos, z_pos, dx, dy, dz)

for x, y, z, percentage in zip(x_pos, y_pos, dz, percentages):
    ax.text(x, y, z, f'{percentage:.1f}%', ha='center', va='bottom')

ax.set_xticks(range(len(x)))
ax.set_yticks(range(len(y)))
ax.set_xticklabels(x)
ax.set_yticklabels(y)

ax.set_title('3D Bar Chart with Percentages - how2matplotlib.com')
ax.set_xlabel('X axis')
ax.set_ylabel('Y axis')
ax.set_zlabel('Z axis')

plt.show()
这个示例创建了一个3D条形图,并在每个条形顶部显示百分比标签。3D图表可以帮助我们同时展示多个维度的数据。
14. 在条形图中显示误差条和百分比
在某些情况下,我们可能需要在条形图中同时显示误差条和百分比标签:
import matplotlib.pyplot as plt
import numpy as np

categories = ['A', 'B', 'C', 'D']
values = [25, 40, 30, 55]
errors = [2, 3, 2.5, 4]

total = sum(values)
percentages = [value / total * 100 for value in values]

plt.figure(figsize=(10, 6))
bars = plt.bar(categories, values, yerr=errors, capsize=5)

for bar, percentage in zip(bars, percentages):
    plt.text(bar.get_x() + bar.get_width() / 2, bar.get_height(),
             f'{percentage:.1f}%',
             ha='center', va='bottom')

plt.title('Bar Chart with Error Bars and Percentages - how2matplotlib.com')
plt.xlabel('Categories')
plt.ylabel('Values')
plt.show()
Output:
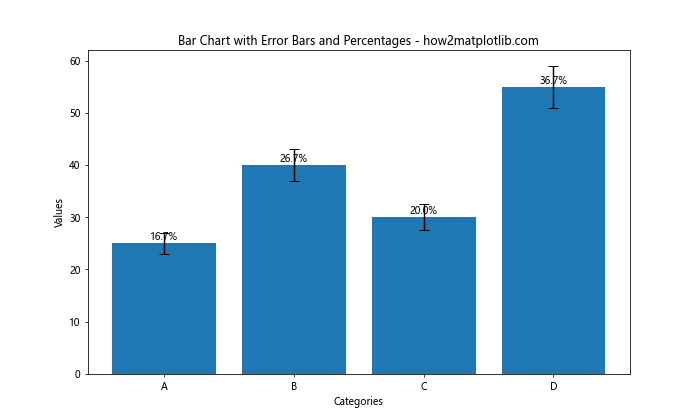
在这个示例中,我们使用yerr参数添加了误差条,capsize参数设置误差条末端的大小。百分比标签被放置在条形的顶部,位于误差条之上。
15. 在条形图中显示数值和百分比
有时我们可能希望同时显示实际数值和百分比:
import matplotlib.pyplot as plt

categories = ['A', 'B', 'C', 'D']
values = [25, 40, 30, 55]
total = sum(values)
percentages = [value / total * 100 for value in values]

plt.figure(figsize=(10, 6))
bars = plt.bar(categories, values)

for bar, value, percentage in zip(bars, values, percentages):
    plt.text(bar.get_x() + bar.get_width() / 2, bar.get_height(),
             f'{value}\n({percentage:.1f}%)',
             ha='center', va='bottom')

plt.title('Bar Chart with Values and Percentages - how2matplotlib.com')
plt.xlabel('Categories')
plt.ylabel('Values')
plt.show()
Output:
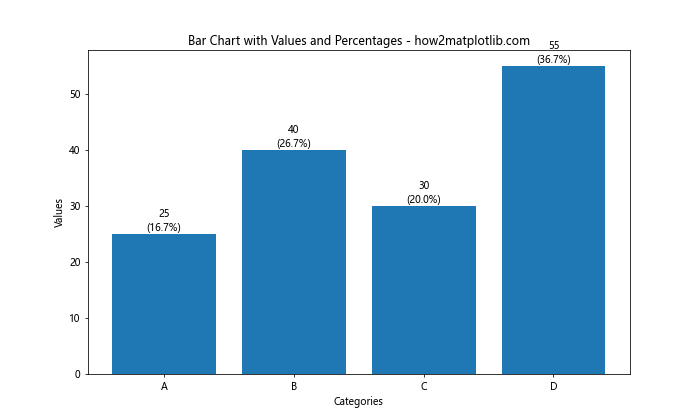
在这个示例中,我们在每个条形上方显示了实际数值和百分比,使用\n来分隔两行文本。
16. 在条形图中使用不同的百分比计算方法
有时我们可能需要使用不同的方法来计算百分比,例如相对于最大值而不是总和:
import matplotlib.pyplot as plt

categories = ['A', 'B', 'C', 'D']
values = [25, 40, 30, 55]
max_value = max(values)
percentages = [value / max_value * 100 for value in values]

plt.figure(figsize=(10, 6))
bars = plt.bar(categories, values)

for bar, percentage in zip(bars, percentages):
    plt.text(bar.get_x() + bar.get_width() / 2, bar.get_height(),
             f'{percentage:.1f}%',
             ha='center', va='bottom')

plt.title('Bar Chart with Percentages Relative to Maximum - how2matplotlib.com')
plt.xlabel('Categories')
plt.ylabel('Values')
plt.show()
Output:
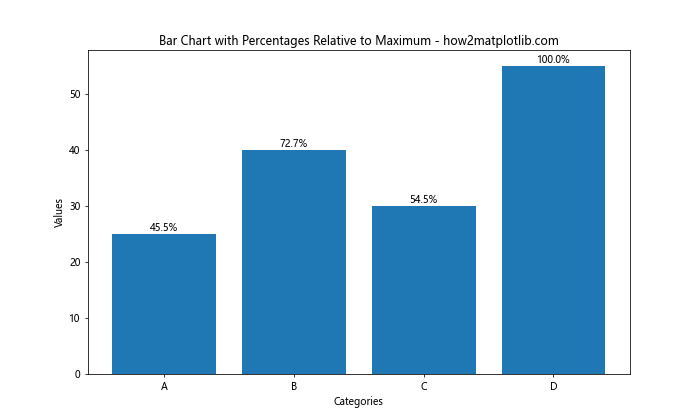
在这个示例中,我们计算了每个值相对于最大值的百分比,而不是相对于总和。这种方法可以用来展示每个类别相对于最佳表现的比例。
17. 在条形图中显示百分比变化
有时我们可能想要展示百分比的变化,而不是静态的百分比值:
import matplotlib.pyplot as plt

categories = ['A', 'B', 'C', 'D']
values_before = [25, 40, 30, 55]
values_after = [30, 35, 45, 50]

percentage_changes = [(after - before) / before * 100 for before, after in zip(values_before, values_after)]

plt.figure(figsize=(10, 6))
bars = plt.bar(categories, values_after)

for bar, change in zip(bars, percentage_changes):
    color = 'green' if change >= 0 else 'red'
    plt.text(bar.get_x() + bar.get_width() / 2, bar.get_height(),
             f'{change:+.1f}%',
             ha='center', va='bottom', color=color)

plt.title('Bar Chart with Percentage Changes - how2matplotlib.com')
plt.xlabel('Categories')
plt.ylabel('Values')
plt.show()
Output:
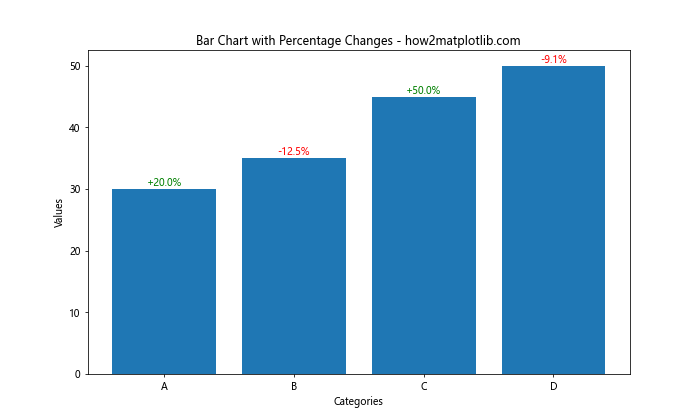
这个示例计算并显示了每个类别的百分比变化。正变化用绿色表示,负变化用红色表示。
结论
在Matplotlib中为条形图添加百分比标签是一种有效的数据可视化技巧,可以帮助读者更好地理解数据的比例关系。本文介绍了多种在条形图中显示百分比的方法,包括基本的垂直和水平条形图、堆叠条形图、分组条形图,以及一些更高级的技巧,如处理负值、显示累积百分比、使用自定义颜色等。
通过这些技巧,你可以创建更加信息丰富、直观的数据可视化图表。记住,选择合适的可视化方法取决于你的数据特征和你想要传达的信息。在实际应用中,你可能需要结合多种技巧来创建最适合你需求的图表。
最后,建议在使用这些技巧时,始终考虑数据的可读性和清晰度。过多的标签或复杂的设计可能会使图表变得混乱,反而影响了数据的传达效果。因此,在添加百分比标签时,要权衡信息量和视觉清晰度,选择最能有效传达你的数据故事的方式。
 极客教程
极客教程