Matplotlib中为等高线图创建图例的全面指南
参考:Creating a Legend for a Contour Plot
等高线图是一种强大的数据可视化工具,用于展示三维数据在二维平面上的分布。在Matplotlib中创建等高线图时,添加一个清晰的图例可以大大提高图表的可读性和信息传递效果。本文将详细介绍如何在Matplotlib中为等高线图创建图例,包括基本概念、不同类型的图例、自定义选项以及一些高级技巧。
1. 等高线图基础
在深入探讨图例之前,我们先简要回顾一下等高线图的基本概念。等高线图通过在二维平面上绘制等值线来表示三维数据。每条等值线代表具有相同值的点的集合。
以下是一个简单的等高线图示例:
import numpy as np
import matplotlib.pyplot as plt

# 生成数据
x = np.linspace(-5, 5, 100)
y = np.linspace(-5, 5, 100)
X, Y = np.meshgrid(x, y)
Z = np.sin(np.sqrt(X**2 + Y**2))

# 创建等高线图
plt.figure(figsize=(8, 6))
contour = plt.contour(X, Y, Z)
plt.title('How2matplotlib.com: Basic Contour Plot')
plt.xlabel('X-axis')
plt.ylabel('Y-axis')
plt.show()
Output:
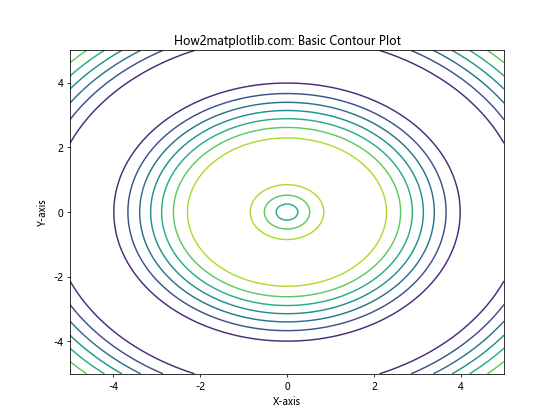
这个例子创建了一个基本的等高线图,但没有图例。接下来,我们将探讨如何为这样的图添加图例。
2. 使用plt.colorbar()添加颜色条
最简单的添加图例方法是使用plt.colorbar()函数。这会在图表旁边添加一个颜色条,显示等高线的颜色与相应值的对应关系。
import numpy as np
import matplotlib.pyplot as plt

x = np.linspace(-5, 5, 100)
y = np.linspace(-5, 5, 100)
X, Y = np.meshgrid(x, y)
Z = np.sin(np.sqrt(X**2 + Y**2))

plt.figure(figsize=(10, 8))
contour = plt.contour(X, Y, Z, cmap='viridis')
plt.colorbar(contour, label='Z values')
plt.title('How2matplotlib.com: Contour Plot with Colorbar')
plt.xlabel('X-axis')
plt.ylabel('Y-axis')
plt.show()
Output:
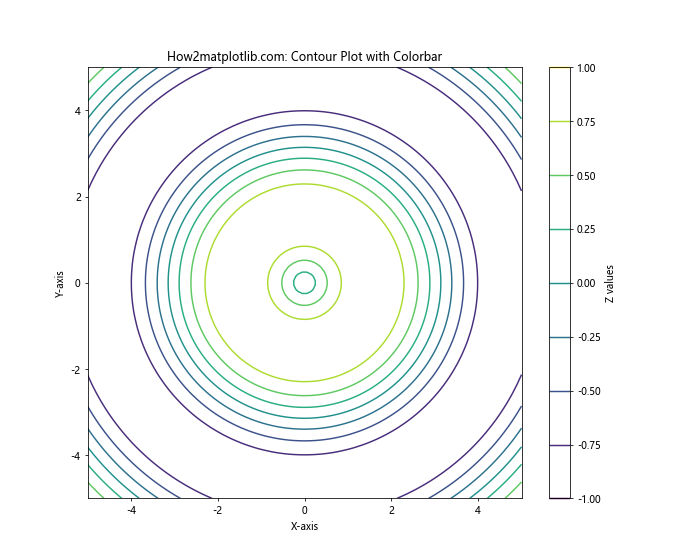
在这个例子中,我们使用plt.colorbar()函数添加了一个颜色条。label参数用于给颜色条添加标签。
3. 使用clabel()为等高线添加标签
另一种为等高线图添加信息的方法是直接在等高线上添加标签。这可以通过plt.clabel()函数实现。
import numpy as np
import matplotlib.pyplot as plt

x = np.linspace(-5, 5, 100)
y = np.linspace(-5, 5, 100)
X, Y = np.meshgrid(x, y)
Z = np.sin(np.sqrt(X**2 + Y**2))

plt.figure(figsize=(10, 8))
contour = plt.contour(X, Y, Z, levels=10)
plt.clabel(contour, inline=True, fontsize=8)
plt.title('How2matplotlib.com: Contour Plot with Labels')
plt.xlabel('X-axis')
plt.ylabel('Y-axis')
plt.show()
Output:
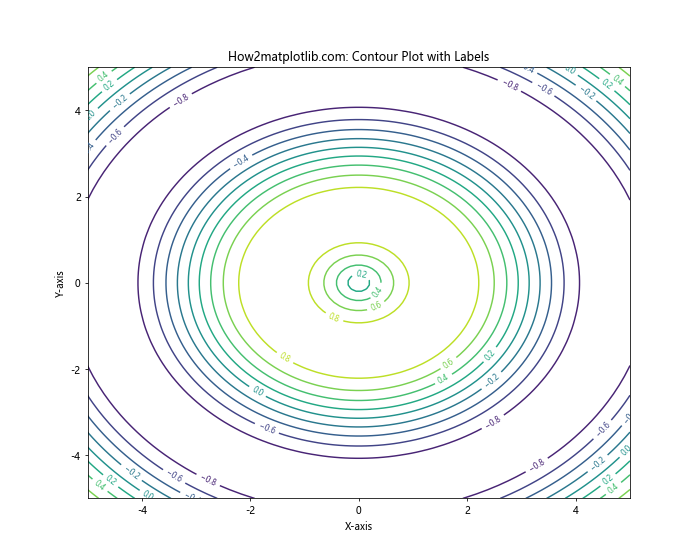
在这个例子中,plt.clabel()函数为等高线添加了标签。inline=True参数确保标签位于等高线内部,fontsize参数设置标签字体大小。
4. 自定义等高线颜色和样式
我们可以通过自定义等高线的颜色和样式来增强图例的视觉效果。
import numpy as np
import matplotlib.pyplot as plt

x = np.linspace(-5, 5, 100)
y = np.linspace(-5, 5, 100)
X, Y = np.meshgrid(x, y)
Z = np.sin(np.sqrt(X**2 + Y**2))

plt.figure(figsize=(10, 8))
levels = [-0.5, 0, 0.5]
contour = plt.contour(X, Y, Z, levels=levels, colors=['blue', 'green', 'red'], linestyles=['dashed', 'solid', 'dotted'])
plt.clabel(contour, inline=True, fontsize=8)
plt.title('How2matplotlib.com: Custom Contour Plot')
plt.xlabel('X-axis')
plt.ylabel('Y-axis')
plt.colorbar(contour)
plt.show()
Output:
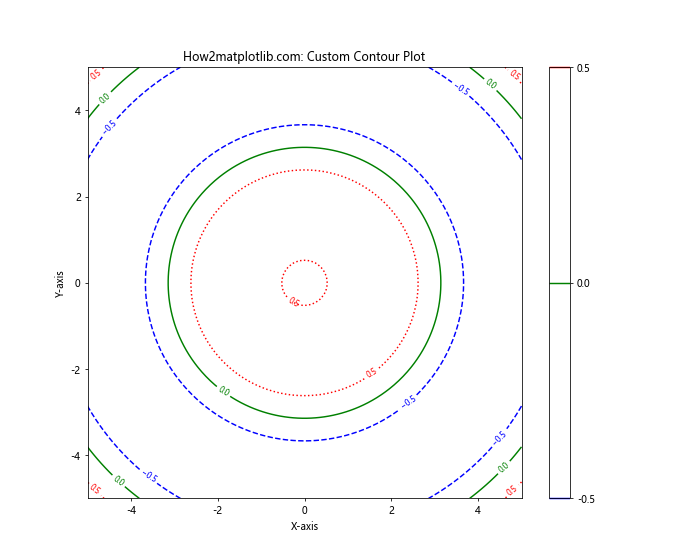
在这个例子中,我们使用levels参数指定了特定的等高线值,并为每个等高线指定了不同的颜色和线型。
5. 使用filled contours创建填充等高线图
填充等高线图可以更直观地展示数据分布。我们可以使用plt.contourf()函数创建填充等高线图。
import numpy as np
import matplotlib.pyplot as plt

x = np.linspace(-5, 5, 100)
y = np.linspace(-5, 5, 100)
X, Y = np.meshgrid(x, y)
Z = np.sin(np.sqrt(X**2 + Y**2))

plt.figure(figsize=(10, 8))
contourf = plt.contourf(X, Y, Z, levels=20, cmap='viridis')
plt.colorbar(contourf, label='Z values')
plt.title('How2matplotlib.com: Filled Contour Plot')
plt.xlabel('X-axis')
plt.ylabel('Y-axis')
plt.show()
Output:
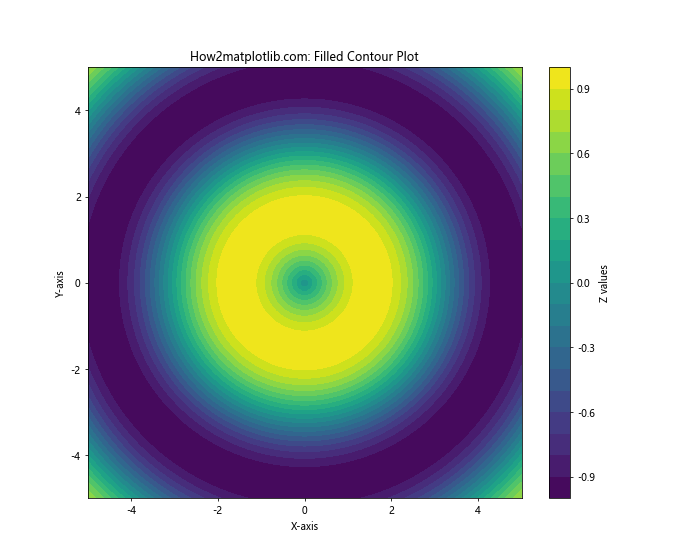
这个例子创建了一个填充等高线图,使用viridis颜色映射和20个等高线级别。
6. 组合填充等高线和线条等高线
我们可以将填充等高线和线条等高线结合起来,以获得更丰富的视觉效果。
import numpy as np
import matplotlib.pyplot as plt

x = np.linspace(-5, 5, 100)
y = np.linspace(-5, 5, 100)
X, Y = np.meshgrid(x, y)
Z = np.sin(np.sqrt(X**2 + Y**2))

plt.figure(figsize=(10, 8))
contourf = plt.contourf(X, Y, Z, levels=20, cmap='viridis', alpha=0.7)
contour = plt.contour(X, Y, Z, levels=10, colors='black', linewidths=0.5)
plt.clabel(contour, inline=True, fontsize=8)
plt.colorbar(contourf, label='Z values')
plt.title('How2matplotlib.com: Combined Filled and Line Contour Plot')
plt.xlabel('X-axis')
plt.ylabel('Y-axis')
plt.show()
Output:
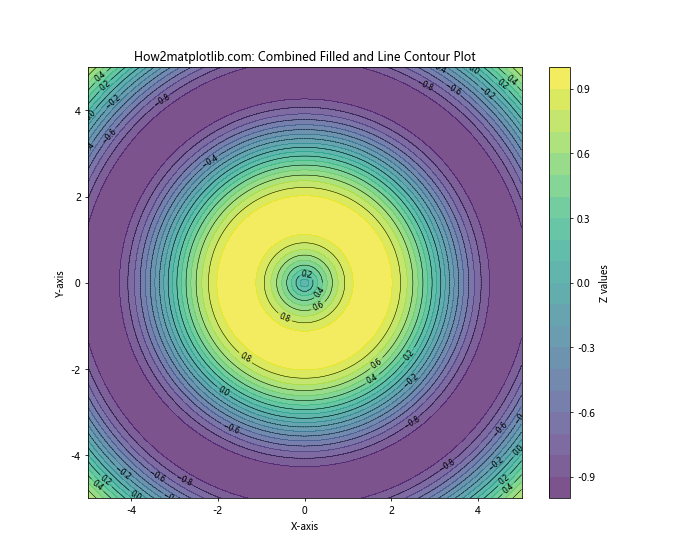
在这个例子中,我们首先创建了一个填充等高线图,然后在其上叠加了一个线条等高线图。alpha参数用于调整填充区域的透明度。
7. 使用LogNorm创建对数刻度等高线图
对于跨越多个数量级的数据,使用对数刻度的等高线图可能更合适。
import numpy as np
import matplotlib.pyplot as plt
from matplotlib.colors import LogNorm

x = np.logspace(0, 2, 100)
y = np.logspace(0, 2, 100)
X, Y = np.meshgrid(x, y)
Z = X * Y

plt.figure(figsize=(10, 8))
contour = plt.contour(X, Y, Z, levels=10, norm=LogNorm())
plt.clabel(contour, inline=True, fontsize=8)
plt.colorbar(contour, label='Z values (log scale)')
plt.title('How2matplotlib.com: Log-scaled Contour Plot')
plt.xlabel('X-axis (log scale)')
plt.ylabel('Y-axis (log scale)')
plt.xscale('log')
plt.yscale('log')
plt.show()
Output:
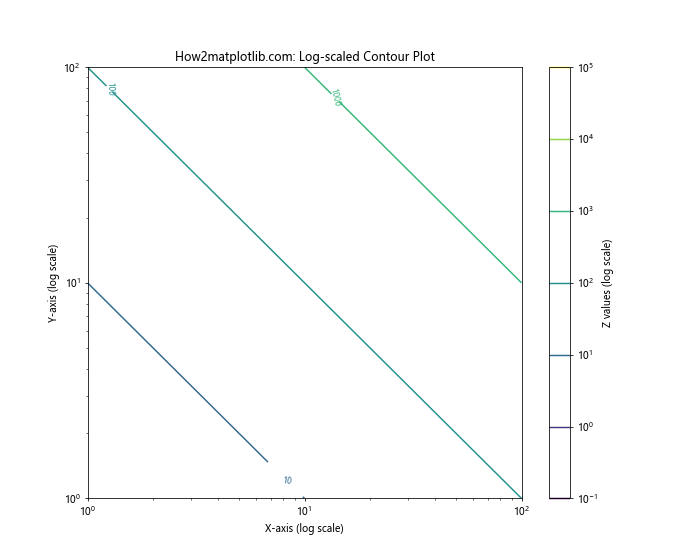
这个例子使用LogNorm创建了一个对数刻度的等高线图。注意我们也将x轴和y轴设置为对数刻度。
8. 为不同区域使用不同的颜色映射
有时我们可能想为等高线图的不同区域使用不同的颜色映射。这可以通过创建多个等高线对象来实现。
import numpy as np
import matplotlib.pyplot as plt

x = np.linspace(-5, 5, 100)
y = np.linspace(-5, 5, 100)
X, Y = np.meshgrid(x, y)
Z = np.sin(np.sqrt(X**2 + Y**2))

plt.figure(figsize=(10, 8))
contourf_neg = plt.contourf(X, Y, Z, levels=np.linspace(-1, 0, 10), cmap='cool')
contourf_pos = plt.contourf(X, Y, Z, levels=np.linspace(0, 1, 10), cmap='autumn')
plt.colorbar(contourf_neg, label='Negative Z values')
plt.colorbar(contourf_pos, label='Positive Z values')
plt.title('How2matplotlib.com: Contour Plot with Different Colormaps')
plt.xlabel('X-axis')
plt.ylabel('Y-axis')
plt.show()
Output:
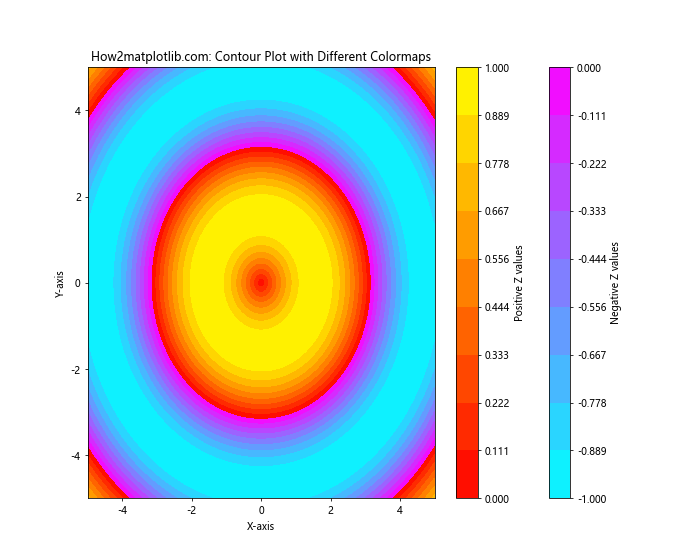
在这个例子中,我们为负值和正值分别创建了两个填充等高线图,使用不同的颜色映射。
9. 添加自定义图例
有时,我们可能想要添加一个更传统的图例,而不是使用颜色条。这可以通过创建代理艺术家(proxy artists)来实现。
import numpy as np
import matplotlib.pyplot as plt
from matplotlib.lines import Line2D

x = np.linspace(-5, 5, 100)
y = np.linspace(-5, 5, 100)
X, Y = np.meshgrid(x, y)
Z = np.sin(np.sqrt(X**2 + Y**2))

plt.figure(figsize=(10, 8))
levels = [-0.5, 0, 0.5]
colors = ['blue', 'green', 'red']
linestyles = ['dashed', 'solid', 'dotted']
contour = plt.contour(X, Y, Z, levels=levels, colors=colors, linestyles=linestyles)

# 创建代理艺术家
legend_elements = [Line2D([0], [0], color=c, linestyle=ls, label=f'Level {l}')
                   for c, ls, l in zip(colors, linestyles, levels)]

plt.legend(handles=legend_elements, title='Contour Levels')
plt.title('How2matplotlib.com: Contour Plot with Custom Legend')
plt.xlabel('X-axis')
plt.ylabel('Y-axis')
plt.show()
Output:
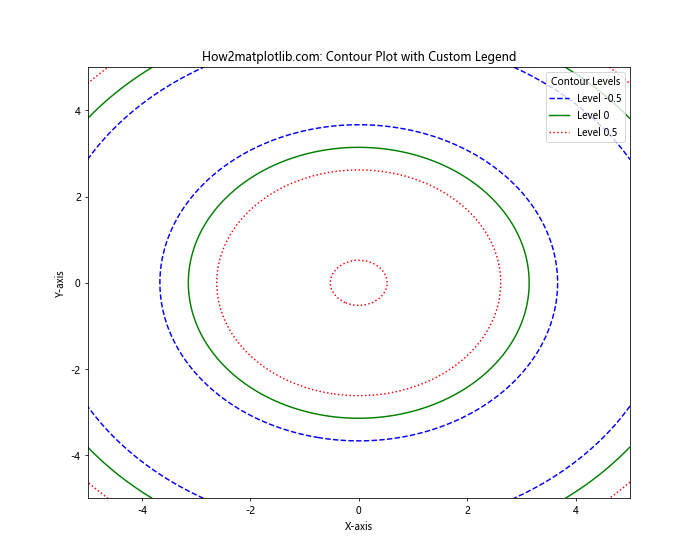
在这个例子中,我们为每个等高线级别创建了一个Line2D对象作为代理艺术家,然后使用这些对象创建了一个自定义图例。
10. 在3D图中创建等高线图
我们还可以在3D图中创建等高线图,这可以提供更直观的数据表示。
import numpy as np
import matplotlib.pyplot as plt
from mpl_toolkits.mplot3d import Axes3D

x = np.linspace(-5, 5, 100)
y = np.linspace(-5, 5, 100)
X, Y = np.meshgrid(x, y)
Z = np.sin(np.sqrt(X**2 + Y**2))

fig = plt.figure(figsize=(12, 8))
ax = fig.add_subplot(111, projection='3d')

# 创建3D表面图
surf = ax.plot_surface(X, Y, Z, cmap='viridis', alpha=0.7)

# 添加等高线
contour = ax.contour(X, Y, Z, zdir='z', offset=-1, cmap='coolwarm')

# 添加颜色条
fig.colorbar(surf, shrink=0.5, aspect=5, label='Z values')

ax.set_title('How2matplotlib.com: 3D Surface with Contour Plot')
ax.set_xlabel('X-axis')
ax.set_ylabel('Y-axis')
ax.set_zlabel('Z-axis')
plt.show()
Output:
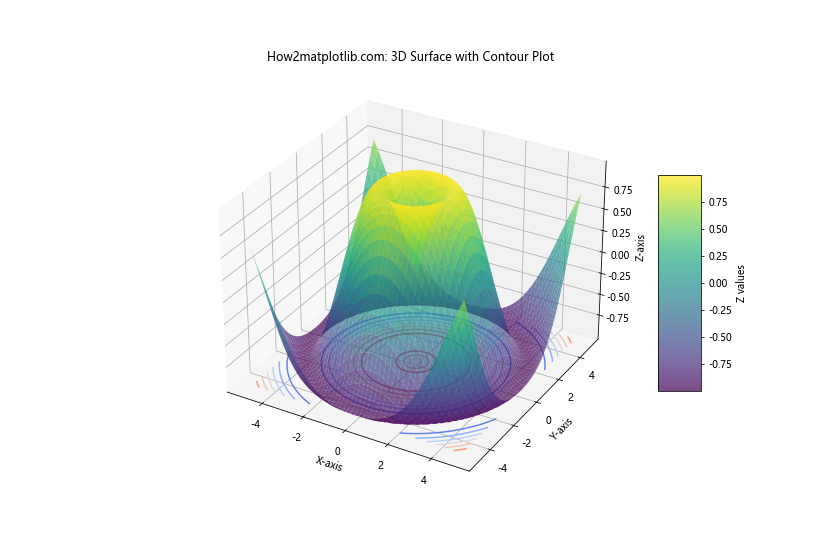
这个例子创建了一个3D表面图,并在其底部添加了一个等高线图。
11. 使用不同的颜色映射
Matplotlib提供了多种内置的颜色映射,我们可以根据数据的特性选择最合适的一种。
import numpy as np
import matplotlib.pyplot as plt

x = np.linspace(-5, 5, 100)
y = np.linspace(-5, 5, 100)
X, Y = np.meshgrid(x, y)
Z = np.sin(np.sqrt(X**2 + Y**2))

fig, (ax1, ax2) = plt.subplots(1, 2, figsize=(16, 6))

contour1 = ax1.contourf(X, Y, Z, levels=20, cmap='viridis')
ax1.set_title('How2matplotlib.com: Viridis Colormap')
plt.colorbar(contour1, ax=ax1, label='Z values')

contour2 = ax2.contourf(X, Y, Z, levels=20, cmap='plasma')
ax2.set_title('How2matplotlib.com: Plasma Colormap')
plt.colorbar(contour2, ax=ax2, label='Z values')

plt.tight_layout()
plt.show()
Output:
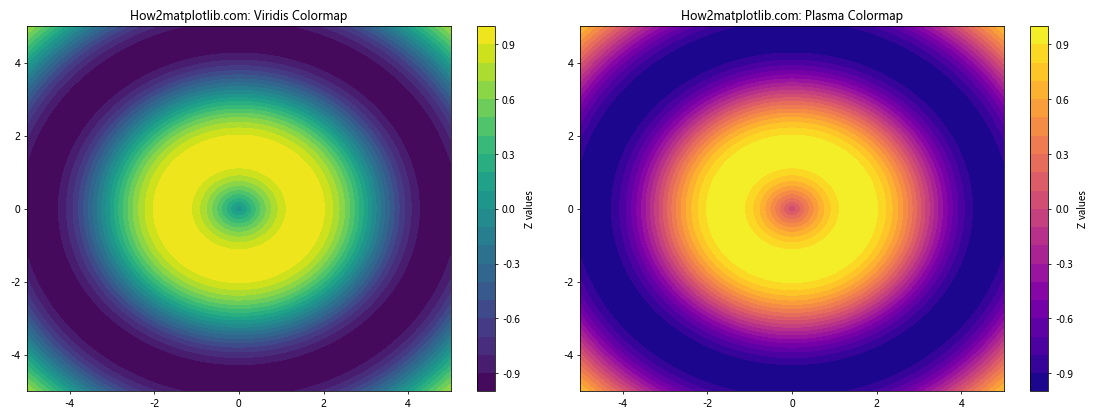
这个例子展示了使用不同颜色映射(viridis和plasma)的等高线图。
12. 添加等高线标签和颜色条
我们可以同时使用等高线标签和颜色条来提供更多信息。
import numpy as np
import matplotlib.pyplot as plt

x = np.linspace(-5, 5, 100)
y = np.linspace(-5, 5, 100)
X, Y = np.meshgrid(x, y)Z = np.sin(np.sqrt(X**2 + Y**2))

plt.figure(figsize=(10, 8))
contour = plt.contour(X, Y, Z, levels=10, cmap='viridis')
plt.clabel(contour, inline=True, fontsize=8)
plt.colorbar(contour, label='Z values')
plt.title('How2matplotlib.com: Contour Plot with Labels and Colorbar')
plt.xlabel('X-axis')
plt.ylabel('Y-axis')
plt.show()
这个例子结合了等高线标签和颜色条,为读者提供了多层次的信息。
13. 使用不规则网格创建等高线图
有时我们的数据可能不在规则的网格上。在这种情况下,我们可以使用tricontour和tricontourf函数。
import numpy as np
import matplotlib.pyplot as plt

# 生成不规则的点
np.random.seed(19680801)
npts = 200
x = np.random.uniform(-2, 2, npts)
y = np.random.uniform(-2, 2, npts)
z = x*np.exp(-x**2 - y**2)

plt.figure(figsize=(10, 8))
contour = plt.tricontourf(x, y, z, levels=20, cmap='RdYlBu_r')
plt.colorbar(contour, label='Z values')
plt.title('How2matplotlib.com: Contour Plot with Irregular Grid')
plt.xlabel('X-axis')
plt.ylabel('Y-axis')
plt.show()
Output:
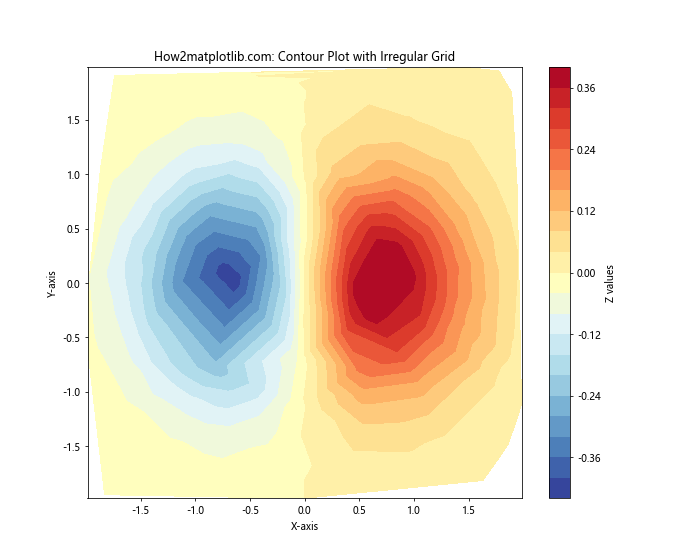
这个例子展示了如何使用不规则分布的数据点创建等高线图。
14. 创建极坐标等高线图
等高线图也可以在极坐标系中创建,这对于某些类型的数据可能更合适。
import numpy as np
import matplotlib.pyplot as plt

r = np.linspace(0, 2, 100)
theta = np.linspace(0, 2*np.pi, 100)
R, Theta = np.meshgrid(r, theta)
Z = R**2 * (1 - R/2) * np.cos(Theta)

fig, ax = plt.subplots(subplot_kw=dict(projection='polar'), figsize=(10, 8))
contour = ax.contourf(Theta, R, Z, levels=20, cmap='viridis')
plt.colorbar(contour, label='Z values')
ax.set_title('How2matplotlib.com: Polar Contour Plot')
plt.show()
Output:
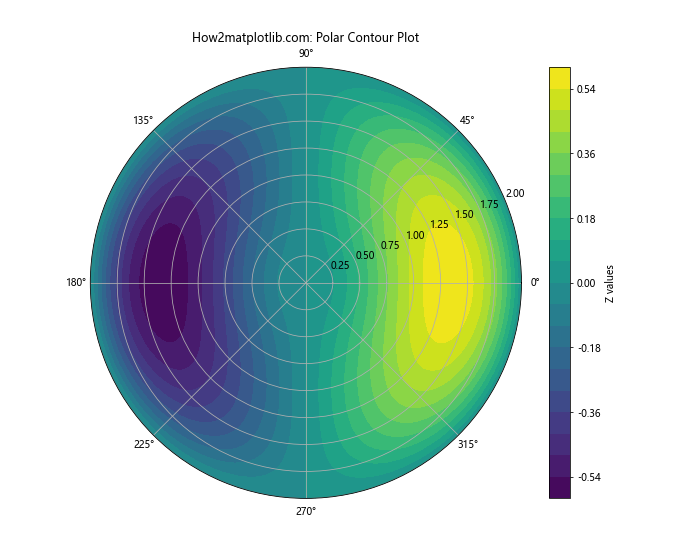
这个例子创建了一个极坐标系下的等高线图。
15. 为等高线图添加文本注释
有时我们可能想在等高线图的特定位置添加文本注释,以突出某些特征。
import numpy as np
import matplotlib.pyplot as plt

x = np.linspace(-5, 5, 100)
y = np.linspace(-5, 5, 100)
X, Y = np.meshgrid(x, y)
Z = np.sin(np.sqrt(X**2 + Y**2))

plt.figure(figsize=(10, 8))
contour = plt.contourf(X, Y, Z, levels=20, cmap='viridis')
plt.colorbar(contour, label='Z values')

# 添加文本注释
plt.text(0, 0, 'Center', fontsize=12, ha='center', va='center', bbox=dict(facecolor='white', alpha=0.7))
plt.text(4, 4, 'Corner', fontsize=12, ha='center', va='center', bbox=dict(facecolor='white', alpha=0.7))

plt.title('How2matplotlib.com: Contour Plot with Text Annotations')
plt.xlabel('X-axis')
plt.ylabel('Y-axis')
plt.show()
Output:
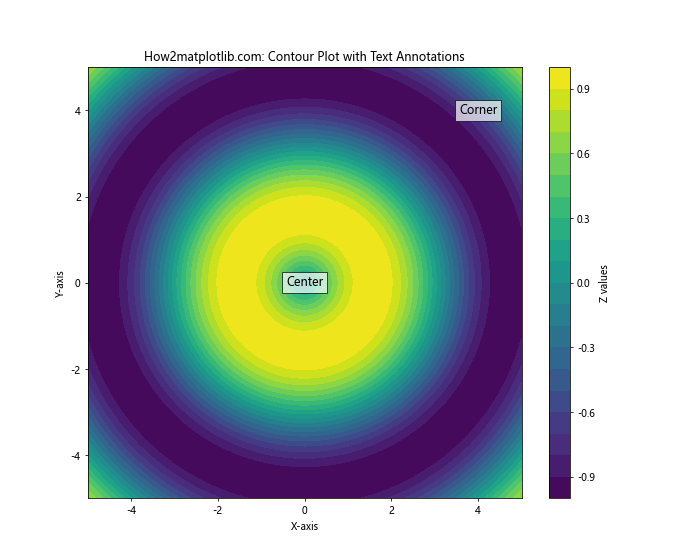
这个例子在等高线图的中心和一个角落添加了文本注释。
16. 创建带有掩码的等高线图
有时我们可能想要排除某些区域的数据。这可以通过使用掩码数组来实现。
import numpy as np
import matplotlib.pyplot as plt

x = np.linspace(-5, 5, 100)
y = np.linspace(-5, 5, 100)
X, Y = np.meshgrid(x, y)
Z = np.sin(np.sqrt(X**2 + Y**2))

# 创建掩码
mask = np.sqrt(X**2 + Y**2) > 4
Z_masked = np.ma.array(Z, mask=mask)

plt.figure(figsize=(10, 8))
contour = plt.contourf(X, Y, Z_masked, levels=20, cmap='viridis')
plt.colorbar(contour, label='Z values')
plt.title('How2matplotlib.com: Masked Contour Plot')
plt.xlabel('X-axis')
plt.ylabel('Y-axis')
plt.show()
Output:
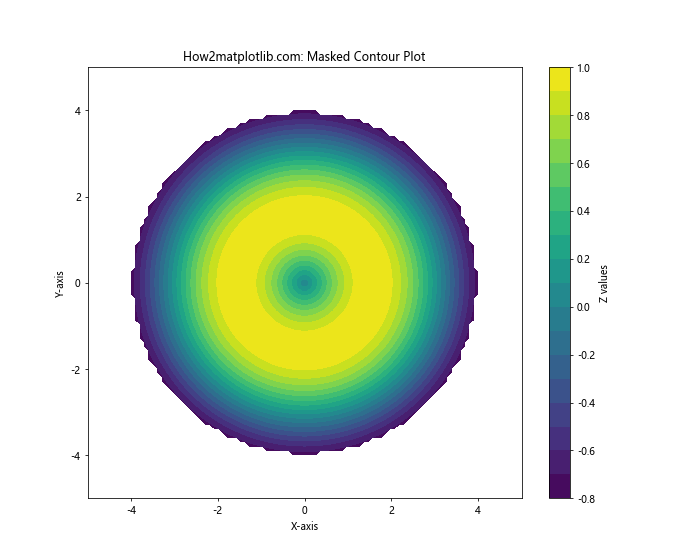
这个例子创建了一个带有圆形掩码的等高线图,中心区域以外的数据被排除。
17. 使用不同的插值方法
Matplotlib提供了多种插值方法来平滑等高线。我们可以尝试不同的方法来找到最适合我们数据的一种。
import numpy as np
import matplotlib.pyplot as plt

x = np.linspace(-5, 5, 20)
y = np.linspace(-5, 5, 20)
X, Y = np.meshgrid(x, y)
Z = np.sin(np.sqrt(X**2 + Y**2))

fig, (ax1, ax2) = plt.subplots(1, 2, figsize=(16, 6))

contour1 = ax1.contourf(X, Y, Z, levels=20, cmap='viridis')
ax1.set_title('How2matplotlib.com: Default Interpolation')
plt.colorbar(contour1, ax=ax1, label='Z values')

contour2 = ax2.contourf(X, Y, Z, levels=20, cmap='viridis', interpolation='cubic')
ax2.set_title('How2matplotlib.com: Cubic Interpolation')
plt.colorbar(contour2, ax=ax2, label='Z values')

plt.tight_layout()
plt.show()
Output:
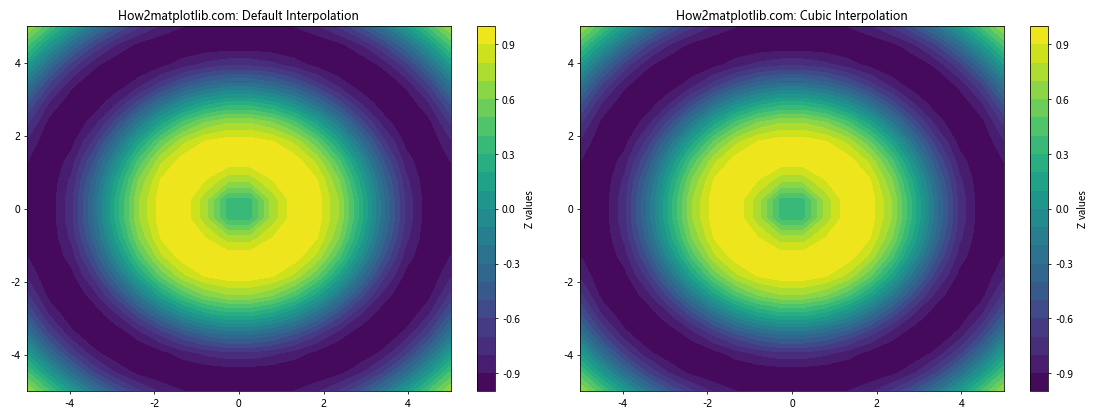
这个例子比较了默认插值方法和三次插值方法的效果。
结论
在Matplotlib中为等高线图创建图例是一个强大而灵活的过程。从简单的颜色条到复杂的自定义图例,我们有多种选择来增强等高线图的可读性和信息量。关键是要根据数据的特性和目标受众选择最合适的图例类型和样式。
通过本文介绍的各种技术,你应该能够为各种类型的等高线图创建清晰、信息丰富的图例。记住,好的图例不仅能帮助读者理解数据,还能突出数据中的重要特征和模式。
在实际应用中,可能需要结合多种技术来创建最佳的可视化效果。不要害怕尝试不同的方法,并根据具体需求进行调整。随着练习和经验的积累,你将能够轻松地为等高线图创建出既美观又实用的图例。
最后,始终牢记数据可视化的目标是有效地传达信息。无论你选择哪种方法来创建图例,都要确保它能够清晰地传达你想要表达的信息,并帮助读者更好地理解你的数据。
 极客教程
极客教程