如何使用Python创建圆形条形图:Matplotlib详解
参考:Circular Bar Plot in Python
圆形条形图是一种独特而引人注目的数据可视化方式,它将传统的条形图弯曲成一个圆形,使得数据展示更加紧凑和美观。本文将详细介绍如何使用Python的Matplotlib库创建圆形条形图,从基础概念到高级技巧,全面覆盖这一主题。
1. 圆形条形图的基本概念
圆形条形图,也称为极坐标条形图或放射状条形图,是将传统的直角坐标系条形图转换为极坐标系的一种图表。在这种图表中,数据值由从圆心向外延伸的”条”来表示,而类别则沿着圆周分布。
圆形条形图的主要优势包括:
- 空间利用效率高,特别适合展示大量分类数据
- 视觉上更加吸引人,能够有效地吸引观众注意力
- 适合展示周期性或循环性数据,如一年中各月份的数据
让我们从一个简单的例子开始,了解如何创建基本的圆形条形图:
import numpy as np
import matplotlib.pyplot as plt

# 准备数据
categories = ['A', 'B', 'C', 'D', 'E']
values = [23, 17, 35, 29, 12]

# 计算角度
angles = np.linspace(0, 2*np.pi, len(categories), endpoint=False)

# 创建图形和极坐标子图
fig, ax = plt.subplots(figsize=(8, 8), subplot_kw=dict(projection='polar'))

# 绘制条形
bars = ax.bar(angles, values, width=0.5, bottom=0.0, alpha=0.5)

# 设置刻度标签
ax.set_xticks(angles)
ax.set_xticklabels(categories)

# 添加标题
ax.set_title('Basic Circular Bar Plot - how2matplotlib.com', fontweight='bold')

plt.show()
Output:
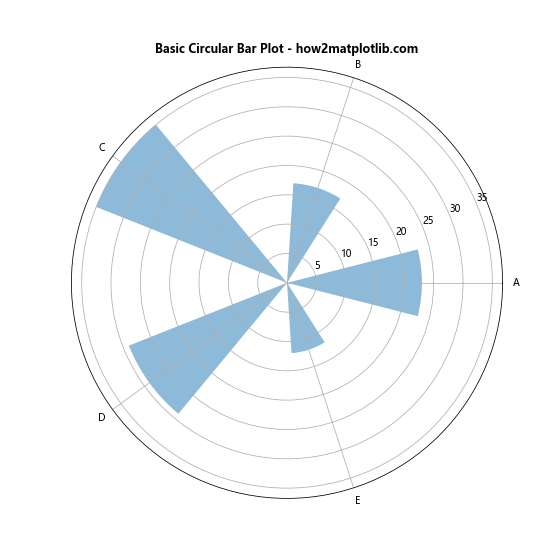
在这个例子中,我们使用np.linspace()函数创建均匀分布的角度,然后使用Matplotlib的极坐标子图和bar()函数来绘制圆形条形图。
2. 自定义颜色和样式
为了使圆形条形图更加吸引人,我们可以自定义条形的颜色和样式。以下是一个更加丰富多彩的例子:
import numpy as np
import matplotlib.pyplot as plt

# 准备数据
categories = ['Jan', 'Feb', 'Mar', 'Apr', 'May', 'Jun', 'Jul', 'Aug', 'Sep', 'Oct', 'Nov', 'Dec']
values = [4, 7, 12, 18, 23, 27, 29, 28, 24, 17, 10, 5]

# 计算角度
angles = np.linspace(0, 2*np.pi, len(categories), endpoint=False)

# 创建颜色映射
cmap = plt.get_cmap('hsv')
colors = [cmap(i) for i in np.linspace(0, 1, len(categories))]

# 创建图形和极坐标子图
fig, ax = plt.subplots(figsize=(10, 10), subplot_kw=dict(projection='polar'))

# 绘制条形
bars = ax.bar(angles, values, width=0.5, bottom=0.0, color=colors, alpha=0.8)

# 设置刻度标签
ax.set_xticks(angles)
ax.set_xticklabels(categories)

# 添加网格线
ax.grid(True)

# 设置y轴范围
ax.set_ylim(0, 30)

# 添加标题
ax.set_title('Colorful Circular Bar Plot - how2matplotlib.com', fontweight='bold')

plt.show()
Output:
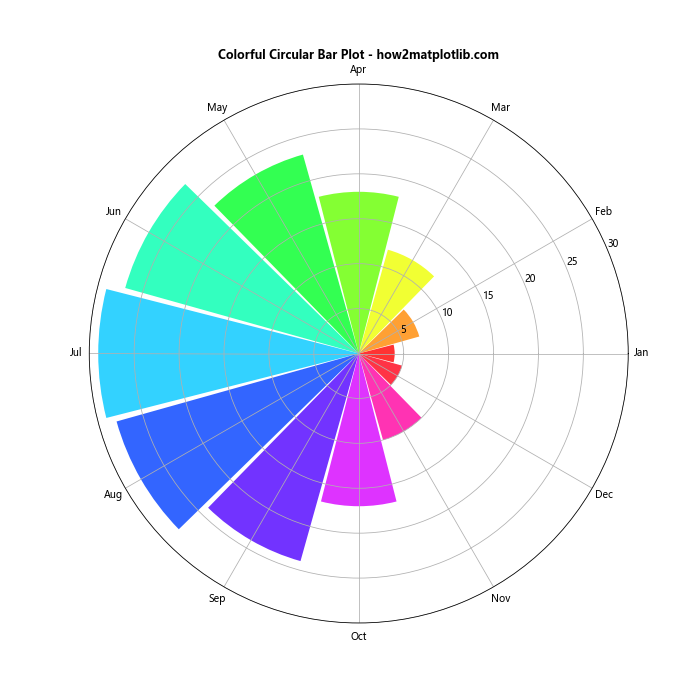
在这个例子中,我们使用了plt.get_cmap()函数来创建一个颜色映射,并为每个条形分配不同的颜色。我们还添加了网格线并设置了y轴的范围,使图表更加清晰。
3. 添加数值标签
为了使圆形条形图更加信息丰富,我们可以在每个条形上添加数值标签。以下是如何实现这一点:
import numpy as np
import matplotlib.pyplot as plt

# 准备数据
categories = ['A', 'B', 'C', 'D', 'E', 'F']
values = [25, 40, 30, 55, 45, 35]

# 计算角度
angles = np.linspace(0, 2*np.pi, len(categories), endpoint=False)

# 创建图形和极坐标子图
fig, ax = plt.subplots(figsize=(10, 10), subplot_kw=dict(projection='polar'))

# 绘制条形
bars = ax.bar(angles, values, width=0.5, bottom=0.0, alpha=0.5)

# 设置刻度标签
ax.set_xticks(angles)
ax.set_xticklabels(categories)

# 添加数值标签
for angle, value in zip(angles, values):
    ax.text(angle, value, f'{value}', ha='center', va='bottom')

# 设置y轴范围
ax.set_ylim(0, 60)

# 添加标题
ax.set_title('Circular Bar Plot with Value Labels - how2matplotlib.com', fontweight='bold')

plt.show()
Output:
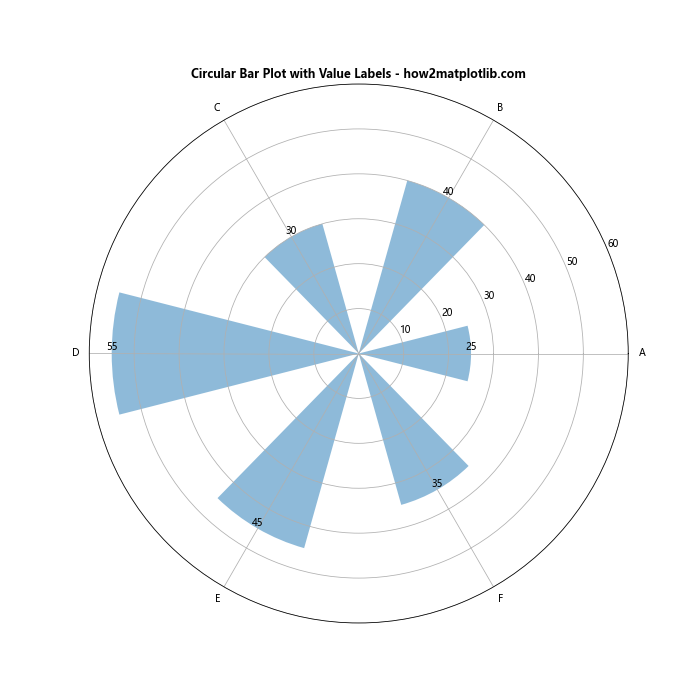
在这个例子中,我们使用ax.text()函数在每个条形的顶部添加了数值标签。通过调整ha(水平对齐)和va(垂直对齐)参数,我们可以精确控制标签的位置。
4. 创建堆叠圆形条形图
堆叠圆形条形图允许我们在同一个图表中展示多个相关的数据系列。以下是一个创建堆叠圆形条形图的例子:
import numpy as np
import matplotlib.pyplot as plt

# 准备数据
categories = ['A', 'B', 'C', 'D', 'E']
values1 = [20, 30, 25, 35, 27]
values2 = [15, 12, 19, 21, 17]
values3 = [10, 8, 11, 13, 9]

# 计算角度
angles = np.linspace(0, 2*np.pi, len(categories), endpoint=False)

# 创建图形和极坐标子图
fig, ax = plt.subplots(figsize=(10, 10), subplot_kw=dict(projection='polar'))

# 绘制堆叠条形
bars1 = ax.bar(angles, values1, width=0.5, bottom=0.0, alpha=0.5, label='Series 1')
bars2 = ax.bar(angles, values2, width=0.5, bottom=values1, alpha=0.5, label='Series 2')
bars3 = ax.bar(angles, values3, width=0.5, bottom=[i+j for i,j in zip(values1, values2)], alpha=0.5, label='Series 3')

# 设置刻度标签
ax.set_xticks(angles)
ax.set_xticklabels(categories)

# 添加图例
ax.legend(loc='upper right', bbox_to_anchor=(1.3, 1.0))

# 设置y轴范围
ax.set_ylim(0, 80)

# 添加标题
ax.set_title('Stacked Circular Bar Plot - how2matplotlib.com', fontweight='bold')

plt.show()
Output:
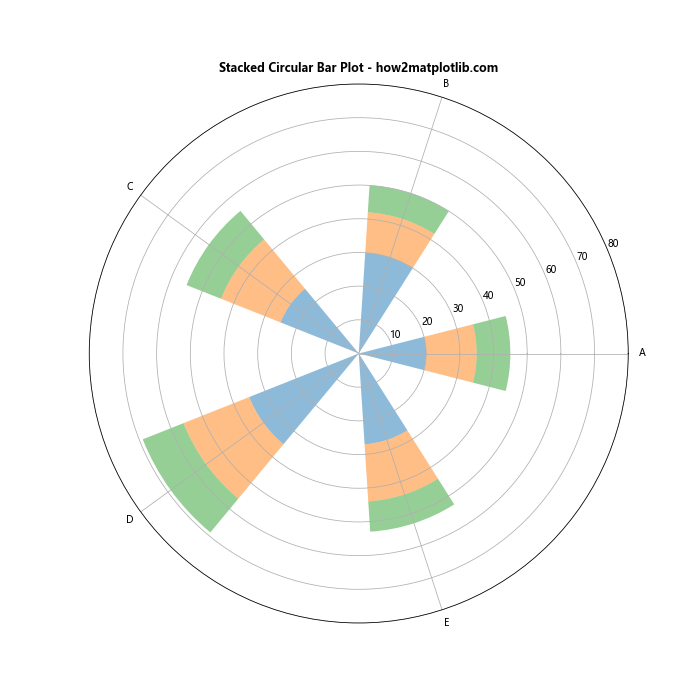
在这个例子中,我们使用多次调用ax.bar()函数来创建堆叠的条形。通过设置bottom参数,我们可以控制每个系列的起始位置。我们还添加了一个图例来区分不同的数据系列。
5. 创建分组圆形条形图
分组圆形条形图允许我们并排比较多个数据系列。以下是如何创建分组圆形条形图:
import numpy as np
import matplotlib.pyplot as plt

# 准备数据
categories = ['A', 'B', 'C', 'D', 'E']
values1 = [20, 30, 25, 35, 27]
values2 = [15, 25, 22, 30, 20]

# 计算角度
angles = np.linspace(0, 2*np.pi, len(categories), endpoint=False)

# 创建图形和极坐标子图
fig, ax = plt.subplots(figsize=(10, 10), subplot_kw=dict(projection='polar'))

# 计算条形宽度
width = 0.4

# 绘制分组条形
bars1 = ax.bar(angles, values1, width=width, bottom=0.0, alpha=0.5, label='Series 1')
bars2 = ax.bar(angles + width, values2, width=width, bottom=0.0, alpha=0.5, label='Series 2')

# 设置刻度标签
ax.set_xticks(angles + width / 2)
ax.set_xticklabels(categories)

# 添加图例
ax.legend(loc='upper right', bbox_to_anchor=(1.3, 1.0))

# 设置y轴范围
ax.set_ylim(0, 40)

# 添加标题
ax.set_title('Grouped Circular Bar Plot - how2matplotlib.com', fontweight='bold')

plt.show()
Output:
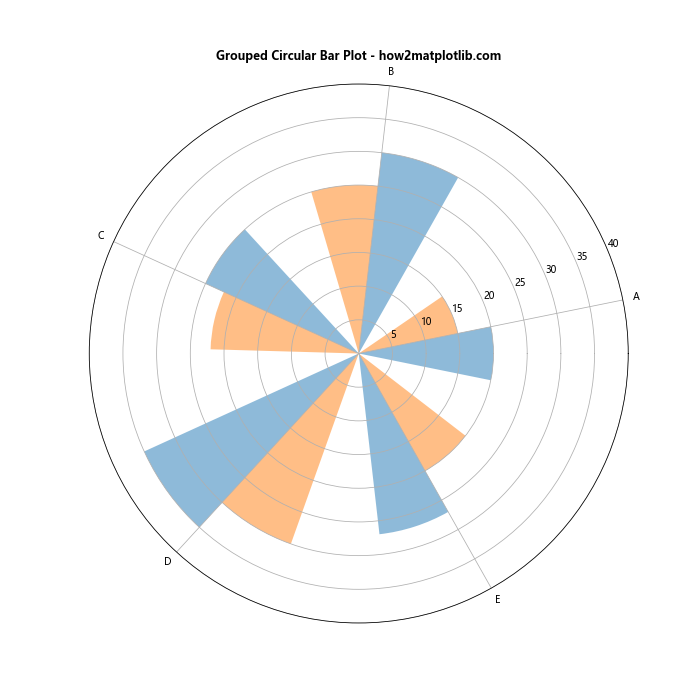
在这个例子中,我们通过调整每个系列的角度位置(angles和angles + width)来创建分组效果。我们还调整了刻度标签的位置,使其位于每组条形的中间。
6. 添加径向网格线
为了提高圆形条形图的可读性,我们可以添加径向网格线。以下是如何实现:
import numpy as np
import matplotlib.pyplot as plt

# 准备数据
categories = ['A', 'B', 'C', 'D', 'E', 'F', 'G', 'H']
values = [30, 45, 60, 35, 50, 40, 55, 25]

# 计算角度
angles = np.linspace(0, 2*np.pi, len(categories), endpoint=False)

# 创建图形和极坐标子图
fig, ax = plt.subplots(figsize=(10, 10), subplot_kw=dict(projection='polar'))

# 绘制条形
bars = ax.bar(angles, values, width=0.7, bottom=0.0, alpha=0.5)

# 设置刻度标签
ax.set_xticks(angles)
ax.set_xticklabels(categories)

# 添加径向网格线
ax.set_yticks(np.arange(20, 70, 10))
ax.set_yticklabels(np.arange(20, 70, 10))
ax.set_rlabel_position(0)

# 设置y轴范围
ax.set_ylim(0, 70)

# 添加标题
ax.set_title('Circular Bar Plot with Radial Grid - how2matplotlib.com', fontweight='bold')

plt.show()
Output:
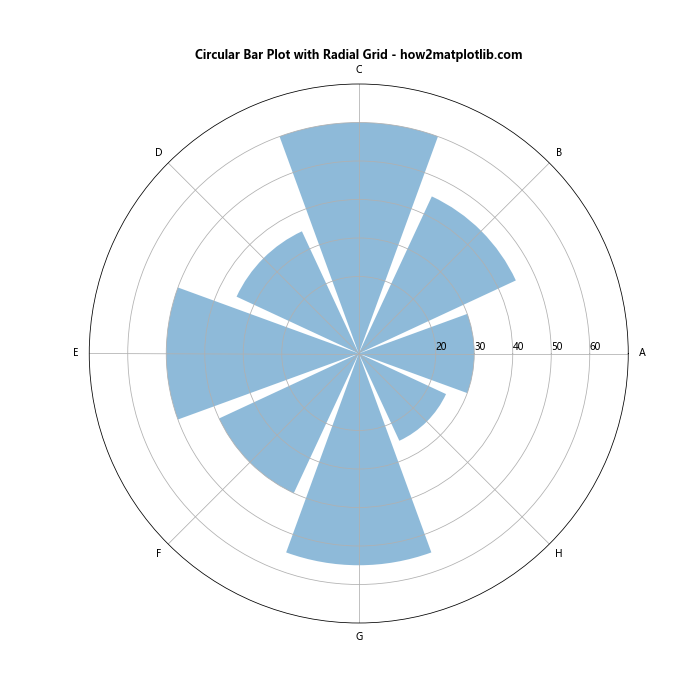
在这个例子中,我们使用ax.set_yticks()和ax.set_yticklabels()函数来添加和标记径向网格线。ax.set_rlabel_position()函数用于设置径向标签的位置。
7. 创建双向圆形条形图
双向圆形条形图可以用来比较两组相关的数据,例如正面和负面的评价。以下是如何创建双向圆形条形图:
import numpy as np
import matplotlib.pyplot as plt

# 准备数据
categories = ['A', 'B', 'C', 'D', 'E', 'F']
positive_values = [30, 25, 40, 35, 50, 45]
negative_values = [-20, -15, -30, -25, -40, -35]

# 计算角度
angles = np.linspace(0, 2*np.pi, len(categories), endpoint=False)

# 创建图形和极坐标子图
fig, ax = plt.subplots(figsize=(10, 10), subplot_kw=dict(projection='polar'))

# 绘制正面条形
bars1 = ax.bar(angles, positive_values, width=0.5, bottom=0.0, alpha=0.5, color='g', label='Positive')

# 绘制负面条形
bars2 = ax.bar(angles, negative_values, width=0.5, bottom=0.0, alpha=0.5, color='r', label='Negative')

# 设置刻度标签
ax.set_xticks(angles)
ax.set_xticklabels(categories)

# 添加图例
ax.legend(loc='upper right', bbox_to_anchor=(1.3, 1.0))

# 设置y轴范围
ax.set_ylim(-50, 50)

# 添加标题
ax.set_title('Bidirectional Circular Bar Plot - how2matplotlib.com', fontweight='bold')

plt.show()
Output:
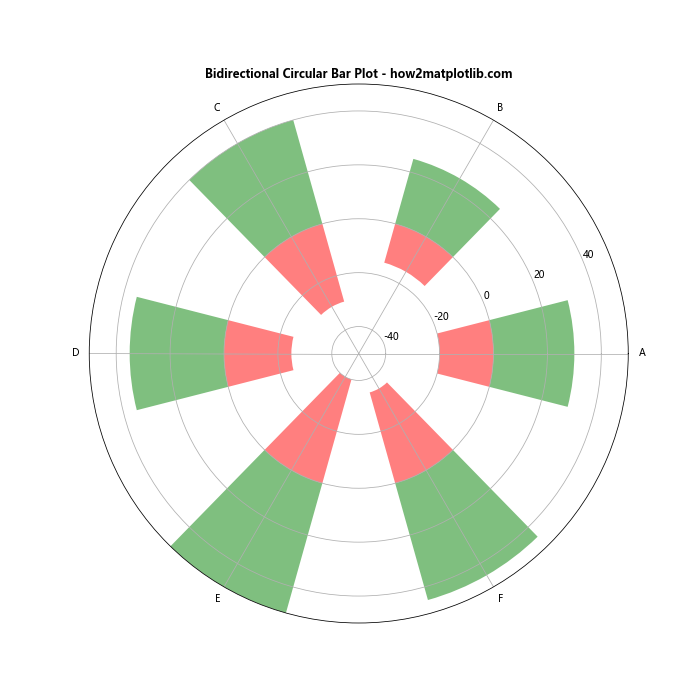
在这个例子中,我们分别绘制了正面和负面的条形,使用不同的颜色来区分。通过设置适当的y轴范围,我们可以使正负条形分别向外和向内延伸。
8. 添加动态效果
为了使圆形条形图更加生动,我们可以添加一些动态效果。以下是一个简单的动画示例:
import numpy as np
import matplotlib.pyplot as plt
from matplotlib.animation import FuncAnimation

# 准备数据
categories = ['A', 'B', 'C', 'D', 'E']
values = [30, 45, 60, 35, 50]

# 计算角度
angles = np.linspace(0, 2*np.pi, len(categories), endpoint=False)

# 创建图形和极坐标子图
fig, ax = plt.subplots(figsize=(10, 10), subplot_kw=dict(projection='polar'))

# 初始化条形
bars = ax.bar(angles, [0]*len(categories), width=0.5, bottom=0.0, alpha=0.5)

# 设置刻度标签
ax.set_xticks(angles)
ax.set_xticklabels(categories)

# 设置y轴范围
ax.set_ylim(0, 70)

# 添加标题
ax.set_title('Animated Circular Bar Plot - how2matplotlib.com', fontweight='bold')

# 定义动画更新函数
def update(frame):
    for bar, value in zip(bars, values):
        bar.set_height(value * frame / 100)
    return bars

# 创建动画
anim = FuncAnimation(fig, update, frames=np.linspace(0, 100, 50), interval=50, blit=True)

plt.show()
Output:
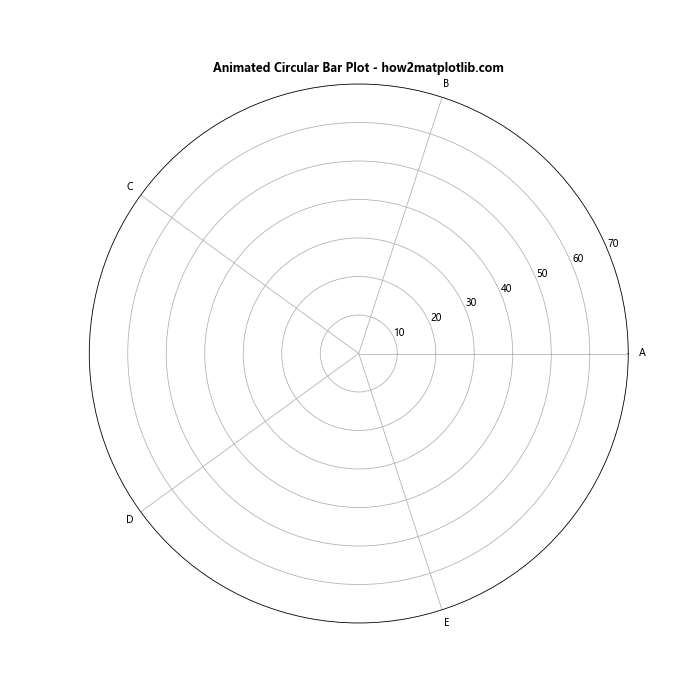
在这个例子中,我们使用matplotlib.animation.FuncAnimation来创建一个简单的动画效果。条形会从零逐渐增长到最终高度,创造出一种生动的展示效果。
9. 自定义标签位置和样式
为了进一步提高圆形条形图的可读性和美观度,我们可以自定义标签的位置和样式。以下是一个示例:
import numpy as np
import matplotlib.pyplot as plt

# 准备数据
categories = ['Category A', 'Category B', 'Category C', 'Category D', 'Category E', 'Category F']
values = [35, 47, 52, 40, 58, 45]

# 计算角度
angles = np.linspace(0, 2*np.pi, len(categories), endpoint=False)

# 创建图形和极坐标子图
fig, ax = plt.subplots(figsize=(12, 12), subplot_kw=dict(projection='polar'))

# 绘制条形
bars = ax.bar(angles, values, width=0.5, bottom=0.0, alpha=0.5)

# 自定义标签位置和样式
for angle, value, category in zip(angles, values, categories):
    # 计算标签位置
    x = angle
    y = value + 5  # 在条形顶部上方添加一些空间

    # 旋转标签以保持可读性
    rotation = np.degrees(angle)
    if angle > np.pi/2 and angle < 3*np.pi/2:
        rotation += 180

    ax.text(x, y, f'{category}\n{value}', ha='center', va='center', rotation=rotation, fontweight='bold')

# 移除默认的刻度标签
ax.set_xticks([])

# 设置y轴范围
ax.set_ylim(0, 70)

# 添加标题
ax.set_title('Circular Bar Plot with Custom Labels - how2matplotlib.com', fontweight='bold', pad=20)

plt.show()
Output:
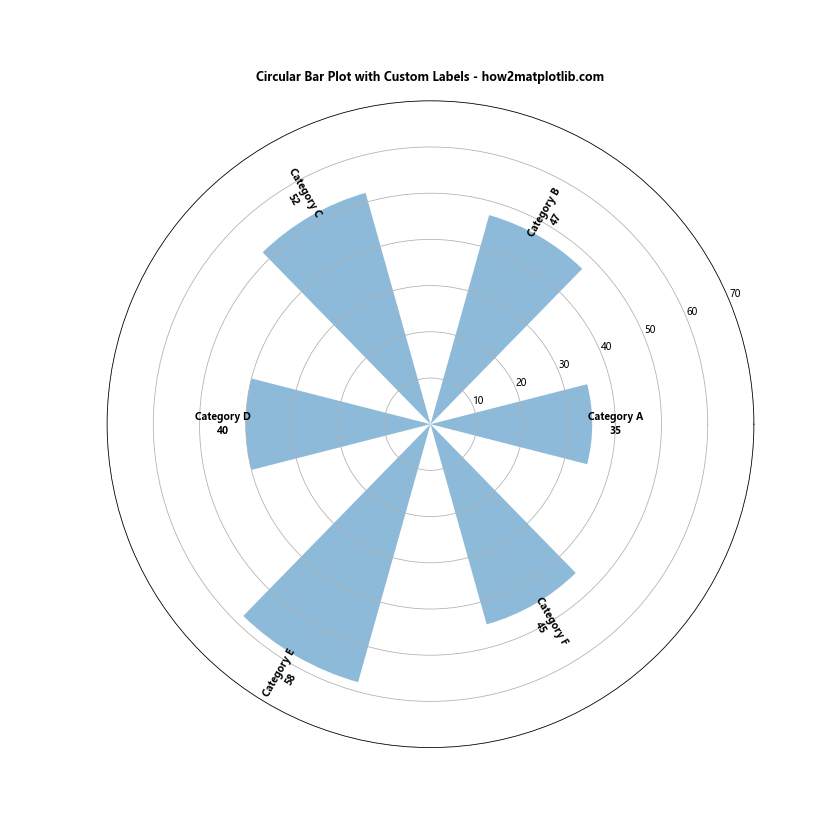
在这个例子中,我们使用ax.text()函数来自定义每个类别的标签位置和样式。我们计算了适当的角度来旋转标签,确保它们始终保持可读性。同时,我们移除了默认的刻度标签,使图表看起来更加整洁。
10. 添加背景色和边框
为了使圆形条形图更加突出,我们可以添加背景色和边框。以下是一个示例:
import numpy as np
import matplotlib.pyplot as plt

# 准备数据
categories = ['A', 'B', 'C', 'D', 'E', 'F', 'G', 'H']
values = [30, 45, 60, 35, 50, 40, 55, 25]

# 计算角度
angles = np.linspace(0, 2*np.pi, len(categories), endpoint=False)

# 创建图形和极坐标子图
fig, ax = plt.subplots(figsize=(12, 12), subplot_kw=dict(projection='polar'))

# 设置背景色
ax.set_facecolor('#f0f0f0')

# 绘制条形
bars = ax.bar(angles, values, width=0.7, bottom=0.0, alpha=0.8, color='skyblue', edgecolor='navy')

# 设置刻度标签
ax.set_xticks(angles)
ax.set_xticklabels(categories, fontweight='bold')

# 添加径向网格线
ax.set_yticks(np.arange(20, 70, 10))
ax.set_yticklabels(np.arange(20, 70, 10))
ax.set_rlabel_position(0)

# 设置y轴范围
ax.set_ylim(0, 70)

# 添加边框
ax.spines['polar'].set_visible(True)
ax.spines['polar'].set_color('gray')
ax.spines['polar'].set_linewidth(2)

# 添加标题
ax.set_title('Circular Bar Plot with Background and Border - how2matplotlib.com', fontweight='bold', pad=20)

plt.show()
Output:
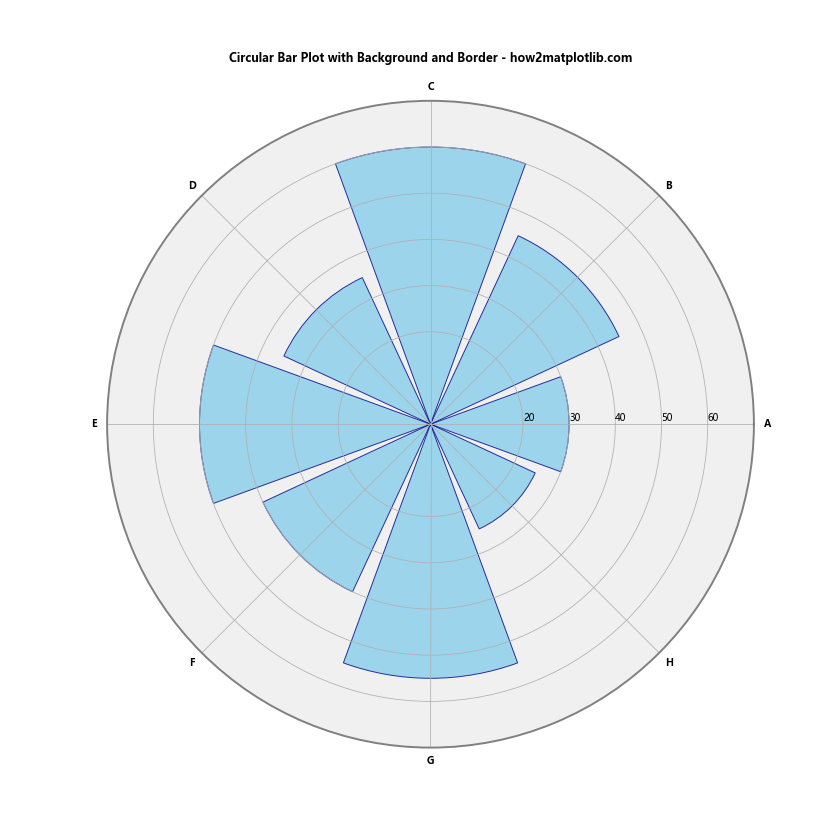
在这个例子中,我们使用ax.set_facecolor()函数设置了背景色,并通过设置条形的edgecolor参数来添加边框。我们还使用ax.spines['polar'].set_visible(True)来显示极坐标图的外圈边框,并自定义了其颜色和线宽。
11. 创建多层圆形条形图
多层圆形条形图可以用来展示更复杂的数据结构,例如层次化的类别数据。以下是一个创建多层圆形条形图的示例:
import numpy as np
import matplotlib.pyplot as plt

# 准备数据
categories = ['A', 'B', 'C', 'D']
subcategories = ['A1', 'A2', 'A3', 'B1', 'B2', 'C1', 'C2', 'C3', 'D1', 'D2']
values = [20, 15, 10, 25, 20, 30, 25, 15, 35, 30]

# 计算角度
main_angles = np.linspace(0, 2*np.pi, len(categories), endpoint=False)
sub_angles = np.linspace(0, 2*np.pi, len(subcategories), endpoint=False)

# 创建图形和极坐标子图
fig, ax = plt.subplots(figsize=(12, 12), subplot_kw=dict(projection='polar'))

# 绘制外层条形
outer_bars = ax.bar(main_angles, [max(values[i:i+3]) for i in range(0, len(values), 3)], width=0.8, bottom=40, alpha=0.3)

# 绘制内层条形
inner_bars = ax.bar(sub_angles, values, width=0.3, bottom=20, alpha=0.8)

# 设置刻度标签
ax.set_xticks(main_angles)
ax.set_xticklabels(categories, fontweight='bold')

# 添加子类别标签
for angle, subcategory in zip(sub_angles, subcategories):
    ax.text(angle, 15, subcategory, ha='center', va='center', fontsize=8)

# 设置y轴范围
ax.set_ylim(0, 100)

# 移除径向刻度
ax.set_yticks([])

# 添加标题
ax.set_title('Multi-layer Circular Bar Plot - how2matplotlib.com', fontweight='bold', pad=20)

plt.show()
Output:
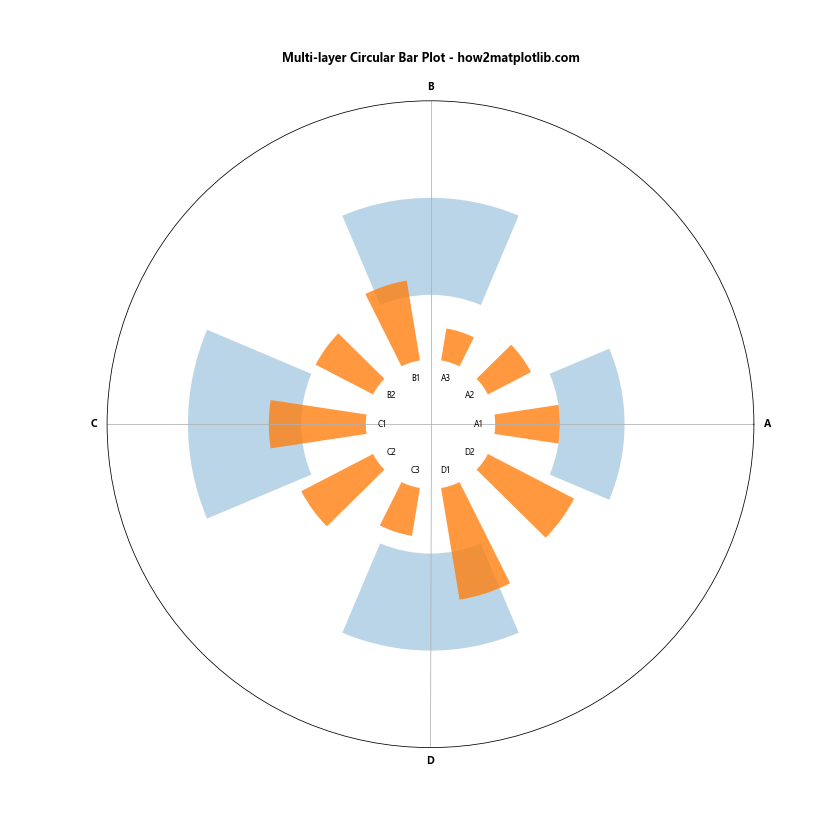
在这个例子中,我们创建了两层条形:外层代表主类别,内层代表子类别。通过调整条形的bottom参数,我们可以控制每层的起始位置。我们还在图表的内圈添加了子类别的标签。
12. 添加交互性
为了使圆形条形图更具交互性,我们可以添加鼠标悬停效果。以下是一个使用mpld3库来实现交互效果的示例:
import numpy as np
import matplotlib.pyplot as plt
import mpld3

# 准备数据
categories = ['A', 'B', 'C', 'D', 'E', 'F']
values = [30, 45, 60, 35, 50, 40]

# 计算角度
angles = np.linspace(0, 2*np.pi, len(categories), endpoint=False)

# 创建图形和极坐标子图
fig, ax = plt.subplots(figsize=(10, 10), subplot_kw=dict(projection='polar'))

# 绘制条形
bars = ax.bar(angles, values, width=0.5, bottom=0.0, alpha=0.5)

# 设置刻度标签
ax.set_xticks(angles)
ax.set_xticklabels(categories)

# 设置y轴范围
ax.set_ylim(0, 70)

# 添加标题
ax.set_title('Interactive Circular Bar Plot - how2matplotlib.com', fontweight='bold')

# 添加交互性
tooltip = mpld3.plugins.PointLabelTooltip(bars, labels=[f'{c}: {v}' for c, v in zip(categories, values)])
mpld3.plugins.connect(fig, tooltip)

# 显示交互图
mpld3.show()
在这个例子中,我们使用mpld3库来为条形添加鼠标悬停效果。当用户将鼠标悬停在条形上时,会显示相应的类别和值。
13. 结合其他图表类型
圆形条形图可以与其他类型的图表结合,创造出更丰富的数据可视化效果。以下是一个将圆形条形图与饼图结合的示例:
import numpy as np
import matplotlib.pyplot as plt

# 准备数据
categories = ['A', 'B', 'C', 'D', 'E']
values1 = [30, 45, 60, 35, 50]
values2 = [20, 25, 15, 30, 10]

# 计算角度
angles = np.linspace(0, 2*np.pi, len(categories), endpoint=False)

# 创建图形和子图
fig, (ax1, ax2) = plt.subplots(1, 2, figsize=(20, 10), subplot_kw=dict(projection='polar'))

# 绘制圆形条形图
bars = ax1.bar(angles, values1, width=0.5, bottom=0.0, alpha=0.5)
ax1.set_xticks(angles)
ax1.set_xticklabels(categories)
ax1.set_ylim(0, 70)
ax1.set_title('Circular Bar Plot - how2matplotlib.com', fontweight='bold')

# 绘制饼图
ax2.pie(values2, labels=categories, autopct='%1.1f%%', startangle=90)
ax2.set_title('Pie Chart - how2matplotlib.com', fontweight='bold')

plt.tight_layout()
plt.show()
Output:
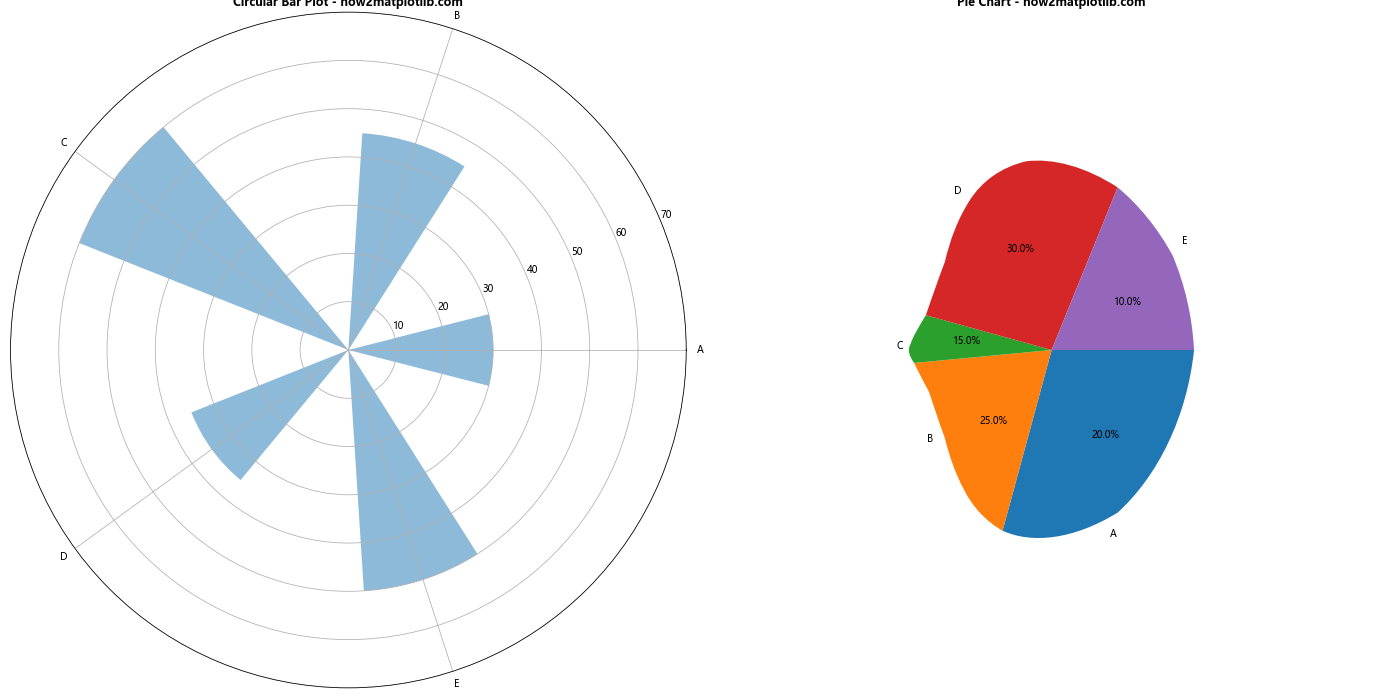
在这个例子中,我们在同一个图形中创建了两个子图:一个圆形条形图和一个饼图。这种组合可以帮助我们从不同角度展示相关的数据集。
14. 使用极坐标散点图增强圆形条形图
我们可以在圆形条形图的基础上添加极坐标散点图,以展示更多维度的数据。以下是一个示例:
import numpy as np
import matplotlib.pyplot as plt

# 准备数据
categories = ['A', 'B', 'C', 'D', 'E', 'F']
values1 = [30, 45, 60, 35, 50, 40]
values2 = [20, 30, 40, 25, 35, 30]

# 计算角度
angles = np.linspace(0, 2*np.pi, len(categories), endpoint=False)

# 创建图形和极坐标子图
fig, ax = plt.subplots(figsize=(12, 12), subplot_kw=dict(projection='polar'))

# 绘制条形
bars = ax.bar(angles, values1, width=0.5, bottom=0.0, alpha=0.5, label='Series 1')

# 绘制散点
scatter = ax.scatter(angles, values2, c='red', s=100, alpha=0.8, label='Series 2')

# 设置刻度标签
ax.set_xticks(angles)
ax.set_xticklabels(categories)

# 设置y轴范围
ax.set_ylim(0, 70)

# 添加图例
ax.legend(loc='upper right', bbox_to_anchor=(1.3, 1.0))

# 添加标题
ax.set_title('Circular Bar Plot with Polar Scatter - how2matplotlib.com', fontweight='bold')

plt.show()
Output:
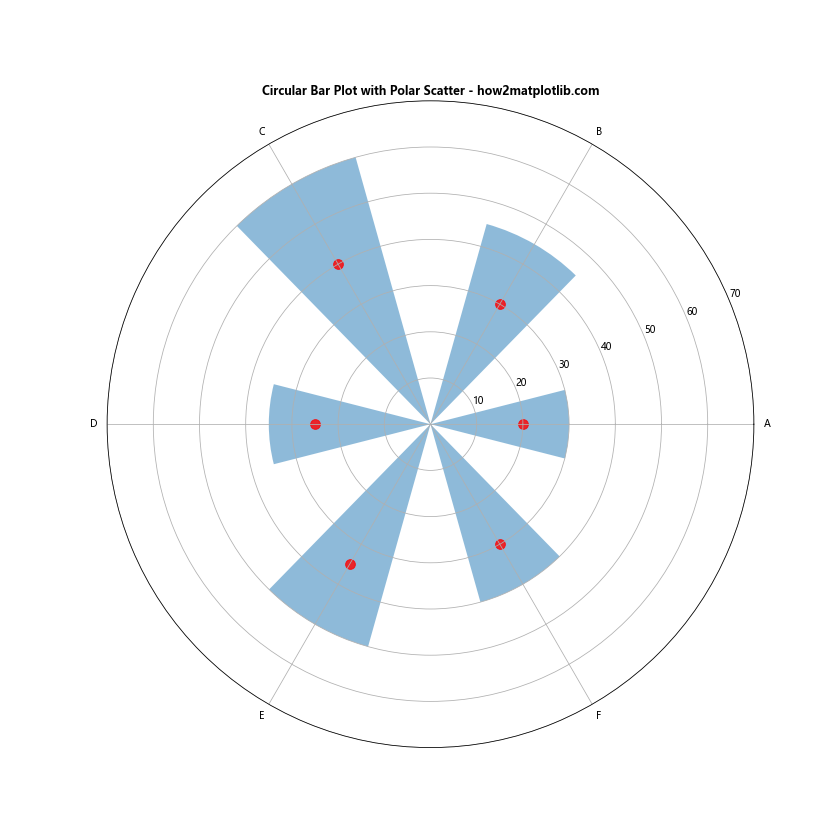
在这个例子中,我们使用ax.scatter()函数在圆形条形图上添加了散点。这种组合可以帮助我们同时展示两个相关的数据系列。
15. 创建径向热图
我们可以将圆形条形图的概念扩展到径向热图,这种图表可以展示更复杂的二维数据。以下是一个创建径向热图的示例:
import numpy as np
import matplotlib.pyplot as plt

# 准备数据
categories = ['A', 'B', 'C', 'D', 'E', 'F']
subcategories = ['1', '2', '3', '4']
data = np.random.rand(len(categories), len(subcategories))

# 计算角度
angles = np.linspace(0, 2*np.pi, len(categories), endpoint=False)

# 创建图形和极坐标子图
fig, ax = plt.subplots(figsize=(12, 12), subplot_kw=dict(projection='polar'))

# 创建径向网格
r, theta = np.meshgrid(np.arange(len(subcategories)), angles)

# 绘制热图
cax = ax.pcolormesh(theta, r, data, cmap='YlOrRd')

# 设置刻度标签
ax.set_xticks(angles)
ax.set_xticklabels(categories)
ax.set_yticks(np.arange(len(subcategories)))
ax.set_yticklabels(subcategories)

# 添加颜色条
cbar = fig.colorbar(cax)
cbar.set_label('Value')

# 添加标题
ax.set_title('Radial Heatmap - how2matplotlib.com', fontweight='bold')

plt.show()
Output:
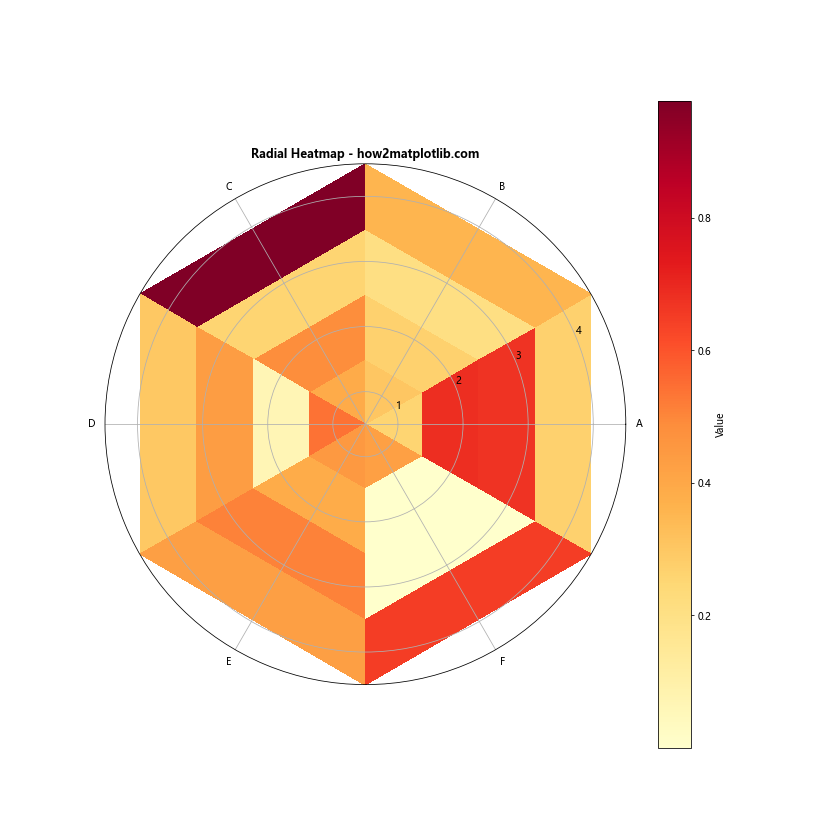
在这个例子中,我们使用ax.pcolormesh()函数创建了一个径向热图。这种图表可以有效地展示类别和子类别之间的关系,以及相应的数值大小。
16. 创建动态更新的圆形条形图
在某些情况下,我们可能需要实时更新圆形条形图的数据。以下是一个使用animation模块创建动态更新圆形条形图的示例:
import numpy as np
import matplotlib.pyplot as plt
from matplotlib.animation import FuncAnimation

# 准备初始数据
categories = ['A', 'B', 'C', 'D', 'E']
values = [30, 45, 60, 35, 50]

# 计算角度
angles = np.linspace(0, 2*np.pi, len(categories), endpoint=False)

# 创建图形和极坐标子图
fig, ax = plt.subplots(figsize=(10, 10), subplot_kw=dict(projection='polar'))

# 初始化条形
bars = ax.bar(angles, values, width=0.5, bottom=0.0, alpha=0.5)

# 设置刻度标签
ax.set_xticks(angles)
ax.set_xticklabels(categories)

# 设置y轴范围
ax.set_ylim(0, 100)

# 添加标题
ax.set_title('Dynamic Circular Bar Plot - how2matplotlib.com', fontweight='bold')

# 定义更新函数
def update(frame):
    new_values = [v + np.random.randint(-10, 11) for v in values]
    for bar, value in zip(bars, new_values):
        bar.set_height(value)
    return bars

# 创建动画
anim = FuncAnimation(fig, update, frames=200, interval=100, blit=True)

plt.show()
Output:
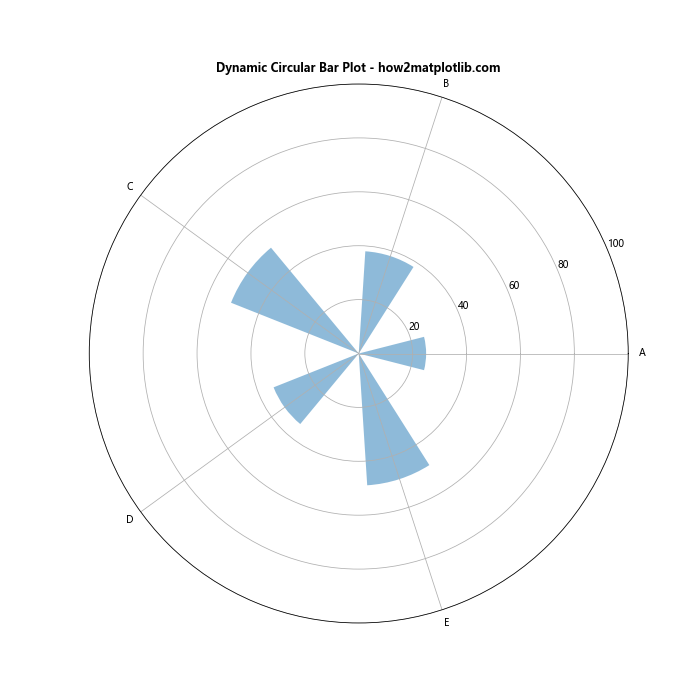
在这个例子中,我们定义了一个update函数,它在每一帧都会随机调整条形的高度。通过使用FuncAnimation,我们创建了一个动态更新的圆形条形图。
17. 创建多环圆形条形图
多环圆形条形图可以用来比较多个数据系列或时间段的数据。以下是一个创建多环圆形条形图的示例:
import numpy as np
import matplotlib.pyplot as plt

# 准备数据
categories = ['A', 'B', 'C', 'D', 'E', 'F']
values1 = [30, 45, 60, 35, 50, 40]
values2 = [25, 40, 55, 30, 45, 35]
values3 = [20, 35, 50, 25, 40, 30]

# 计算角度
angles = np.linspace(0, 2*np.pi, len(categories), endpoint=False)

# 创建图形和极坐标子图
fig, ax = plt.subplots(figsize=(12, 12), subplot_kw=dict(projection='polar'))

# 绘制多环条形
width = 0.2
bars1 = ax.bar(angles, values1, width=width, bottom=0.0, alpha=0.5, label='Series 1')
bars2 = ax.bar(angles, values2, width=width, bottom=values1, alpha=0.5, label='Series 2')
bars3 = ax.bar(angles, values3, width=width, bottom=[i+j for i,j in zip(values1, values2)], alpha=0.5, label='Series 3')

# 设置刻度标签
ax.set_xticks(angles)
ax.set_xticklabels(categories)

# 设置y轴范围
ax.set_ylim(0, 200)

# 添加图例
ax.legend(loc='upper right', bbox_to_anchor=(1.3, 1.0))

# 添加标题
ax.set_title('Multi-ring Circular Bar Plot - how2matplotlib.com', fontweight='bold')

plt.show()
Output:
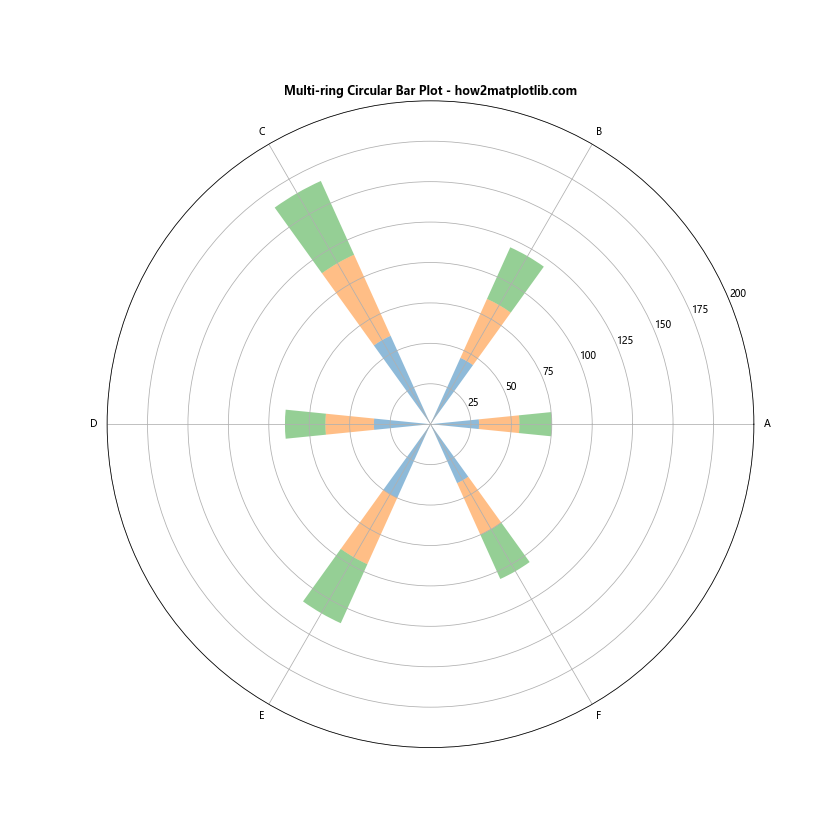
在这个例子中,我们通过调整每个系列的bottom参数,创建了一个多环的效果。这种图表可以有效地展示多个相关数据系列之间的关系和比较。
18. 创建极坐标面积图
极坐标面积图是圆形条形图的一种变体,它可以更好地展示连续数据或累积效应。以下是一个创建极坐标面积图的示例:
import numpy as np
import matplotlib.pyplot as plt

# 准备数据
categories = ['Jan', 'Feb', 'Mar', 'Apr', 'May', 'Jun', 'Jul', 'Aug', 'Sep', 'Oct', 'Nov', 'Dec']
values = [30, 35, 45, 55, 60, 70, 75, 70, 65, 55, 40, 35]

# 计算角度
angles = np.linspace(0, 2*np.pi, len(categories), endpoint=False)

# 闭合数据
values = np.concatenate((values, [values[0]]))
angles = np.concatenate((angles, [angles[0]]))

# 创建图形和极坐标子图
fig, ax = plt.subplots(figsize=(10, 10), subplot_kw=dict(projection='polar'))

# 绘制极坐标面积图
ax.fill(angles, values, alpha=0.25)
ax.plot(angles, values)

# 设置刻度标签
ax.set_xticks(angles[:-1])
ax.set_xticklabels(categories)

# 设置y轴范围
ax.set_ylim(0, 80)

# 添加标题
ax.set_title('Polar Area Chart - how2matplotlib.com', fontweight='bold')

plt.show()
Output:
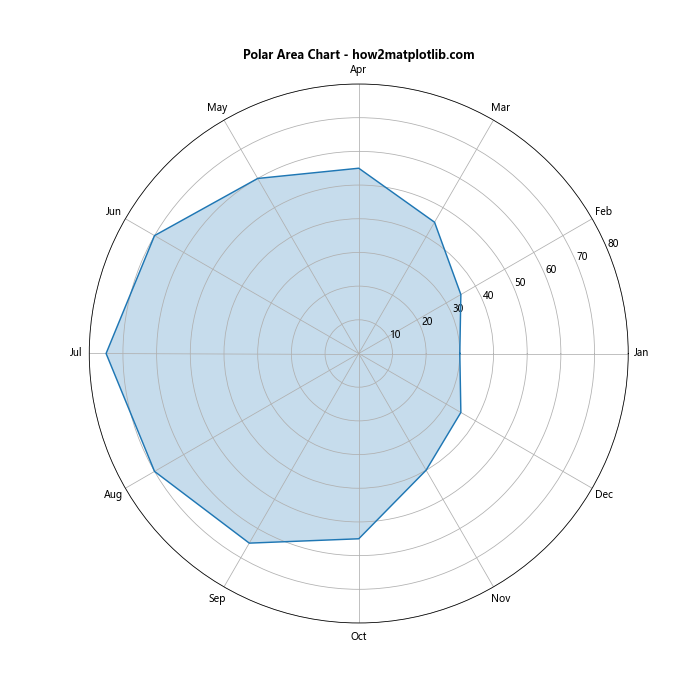
在这个例子中,我们使用ax.fill()函数创建了一个填充区域,并使用ax.plot()函数添加了一条轮廓线。这种图表特别适合展示周期性数据,如年度或季度数据。
19. 创建极坐标箱线图
极坐标箱线图可以用来展示数据的分布情况。以下是一个创建极坐标箱线图的示例:
import numpy as np
import matplotlib.pyplot as plt

# 准备数据
categories = ['A', 'B', 'C', 'D', 'E']
data = [np.random.normal(0, std, 100) for std in range(1, 6)]

# 计算角度
angles = np.linspace(0, 2*np.pi, len(categories), endpoint=False)

# 创建图形和极坐标子图
fig, ax = plt.subplots(figsize=(10, 10), subplot_kw=dict(projection='polar'))

# 绘制极坐标箱线图
bplot = ax.boxplot(data, positions=angles, widths=0.5)

# 设置刻度标签
ax.set_xticks(angles)
ax.set_xticklabels(categories)

# 设置y轴范围
ax.set_ylim(-15, 15)

# 添加标题
ax.set_title('Polar Box Plot - how2matplotlib.com', fontweight='bold')

plt.show()
Output:
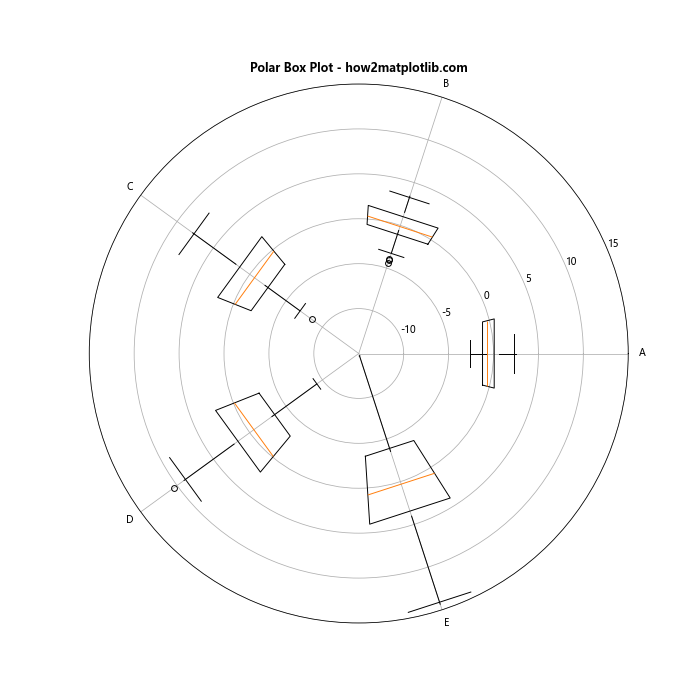
在这个例子中,我们使用ax.boxplot()函数创建了箱线图,并通过设置positions参数将其放置在极坐标系中。这种图表可以有效地展示每个类别数据的分布情况。
20. 结合词云的圆形条形图
最后,我们可以尝试将圆形条形图与词云结合,创造出一种独特的可视化效果。以下是一个示例:
import numpy as np
import matplotlib.pyplot as plt
from wordcloud import WordCloud

# 准备数据
categories = ['Python', 'Java', 'C++', 'JavaScript', 'Ruby', 'Go']
values = [60, 45, 40, 50, 30, 35]

# 计算角度
angles = np.linspace(0, 2*np.pi, len(categories), endpoint=False)

# 创建图形和极坐标子图
fig, ax = plt.subplots(figsize=(12, 12), subplot_kw=dict(projection='polar'))

# 绘制条形
bars = ax.bar(angles, values, width=0.5, bottom=0.0, alpha=0.5)

# 设置刻度标签
ax.set_xticks(angles)
ax.set_xticklabels(categories)

# 设置y轴范围
ax.set_ylim(0, 70)

# 创建词云
text = ' '.join([f"{cat} " * int(val) for cat, val in zip(categories, values)])
wordcloud = WordCloud(background_color='white', width=400, height=400).generate(text)

# 在中心添加词云
ax.imshow(wordcloud, extent=(-20, 20, -20, 20))

# 添加标题
ax.set_title('Circular Bar Plot with Word Cloud - how2matplotlib.com', fontweight='bold')

plt.show()
在这个例子中,我们首先创建了一个标准的圆形条形图,然后使用WordCloud库生成了一个词云。我们将词云放置在圆形条形图的中心,创造出一种独特的视觉效果。这种组合可以同时展示数据的数量和重要性。
总结
圆形条形图是一种强大而灵活的数据可视化工具,它可以以紧凑和吸引人的方式展示分类数据。通过本文介绍的各种技巧和变体,你可以创建出丰富多样的圆形条形图,以满足不同的数据展示需求。
从基本的圆形条形图到复杂的多层次、多维度可视化,从静态图表到动态更新的动画,从单一图表类型到与其他图表类型的结合,圆形条形图都展现出了强大的适应性和表现力。
在实际应用中,选择合适的圆形条形图类型和样式取决于你的数据特征和展示目的。无论是展示单一数据系列,比较多个数据系列,还是展示复杂的多维数据,圆形条形图都能够提供独特而有效的可视化解决方案。
最后,记住数据可视化的核心目的是有效地传达信息。在使用圆形条形图时,始终要考虑你的目标受众和你想要传达的关键信息。通过合理的设计和适当的定制,圆形条形图可以成为你数据可视化工具箱中的一个强大武器。
 极客教程
极客教程