Matplotlib实现非结构化三角网格的伪彩色图绘制
参考:Create a pseudocolor plot of an unstructured triangular grid in Python using Matplotlib
非结构化三角网格是一种常用于数值模拟和科学计算的数据结构,它能够灵活地表示复杂的几何形状和不规则的数据分布。在Python中,我们可以使用Matplotlib库来创建这种网格的伪彩色图,以直观地展示数据的分布和变化。本文将详细介绍如何使用Matplotlib实现非结构化三角网格的伪彩色图绘制,包括数据准备、网格创建、颜色映射和图形美化等方面。
1. 基本概念和准备工作
在开始绘制非结构化三角网格的伪彩色图之前,我们需要了解一些基本概念并做好准备工作。
1.1 什么是非结构化三角网格?
非结构化三角网格是由一系列不规则排列的三角形单元组成的网格。与结构化网格相比,非结构化网格可以更好地适应复杂的几何形状和边界条件。在科学计算和工程模拟中,非结构化三角网格被广泛用于有限元分析、计算流体动力学等领域。
1.2 什么是伪彩色图?
伪彩色图是一种将标量数据映射到颜色空间的可视化技术。通过将数据值与颜色对应,我们可以直观地展示数据的分布和变化。在非结构化三角网格的伪彩色图中,每个三角形单元的颜色代表了该单元所对应的数据值。
1.3 准备工作
在开始绘图之前,我们需要安装并导入必要的Python库。主要使用的库包括:
- Matplotlib:用于绘图
- NumPy:用于数值计算和数组操作
- SciPy:用于科学计算,我们将使用其中的Delaunay三角剖分功能
首先,确保已经安装了这些库。可以使用以下命令安装:
pip install matplotlib numpy scipy
接下来,在Python脚本中导入所需的模块:
import matplotlib.pyplot as plt
import numpy as np
from scipy.spatial import Delaunay

print("Welcome to how2matplotlib.com")
2. 创建非结构化三角网格
要创建非结构化三角网格,我们需要先生成一组随机点,然后使用Delaunay三角剖分算法将这些点连接成三角形。
2.1 生成随机点
首先,我们使用NumPy的随机函数生成一组随机点:
import numpy as np
import matplotlib.pyplot as plt
from scipy.spatial import Delaunay

# 生成随机点
np.random.seed(42)  # 设置随机种子以保证结果可重复
n_points = 50
points = np.random.rand(n_points, 2)

# 绘制散点图
plt.figure(figsize=(8, 6))
plt.scatter(points[:, 0], points[:, 1], c='b', alpha=0.5)
plt.title('Random Points - how2matplotlib.com')
plt.xlabel('X')
plt.ylabel('Y')
plt.show()

print("Visit how2matplotlib.com for more examples")
Output:
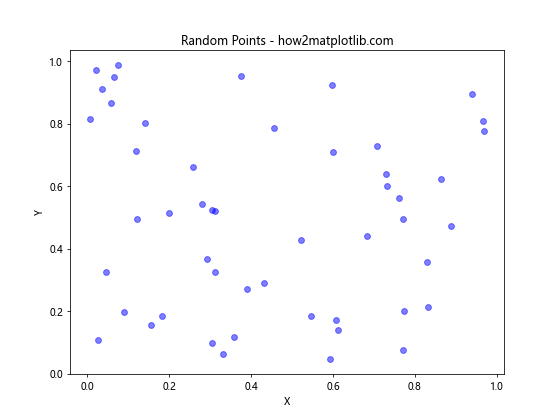
这段代码生成了50个随机点,并将它们绘制在散点图上。np.random.seed(42)设置了随机种子,以确保每次运行代码时生成相同的随机点。
2.2 Delaunay三角剖分
接下来,我们使用SciPy的Delaunay函数对这些点进行三角剖分:
import numpy as np
import matplotlib.pyplot as plt
from scipy.spatial import Delaunay

# 生成随机点
np.random.seed(42)
n_points = 50
points = np.random.rand(n_points, 2)

# 进行Delaunay三角剖分
tri = Delaunay(points)

# 绘制三角网格
plt.figure(figsize=(8, 6))
plt.triplot(points[:, 0], points[:, 1], tri.simplices)
plt.scatter(points[:, 0], points[:, 1], c='r')
plt.title('Delaunay Triangulation - how2matplotlib.com')
plt.xlabel('X')
plt.ylabel('Y')
plt.show()

print("Learn more about triangulation at how2matplotlib.com")
Output:
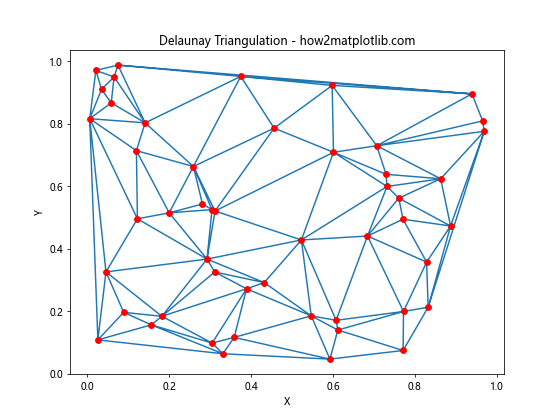
这段代码使用Delaunay函数对随机点进行三角剖分,然后使用triplot函数绘制三角网格。红色的点表示原始的随机点,蓝色的线表示三角形的边。
3. 为三角网格添加数据值
为了创建伪彩色图,我们需要为每个点或每个三角形单元分配一个数据值。这里我们将演示两种方法:基于点的数据和基于单元的数据。
3.1 基于点的数据
首先,我们为每个点分配一个数据值。这里我们使用点的x坐标作为数据值:
import numpy as np
import matplotlib.pyplot as plt
from scipy.spatial import Delaunay

# 生成随机点
np.random.seed(42)
n_points = 50
points = np.random.rand(n_points, 2)

# 进行Delaunay三角剖分
tri = Delaunay(points)

# 为每个点分配数据值(这里使用x坐标作为数据值)
z = points[:, 0]

# 绘制伪彩色图
plt.figure(figsize=(10, 8))
plt.tripcolor(points[:, 0], points[:, 1], tri.simplices, z, shading='flat', cmap='viridis')
plt.colorbar(label='Data Value')
plt.title('Pseudocolor Plot (Point-based) - how2matplotlib.com')
plt.xlabel('X')
plt.ylabel('Y')
plt.show()

print("Explore more color maps at how2matplotlib.com")
Output:
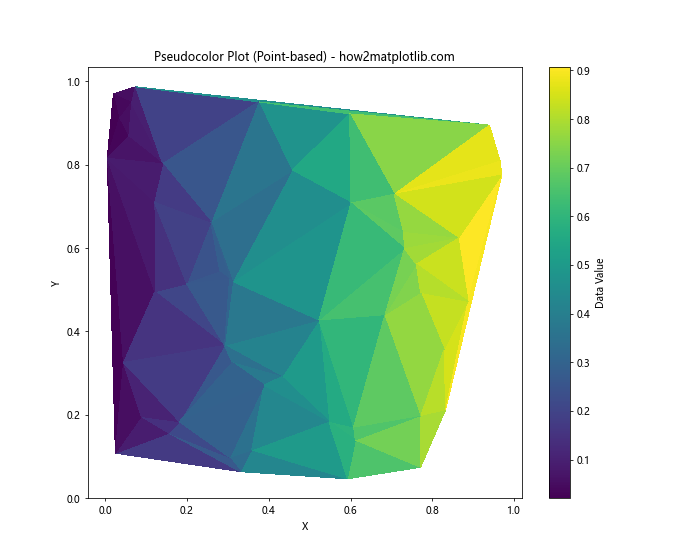
这段代码使用tripcolor函数创建伪彩色图。z数组包含每个点的数据值,shading='flat'参数指定每个三角形内部使用统一的颜色。
3.2 基于单元的数据
另一种方法是为每个三角形单元分配一个数据值。这里我们使用三角形重心的y坐标作为数据值:
import numpy as np
import matplotlib.pyplot as plt
from scipy.spatial import Delaunay

# 生成随机点
np.random.seed(42)
n_points = 50
points = np.random.rand(n_points, 2)

# 进行Delaunay三角剖分
tri = Delaunay(points)

# 计算每个三角形的重心
centroids = np.mean(points[tri.simplices], axis=1)

# 为每个三角形分配数据值(这里使用重心的y坐标作为数据值)
z = centroids[:, 1]

# 绘制伪彩色图
plt.figure(figsize=(10, 8))
plt.tripcolor(points[:, 0], points[:, 1], tri.simplices, facecolors=z, cmap='plasma')
plt.colorbar(label='Data Value')
plt.title('Pseudocolor Plot (Cell-based) - how2matplotlib.com')
plt.xlabel('X')
plt.ylabel('Y')
plt.show()

print("Learn about different color schemes at how2matplotlib.com")
Output:
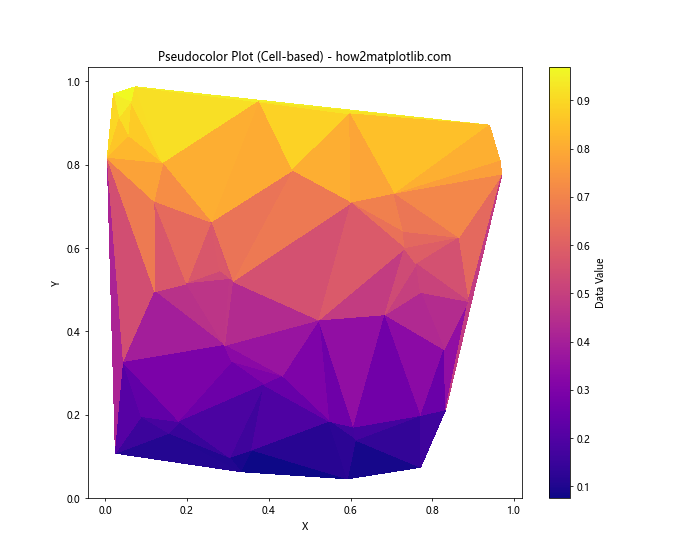
这段代码首先计算每个三角形的重心,然后使用重心的y坐标作为数据值。facecolors参数用于指定每个三角形的颜色。
4. 自定义颜色映射
Matplotlib提供了多种内置的颜色映射,但有时我们可能需要创建自定义的颜色映射以满足特定需求。
4.1 使用内置颜色映射
Matplotlib提供了许多内置的颜色映射,如’viridis’、’plasma’、’inferno’等。我们可以轻松地在绘图时指定不同的颜色映射:
import numpy as np
import matplotlib.pyplot as plt
from scipy.spatial import Delaunay

# 生成随机点
np.random.seed(42)
n_points = 50
points = np.random.rand(n_points, 2)

# 进行Delaunay三角剖分
tri = Delaunay(points)

# 为每个点分配数据值
z = points[:, 0] + points[:, 1]

# 创建图形和子图
fig, (ax1, ax2) = plt.subplots(1, 2, figsize=(16, 6))

# 使用'viridis'颜色映射
im1 = ax1.tripcolor(points[:, 0], points[:, 1], tri.simplices, z, shading='flat', cmap='viridis')
ax1.set_title("Viridis Colormap - how2matplotlib.com")
fig.colorbar(im1, ax=ax1, label='Data Value')

# 使用'coolwarm'颜色映射
im2 = ax2.tripcolor(points[:, 0], points[:, 1], tri.simplices, z, shading='flat', cmap='coolwarm')
ax2.set_title("Coolwarm Colormap - how2matplotlib.com")
fig.colorbar(im2, ax=ax2, label='Data Value')

plt.tight_layout()
plt.show()

print("Discover more colormaps at how2matplotlib.com")
Output:
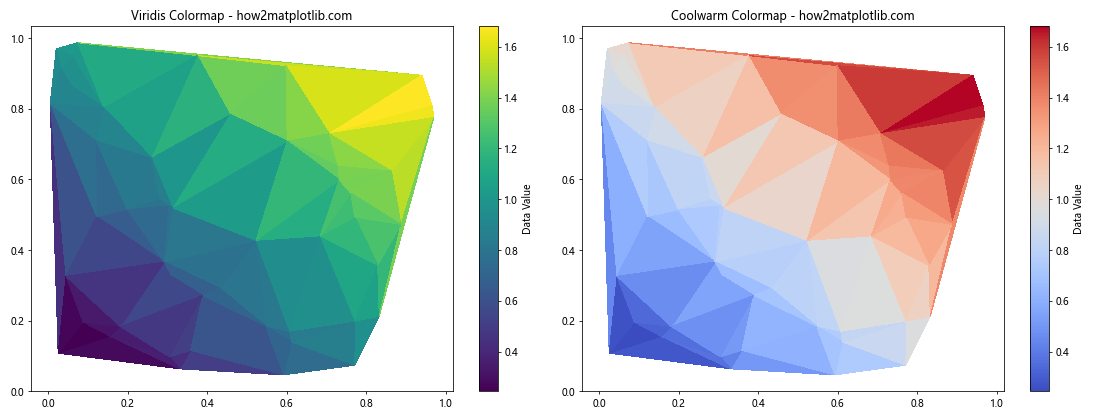
这段代码创建了两个子图,分别使用’viridis’和’coolwarm’颜色映射来展示相同的数据。
4.2 创建自定义颜色映射
有时,我们可能需要创建自定义的颜色映射。以下是一个创建自定义颜色映射的示例:
import numpy as np
import matplotlib.pyplot as plt
from scipy.spatial import Delaunay
from matplotlib.colors import LinearSegmentedColormap

# 生成随机点
np.random.seed(42)
n_points = 50
points = np.random.rand(n_points, 2)

# 进行Delaunay三角剖分
tri = Delaunay(points)

# 为每个点分配数据值
z = points[:, 0] + points[:, 1]

# 创建自定义颜色映射
colors = ['darkblue', 'royalblue', 'lightgreen', 'yellow', 'orange', 'red']
n_bins = len(colors)
cmap = LinearSegmentedColormap.from_list("custom_cmap", colors, N=n_bins)

# 绘制伪彩色图
plt.figure(figsize=(10, 8))
plt.tripcolor(points[:, 0], points[:, 1], tri.simplices, z, shading='flat', cmap=cmap)
plt.colorbar(label='Data Value')
plt.title('Custom Colormap - how2matplotlib.com')
plt.xlabel('X')
plt.ylabel('Y')
plt.show()

print("Create your own colormaps with how2matplotlib.com")
Output:
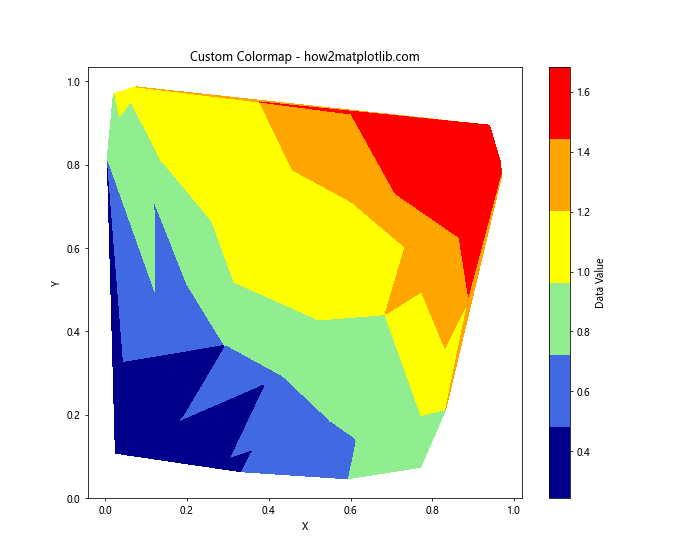
这段代码创建了一个从深蓝色到红色的自定义颜色映射,并将其应用到伪彩色图中。
5. 添加等高线
为了更好地展示数据的变化,我们可以在伪彩色图上添加等高线。
import numpy as np
import matplotlib.pyplot as plt
from scipy.spatial import Delaunay

# 生成随机点
np.random.seed(42)
n_points = 100
points = np.random.rand(n_points, 2)

# 进行Delaunay三角剖分
tri = Delaunay(points)

# 为每个点分配数据值
z = np.sin(2 * np.pi * points[:, 0]) * np.cos(2 * np.pi * points[:, 1])

# 绘制伪彩色图和等高线
plt.figure(figsize=(12, 9))
plt.tripcolor(points[:, 0], points[:, 1], tri.simplices, z, shading='flat', cmap='viridis')
plt.tricontour(points[:, 0], points[:, 1], tri.simplices, z, colors='k', linewidths=0.5)
plt.colorbar(label='Data Value')
plt.title('Pseudocolor Plot with Contours - how2matplotlib.com')
plt.xlabel('X')
plt.ylabel('Y')
plt.show()

print("Learn to combine plots at how2matplotlib.com")
Output:
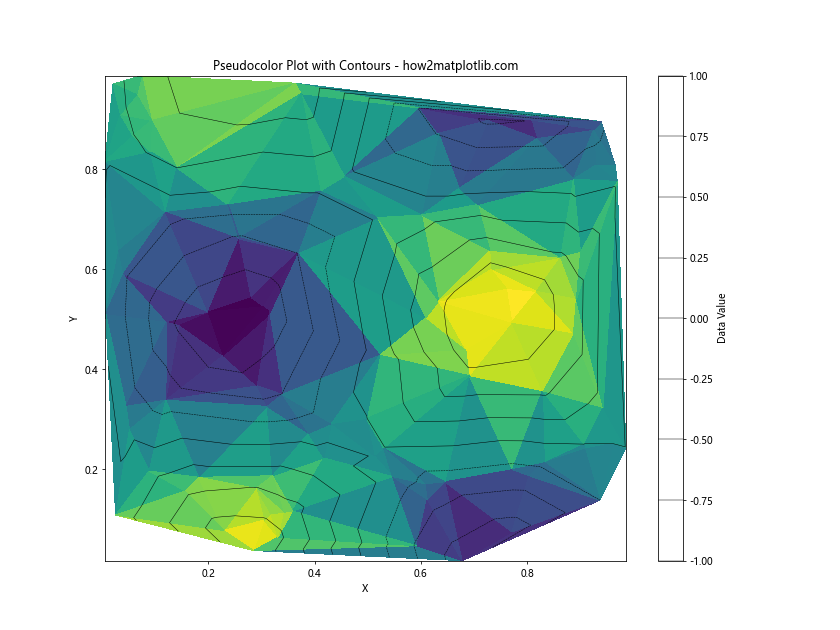
这段代码使用tricontour函数在伪彩色图上添加等高线。黑色的等高线有助于更清晰地展示数据的变化趋势。
6. 处理不规则边界
在某些情况下,我们可能需要处理具有不规则边界的数据。以下是一个创建具有圆形边界的非结构化三角网格的示例:
import numpy as np
import matplotlib.pyplot as plt
from scipy.spatial import Delaunay

# 生成圆形区域内的随机点
np.random.seed(42)
n_points = 500
r = np.random.uniform(0, 1, n_points)
theta = np.random.uniform(0, 2*np.pi, n_points)
x = r * np.cos(theta)
y = r * np.sin(theta)
points = np.column_stack((x, y))

# 进行Delaunay三角剖分
tri = Delaunay(points)

# 为每个点分配数据值
z = np.sqrt(x**2 + y**2)

# 绘制伪彩色图
plt.figure(figsize=(10, 10))
plt.tripcolor(x, y, tri.simplices, z, shading='flat', cmap='viridis')
plt.colorbar(label='Distance from Center')
plt.title('Circular Domain - how2matplotlib.com')
plt.xlabel('X')
plt.ylabel('Y')
plt.axis('equal')
plt.show()

print("Explore irregular domains at how2matplotlib.com")
Output:
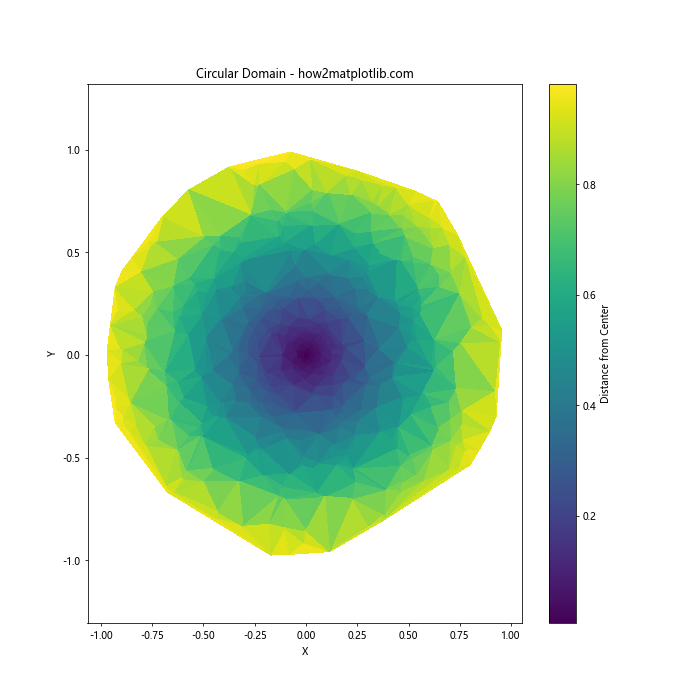
这段代码生成了一个圆形区域内的随机点,并创建了一个具有圆形边界的非结构化三角网格。数据值被设置为每个点到圆心的距离。
7. 添加网格线和标记点
为了增强可视化效果,我们可以在伪彩色图上添加网格线和特殊标记点。
import numpy as np
import matplotlib.pyplot as plt
from scipy.spatial import Delaunay

# 生成随机点
np.random.seed(42)
n_points = 100
points = np.random.rand(n_points, 2)

# 进行Delaunay三角剖分
tri = Delaunay(points)

# 为每个点分配数据值
z = np.sin(2 * np.pi * points[:, 0]) * np.cos(2 * np.pi * points[:, 1])

# 绘制伪彩色图
plt.figure(figsize=(12, 9))
plt.tripcolor(points[:, 0], points[:, 1], tri.simplices, z, shading='flat', cmap='viridis')
plt.triplot(points[:, 0], points[:, 1], tri.simplices, 'k-', lw=0.5, alpha=0.3)
plt.scatter(points[:, 0], points[:, 1], c='r', s=20)
plt.colorbar(label='Data Value')
plt.title('Pseudocolor Plot with Grid and Points - how2matplotlib.com')
plt.xlabel('X')
plt.ylabel('Y')
plt.show()

print("Enhance your plots with how2matplotlib.com")
Output:
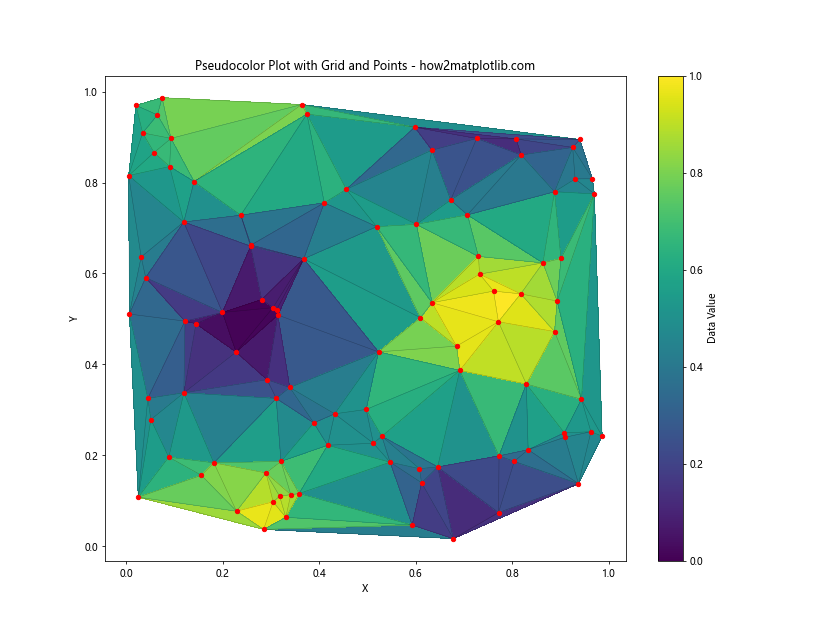
这段代码使用triplot函数添加网格线,并使用scatter函数添加红色的标记点。
8. 处理大规模数据
当处理大规模数据时,我们需要考虑性能和内存使用。以下是一个处理较大数据集的示例:
import numpy as np
import matplotlib.pyplot as plt
from scipy.spatial import Delaunay

# 生成大量随机点
np.random.seed(42)
n_points = 10000
points = np.random.rand(n_points, 2)

# 进行Delaunay三角剖分
tri = Delaunay(points)

# 为每个点分配数据值
z = np.sin(5 * np.pi * points[:, 0]) * np.cos(5 * np.pi * points[:, 1])

# 绘制伪彩色图
plt.figure(figsize=(12, 9))
plt.tripcolor(points[:, 0], points[:, 1], tri.simplices, z, shading='gouraud', cmap='viridis')
plt.colorbar(label='Data Value')
plt.title('Large-scale Data Visualization - how2matplotlib.com')
plt.xlabel('X')
plt.ylabel('Y')
plt.show()

print("Handle big data with how2matplotlib.com")
Output:
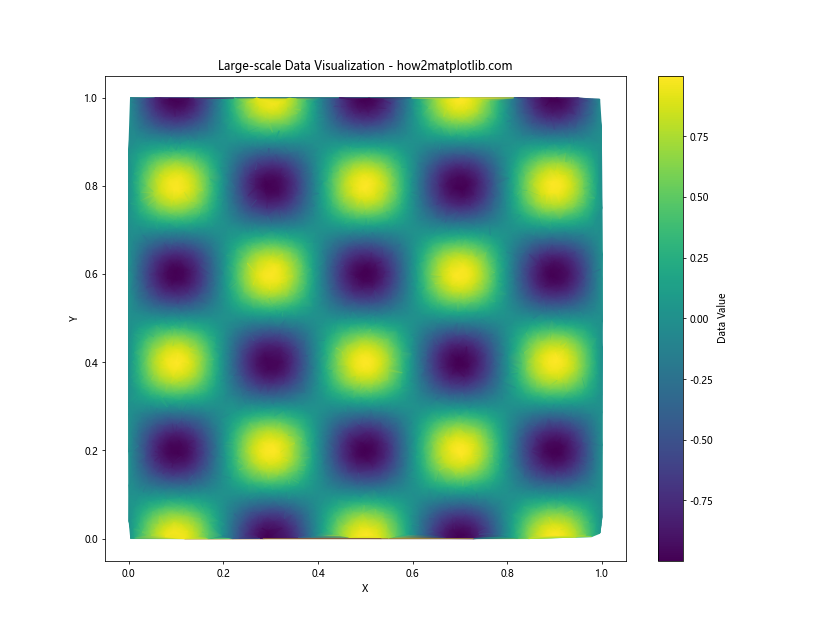
这段代码处理了10,000个点的数据集。注意我们使用了shading='gouraud'参数来实现更平滑的颜色过渡。
9. 添加文本注释
在某些情况下,我们可能需要在图上添加文本注释来解释特定的特征或区域。
import numpy as np
import matplotlib.pyplot as plt
from scipy.spatial import Delaunay

# 生成随机点
np.random.seed(42)
n_points = 100
points = np.random.rand(n_points, 2)

# 进行Delaunay三角剖分
tri = Delaunay(points)

# 为每个点分配数据值
z = np.sin(2 * np.pi * points[:, 0]) * np.cos(2 * np.pi * points[:, 1])

# 绘制伪彩色图
plt.figure(figsize=(12, 9))
im = plt.tripcolor(points[:, 0], points[:, 1], tri.simplices, z, shading='flat', cmap='viridis')
plt.colorbar(im, label='Data Value')

# 添加文本注释
plt.annotate('High Value Region', xy=(0.8, 0.8), xytext=(0.6, 0.9),
             arrowprops=dict(facecolor='black', shrink=0.05))
plt.annotate('Low Value Region', xy=(0.2, 0.2), xytext=(0.4, 0.1),
             arrowprops=dict(facecolor='black', shrink=0.05))

plt.title('Pseudocolor Plot with Annotations - how2matplotlib.com')
plt.xlabel('X')
plt.ylabel('Y')
plt.show()

print("Add informative annotations with how2matplotlib.com")
Output:
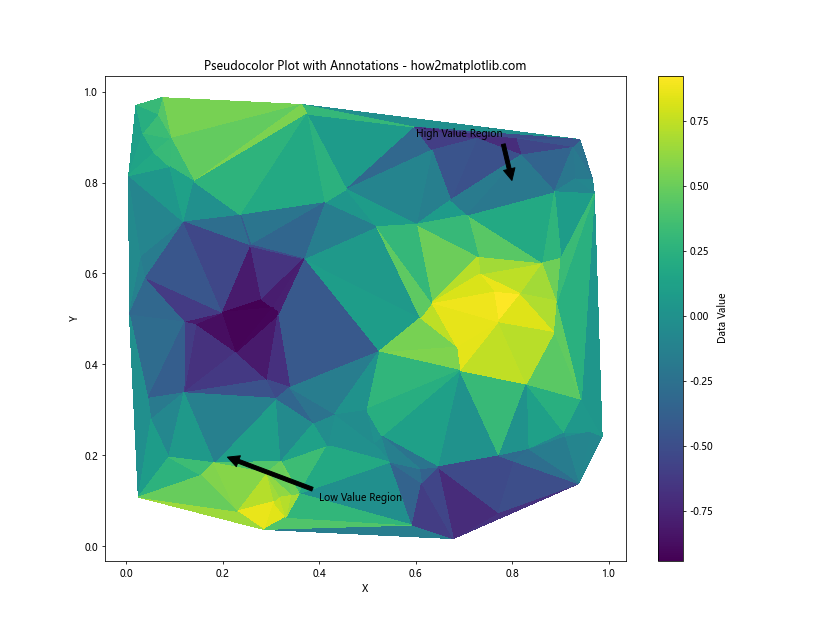
这段代码使用annotate函数添加了两个带箭头的文本注释,指向高值和低值区域。
10. 创建动画
最后,我们可以创建一个动画来展示数据随时间的变化。这里我们将展示一个简单的波动模式:
import numpy as np
import matplotlib.pyplot as plt
from scipy.spatial import Delaunay
from matplotlib.animation import FuncAnimation

# 生成随机点
np.random.seed(42)
n_points = 500
points = np.random.rand(n_points, 2)

# 进行Delaunay三角剖分
tri = Delaunay(points)

# 创建图形
fig, ax = plt.subplots(figsize=(10, 8))

# 初始化伪彩色图
z = np.zeros(n_points)
tcf = ax.tripcolor(points[:, 0], points[:, 1], tri.simplices, z, shading='gouraud', cmap='viridis')
fig.colorbar(tcf, label='Data Value')

# 更新函数
def update(frame):
    t = frame / 50
    z = np.sin(2 * np.pi * (points[:, 0] + t)) * np.cos(2 * np.pi * (points[:, 1] + t))
    tcf.set_array(z)
    ax.set_title(f'Wave Animation (t={t:.2f}) - how2matplotlib.com')
    return tcf,

# 创建动画
anim = FuncAnimation(fig, update, frames=100, interval=50, blit=True)

plt.xlabel('X')
plt.ylabel('Y')
plt.show()

print("Create stunning animations with how2matplotlib.com")
Output:
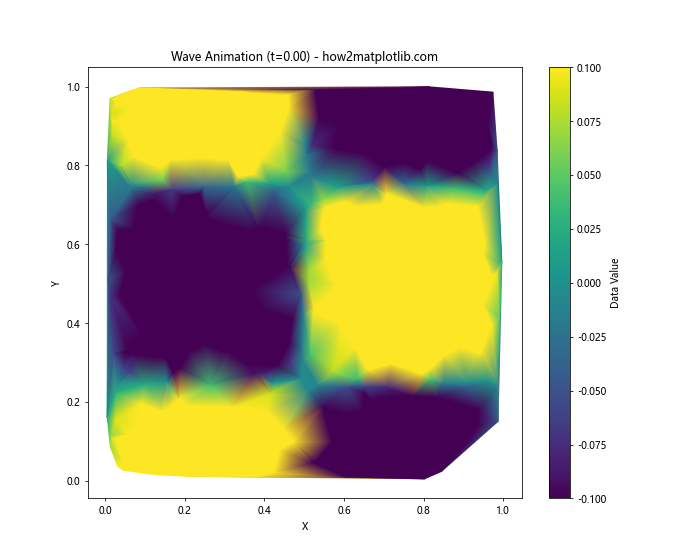
这段代码创建了一个动画,展示了一个在非结构化三角网格上传播的波动模式。FuncAnimation函数用于生成动画,update函数在每一帧更新数据值。
总结
在本文中,我们详细探讨了如何使用Matplotlib创建非结构化三角网格的伪彩色图。我们涵盖了从基本概念到高级技巧的多个方面,包括:
- 基本概念和准备工作
- 创建非结构化三角网格
- 为三角网格添加数据值
- 自定义颜色映射
- 添加等高线
- 处理不规则边界
- 添加网格线和标记点
- 处理大规模数据
- 添加文本注释
- 创建动画
通过这些技术,我们可以有效地可视化复杂的非结构化数据,为科学计算和数据分析提供强大的工具。无论是在工程模拟、地理信息系统还是其他需要处理不规则数据的领域,这些方法都能派上用场。
记住,创建有效的可视化不仅需要技术知识,还需要对数据的深入理解和艺术感。通过不断实践和探索,你可以创建出既信息丰富又视觉吸引的图表,帮助你更好地理解和展示复杂的数据集。
最后,我们鼓励读者进一步探索Matplotlib的其他功能,并将这些技术应用到自己的项目中。可视化是数据科学和科学计算中不可或缺的一部分,掌握这些技能将极大地提升你分析和展示数据的能力。
 极客教程
极客教程