Matplotlib中如何调整x轴或y轴的刻度频率
参考:Changing the tick frequency on x or y axis in matplotlib
Matplotlib是Python中最流行的数据可视化库之一,它提供了丰富的功能来创建各种类型的图表和绘图。在使用Matplotlib创建图表时,调整x轴或y轴的刻度频率是一个常见的需求。适当的刻度频率可以使图表更加清晰易读,突出重要信息。本文将详细介绍如何在Matplotlib中调整x轴或y轴的刻度频率,包括多种方法和技巧。
1. 基本概念
在开始之前,我们需要了解一些基本概念:
- 刻度(Tick):指的是坐标轴上的标记,用于表示数值或类别。
- 刻度标签(Tick Label):与刻度对应的文本标签,显示具体的数值或类别名称。
- 刻度定位器(Tick Locator):用于确定刻度的位置。
- 刻度格式化器(Tick Formatter):用于设置刻度标签的格式。
调整刻度频率实际上就是控制刻度的数量和位置,以及相应的刻度标签的显示方式。
2. 使用set_xticks()和set_yticks()方法
最直接的调整刻度频率的方法是使用set_xticks()和set_yticks()方法。这两个方法允许我们手动指定刻度的位置。
示例代码:
import matplotlib.pyplot as plt
import numpy as np

# 创建数据
x = np.linspace(0, 10, 100)
y = np.sin(x)

# 创建图表
plt.figure(figsize=(10, 6))
plt.plot(x, y)

# 设置x轴刻度
plt.xticks(np.arange(0, 11, 2))

# 设置y轴刻度
plt.yticks(np.arange(-1, 1.1, 0.5))

plt.title("How to adjust tick frequency - how2matplotlib.com")
plt.xlabel("X axis")
plt.ylabel("Y axis")

plt.show()
Output:
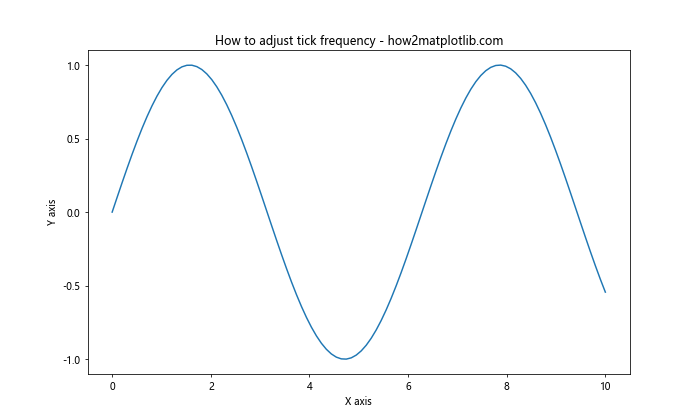
在这个例子中,我们使用np.arange()函数生成等间隔的刻度位置,然后通过plt.xticks()和plt.yticks()方法设置x轴和y轴的刻度。对于x轴,我们设置了从0到10,间隔为2的刻度;对于y轴,我们设置了从-1到1,间隔为0.5的刻度。
3. 使用MultipleLocator定位器
Matplotlib提供了多种定位器,其中MultipleLocator是一个非常有用的定位器,它可以设置固定间隔的刻度。
示例代码:
import matplotlib.pyplot as plt
import numpy as np
from matplotlib.ticker import MultipleLocator

# 创建数据
x = np.linspace(0, 20, 200)
y = np.exp(-x/10) * np.cos(2*np.pi*x)

# 创建图表
fig, ax = plt.subplots(figsize=(10, 6))
ax.plot(x, y)

# 设置x轴刻度间隔为2
ax.xaxis.set_major_locator(MultipleLocator(2))

# 设置y轴刻度间隔为0.2
ax.yaxis.set_major_locator(MultipleLocator(0.2))

ax.set_title("Using MultipleLocator - how2matplotlib.com")
ax.set_xlabel("X axis")
ax.set_ylabel("Y axis")

plt.show()
Output:
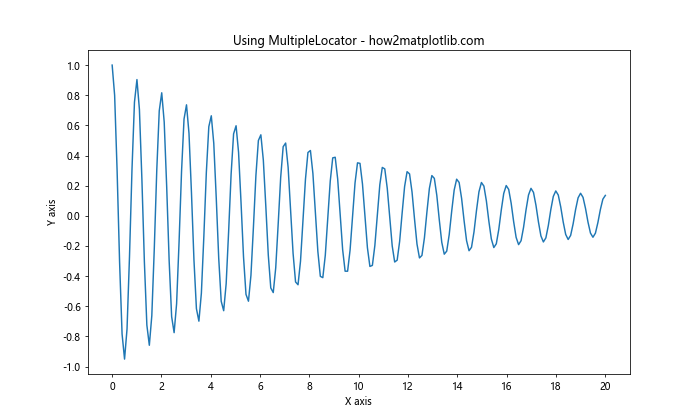
在这个例子中,我们使用MultipleLocator(2)设置x轴的主刻度间隔为2,使用MultipleLocator(0.2)设置y轴的主刻度间隔为0.2。这种方法比手动设置刻度更加灵活,特别是当数据范围较大时。
4. 使用MaxNLocator定位器
MaxNLocator是另一个常用的定位器,它可以设置最大刻度数量,Matplotlib会自动选择合适的刻度间隔。
示例代码:
import matplotlib.pyplot as plt
import numpy as np
from matplotlib.ticker import MaxNLocator

# 创建数据
x = np.linspace(0, 100, 1000)
y = np.sin(x) * np.exp(-x/50)

# 创建图表
fig, ax = plt.subplots(figsize=(10, 6))
ax.plot(x, y)

# 设置x轴最多显示10个刻度
ax.xaxis.set_major_locator(MaxNLocator(10))

# 设置y轴最多显示6个刻度
ax.yaxis.set_major_locator(MaxNLocator(6))

ax.set_title("Using MaxNLocator - how2matplotlib.com")
ax.set_xlabel("X axis")
ax.set_ylabel("Y axis")

plt.show()
Output:
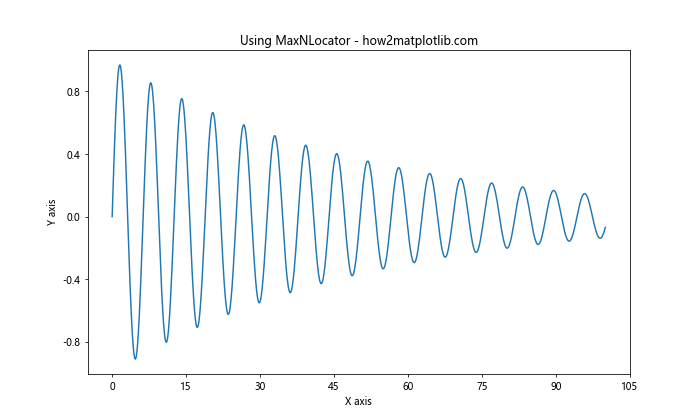
在这个例子中,我们使用MaxNLocator(10)设置x轴最多显示10个刻度,使用MaxNLocator(6)设置y轴最多显示6个刻度。这种方法特别适合当你不确定数据范围,但想控制刻度数量时使用。
5. 使用LogLocator定位器
对于对数刻度,我们可以使用LogLocator定位器。这在处理跨越多个数量级的数据时特别有用。
示例代码:
import matplotlib.pyplot as plt
import numpy as np
from matplotlib.ticker import LogLocator

# 创建数据
x = np.logspace(0, 5, 100)
y = x**2

# 创建图表
fig, ax = plt.subplots(figsize=(10, 6))
ax.plot(x, y)

# 设置x轴和y轴为对数刻度
ax.set_xscale('log')
ax.set_yscale('log')

# 设置x轴和y轴的刻度定位器
ax.xaxis.set_major_locator(LogLocator(base=10, numticks=6))
ax.yaxis.set_major_locator(LogLocator(base=10, numticks=6))

ax.set_title("Using LogLocator - how2matplotlib.com")
ax.set_xlabel("X axis (log scale)")
ax.set_ylabel("Y axis (log scale)")

plt.show()
Output:
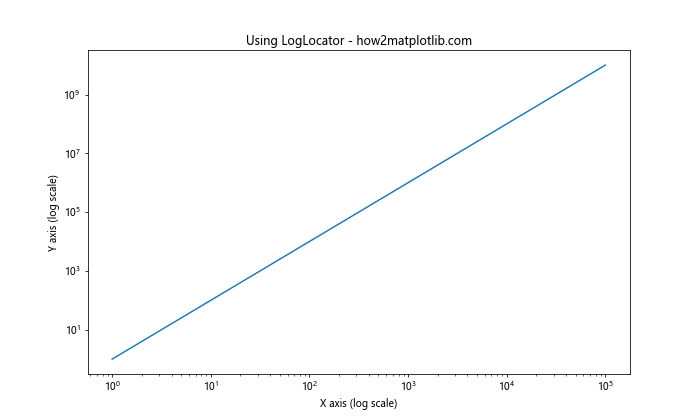
在这个例子中,我们使用LogLocator(base=10, numticks=6)为x轴和y轴设置对数刻度,基数为10,最多显示6个刻度。这种方法适用于需要在对数刻度上显示数据的情况。
6. 使用AutoLocator定位器
AutoLocator是Matplotlib的默认定位器,它会自动选择合适的刻度间隔。虽然它通常工作得很好,但有时我们可能需要对其进行微调。
示例代码:
import matplotlib.pyplot as plt
import numpy as np
from matplotlib.ticker import AutoLocator

# 创建数据
x = np.linspace(0, 10, 100)
y = np.sin(x) * np.cos(x)

# 创建图表
fig, ax = plt.subplots(figsize=(10, 6))
ax.plot(x, y)

# 使用AutoLocator并设置参数
auto_locator = AutoLocator(nbins=8)
ax.xaxis.set_major_locator(auto_locator)

ax.set_title("Using AutoLocator - how2matplotlib.com")
ax.set_xlabel("X axis")
ax.set_ylabel("Y axis")

plt.show()
在这个例子中,我们创建了一个AutoLocator实例,并通过nbins参数设置了大致的刻度数量。这给了AutoLocator一个参考,但它仍然会根据数据范围选择最合适的刻度间隔。
7. 使用IndexLocator定位器
IndexLocator定位器适用于当x轴表示索引或序号时。它可以设置固定间隔的索引刻度。
示例代码:
import matplotlib.pyplot as plt
import numpy as np
from matplotlib.ticker import IndexLocator

# 创建数据
x = np.arange(0, 100)
y = np.random.randn(100).cumsum()

# 创建图表
fig, ax = plt.subplots(figsize=(10, 6))
ax.plot(x, y)

# 设置x轴刻度为每10个索引显示一次
ax.xaxis.set_major_locator(IndexLocator(base=10, offset=0))

ax.set_title("Using IndexLocator - how2matplotlib.com")
ax.set_xlabel("Index")
ax.set_ylabel("Cumulative Sum")

plt.show()
Output:
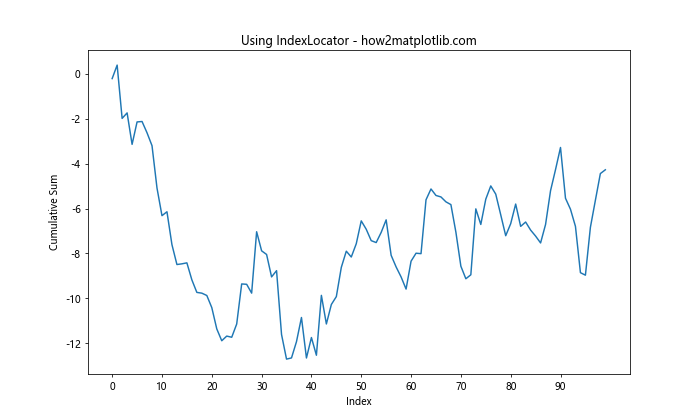
在这个例子中,我们使用IndexLocator(base=10, offset=0)设置x轴每10个索引显示一次刻度。这种方法特别适用于显示时间序列或其他有序数据。
8. 使用FixedLocator定位器
FixedLocator允许我们手动指定刻度位置,类似于set_xticks()和set_yticks()方法,但它作为一个定位器对象更加灵活。
示例代码:
import matplotlib.pyplot as plt
import numpy as np
from matplotlib.ticker import FixedLocator

# 创建数据
x = np.linspace(0, 10, 100)
y = np.sin(x) * np.exp(-x/5)

# 创建图表
fig, ax = plt.subplots(figsize=(10, 6))
ax.plot(x, y)

# 设置x轴固定刻度位置
x_ticks = [0, 2.5, 5, 7.5, 10]
ax.xaxis.set_major_locator(FixedLocator(x_ticks))

# 设置y轴固定刻度位置
y_ticks = [-0.5, 0, 0.5, 1]
ax.yaxis.set_major_locator(FixedLocator(y_ticks))

ax.set_title("Using FixedLocator - how2matplotlib.com")
ax.set_xlabel("X axis")
ax.set_ylabel("Y axis")

plt.show()
Output:
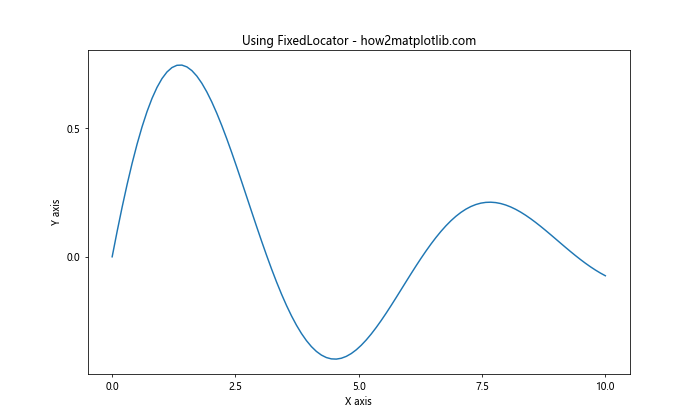
在这个例子中,我们使用FixedLocator为x轴和y轴设置了固定的刻度位置。这种方法适用于当你需要在特定位置显示刻度时。
9. 使用LinearLocator定位器
LinearLocator定位器可以在给定的范围内创建等间隔的刻度。
示例代码:
import matplotlib.pyplot as plt
import numpy as np
from matplotlib.ticker import LinearLocator

# 创建数据
x = np.linspace(0, 10, 100)
y = np.sin(x) * np.cos(x/2)

# 创建图表
fig, ax = plt.subplots(figsize=(10, 6))
ax.plot(x, y)

# 设置x轴使用LinearLocator,创建6个等间隔刻度
ax.xaxis.set_major_locator(LinearLocator(6))

# 设置y轴使用LinearLocator,创建5个等间隔刻度
ax.yaxis.set_major_locator(LinearLocator(5))

ax.set_title("Using LinearLocator - how2matplotlib.com")
ax.set_xlabel("X axis")
ax.set_ylabel("Y axis")

plt.show()
Output:
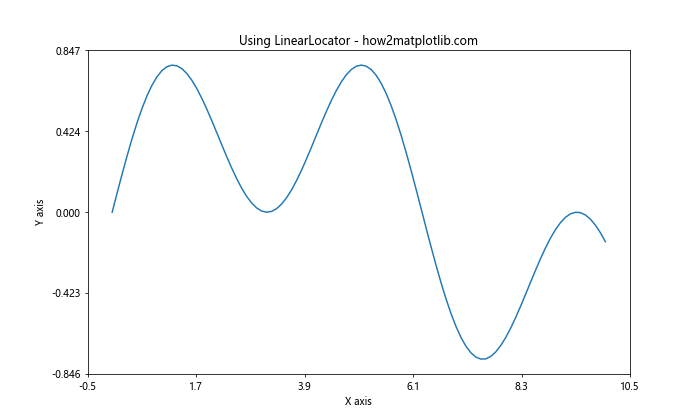
在这个例子中,我们使用LinearLocator(6)为x轴创建6个等间隔刻度,使用LinearLocator(5)为y轴创建5个等间隔刻度。这种方法适用于需要在整个数据范围内均匀分布刻度的情况。
10. 使用自定义定位器
有时,内置的定位器可能无法满足特定需求。在这种情况下,我们可以创建自定义定位器。
示例代码:
import matplotlib.pyplot as plt
import numpy as np
from matplotlib.ticker import Locator

class CustomLocator(Locator):
    def __init__(self, base=1.0):
        self.base = base

    def __call__(self):
        vmin, vmax = self.axis.get_view_interval()
        return self.tick_values(vmin, vmax)

    def tick_values(self, vmin, vmax):
        ticks = []
        tick = np.ceil(vmin / self.base) * self.base
        while tick <= vmax:
            ticks.append(tick)
            tick += self.base
        return ticks

# 创建数据
x = np.linspace(0, 10, 100)
y = np.sin(x) * np.exp(-x/5)

# 创建图表
fig, ax = plt.subplots(figsize=(10, 6))
ax.plot(x, y)

# 使用自定义定位器
ax.xaxis.set_major_locator(CustomLocator(base=1.5))

ax.set_title("Using Custom Locator - how2matplotlib.com")
ax.set_xlabel("X axis")
ax.set_ylabel("Y axis")

plt.show()
Output:
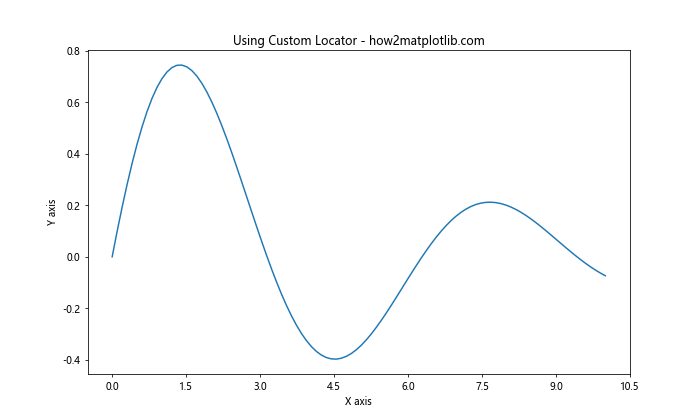
在这个例子中,我们创建了一个CustomLocator类,它生成以指定基数为间隔的刻度。这种方法允许我们根据特定需求创建完全自定义的刻度分布。
11. 调整次要刻度
除了主刻度外,我们还可以调整次要刻度的频率。次要刻度通常用于在主刻度之间提供更细致的刻度标记。
示例代码:
import matplotlib.pyplot as plt
import numpy as np
from matplotlib.ticker import MultipleLocator

# 创建数据
x = np.linspace(0, 10, 100)
y = np.sin(x) * np.cos(x)

# 创建图表
fig, ax = plt.subplots(figsize=(10, 6))
ax.plot(x, y)

# 设置主刻度
ax.xaxis.set_major_locator(MultipleLocator(2))
ax.yaxis.set_major_locator(MultipleLocator(0.5))

# 设置次要刻度
ax.xaxis.set_minor_locator(MultipleLocator(0.5))
ax.yaxis.set_minor_locator(MultipleLocator(0.1))

ax.set_title("Adjusting Minor Ticks - how2matplotlib.com")
ax.set_xlabel("X axis")
ax.set_ylabel("Y axis")

# 显示网格线
ax.grid(which='major', linestyle='-', linewidth='0.5', color='red')
ax.grid(which='minor', linestyle=':', linewidth='0.5', color='black')

plt.show()
Output:
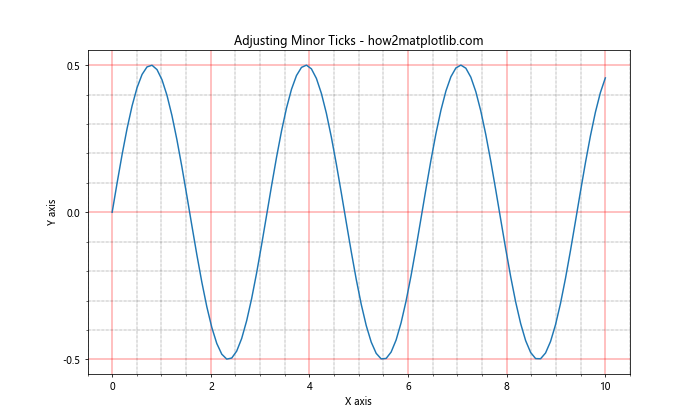
在这个例子中,我们使用MultipleLocator为x轴和y轴设置了主刻度和次要刻度。主刻度的间隔分别为2和0.5,次要刻度的间隔分别为0.5和0.1。我们还添加了网格线来突出显示刻度的位置。
12. 使用日期定位器
当处理时间序列数据时,我们可能需要特殊的日期定位器来调整刻度频率。
示例代码:
import matplotlib.pyplot as plt
import numpy as np
from matplotlib.dates import DateFormatter, DayLocator, MonthLocator
import datetime

# 创建日期数据
start_date = datetime.datetime(2023, 1, 1)
dates = [start_date + datetime.timedelta(days=i) for i in range(365)]
values = np.cumsum(np.random.randn(365))

# 创建图表
fig, ax = plt.subplots(figsize=(12, 6))
ax.plot(dates, values)

# 设置主刻度为每月1日
ax.xaxis.set_major_locator(MonthLocator())
ax.xaxis.set_major_formatter(DateFormatter('%Y-%m-%d'))

# 设置次要刻度为每天
ax.xaxis.set_minor_locator(DayLocator())

ax.set_title("Using Date Locators - how2matplotlib.com")
ax.set_xlabel("Date")
ax.set_ylabel("Value")

# 旋转日期标签
plt.setp(ax.xaxis.get_majorticklabels(), rotation=45, ha='right')

plt.tight_layout()
plt.show()
Output:
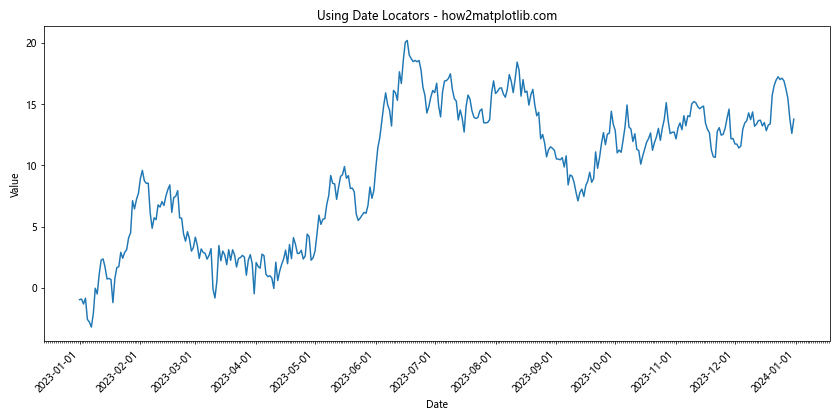
在这个例子中,我们使用MonthLocator()设置主刻度为每月1日,使用DayLocator()设置次要刻度为每天。我们还使用DateFormatter来格式化日期标签。
13. 对数刻度的调整
当处理跨越多个数量级的数据时,对数刻度可能更合适。我们可以调整对数刻度的基数和刻度频率。
示例代码:
import matplotlib.pyplot as plt
import numpy as np
from matplotlib.ticker import LogLocator, LogFormatter

# 创建数据
x = np.logspace(0, 5, 100)
y = x**2

# 创建图表
fig, ax = plt.subplots(figsize=(10, 6))
ax.plot(x, y)

# 设置对数刻度
ax.set_xscale('log')
ax.set_yscale('log')

# 设置x轴刻度
ax.xaxis.set_major_locator(LogLocator(base=10, numticks=6))
ax.xaxis.set_minor_locator(LogLocator(base=10, subs=np.arange(2, 10)))
ax.xaxis.set_major_formatter(LogFormatter(base=10, labelOnlyBase=False))

# 设置y轴刻度
ax.yaxis.set_major_locator(LogLocator(base=10, numticks=6))
ax.yaxis.set_minor_locator(LogLocator(base=10, subs=np.arange(2, 10)))
ax.yaxis.set_major_formatter(LogFormatter(base=10, labelOnlyBase=False))

ax.set_title("Adjusting Logarithmic Scale - how2matplotlib.com")
ax.set_xlabel("X axis (log scale)")
ax.set_ylabel("Y axis (log scale)")

plt.show()
Output:
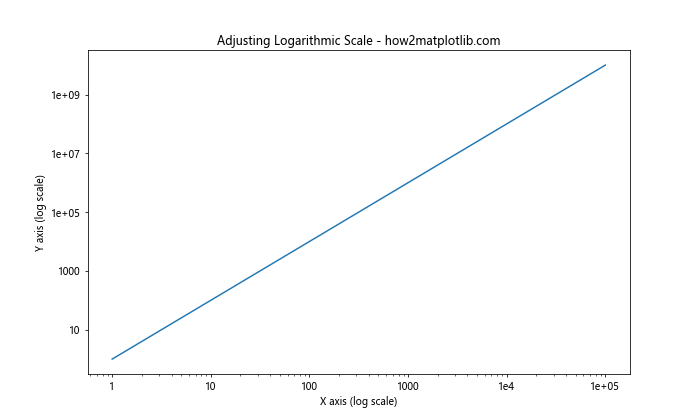
在这个例子中,我们使用LogLocator设置主刻度和次要刻度,使用LogFormatter格式化刻度标签。主刻度设置为10的幂,次要刻度设置为2到9之间的数字。
14. 极坐标图的刻度调整
对于极坐标图,我们需要分别调整角度和半径的刻度。
示例代码:
import matplotlib.pyplot as plt
import numpy as np
from matplotlib.ticker import MultipleLocator

# 创建数据
theta = np.linspace(0, 2*np.pi, 100)
r = np.abs(np.sin(2*theta) * np.cos(2*theta))

# 创建极坐标图
fig, ax = plt.subplots(figsize=(8, 8), subplot_kw=dict(projection='polar'))
ax.plot(theta, r)

# 设置角度刻度
ax.set_thetagrids(np.arange(0, 360, 45))

# 设置半径刻度
ax.set_rgrids(np.arange(0.2, 1.1, 0.2))

ax.set_title("Adjusting Polar Plot Ticks - how2matplotlib.com")

plt.show()
Output:
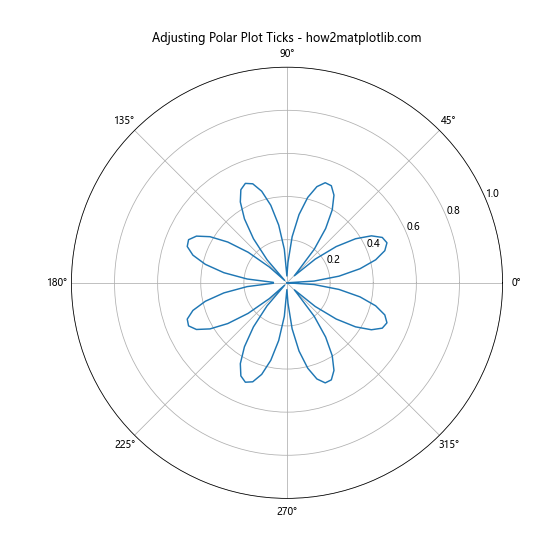
在这个例子中,我们使用set_thetagrids()设置角度刻度,使用set_rgrids()设置半径刻度。角度刻度设置为每45度一个,半径刻度设置为从0.2到1.0,间隔为0.2。
15. 3D图的刻度调整
对于3D图,我们需要分别调整x、y和z轴的刻度。
示例代码:
import matplotlib.pyplot as plt
import numpy as np
from mpl_toolkits.mplot3d import Axes3D
from matplotlib.ticker import MultipleLocator

# 创建数据
x = np.linspace(-5, 5, 100)
y = np.linspace(-5, 5, 100)
X, Y = np.meshgrid(x, y)
Z = np.sin(np.sqrt(X**2 + Y**2))

# 创建3D图
fig = plt.figure(figsize=(10, 8))
ax = fig.add_subplot(111, projection='3d')
surf = ax.plot_surface(X, Y, Z, cmap='viridis')

# 设置x轴刻度
ax.xaxis.set_major_locator(MultipleLocator(2))
ax.xaxis.set_minor_locator(MultipleLocator(0.5))

# 设置y轴刻度
ax.yaxis.set_major_locator(MultipleLocator(2))
ax.yaxis.set_minor_locator(MultipleLocator(0.5))

# 设置z轴刻度
ax.zaxis.set_major_locator(MultipleLocator(0.5))
ax.zaxis.set_minor_locator(MultipleLocator(0.1))

ax.set_title("Adjusting 3D Plot Ticks - how2matplotlib.com")
ax.set_xlabel("X axis")
ax.set_ylabel("Y axis")
ax.set_zlabel("Z axis")

plt.show()
Output:
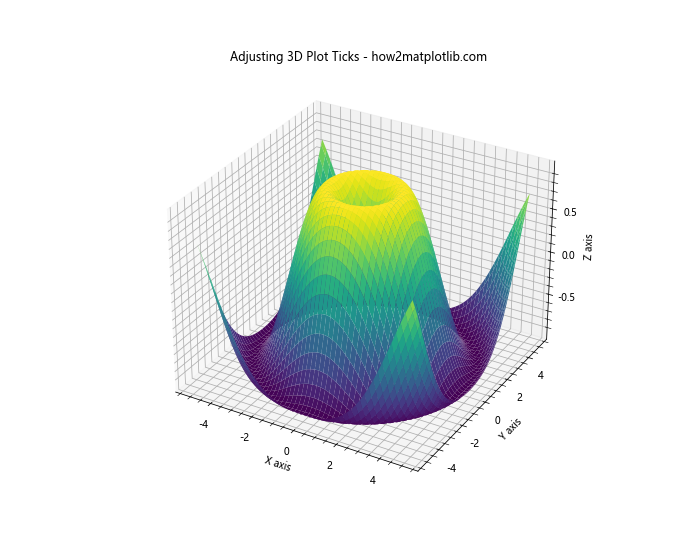
在这个例子中,我们使用MultipleLocator为x、y和z轴设置主刻度和次要刻度。x和y轴的主刻度间隔为2,次要刻度间隔为0.5;z轴的主刻度间隔为0.5,次要刻度间隔为0.1。
16. 使用FuncFormatter自定义刻度标签
有时我们可能需要自定义刻度标签的格式。FuncFormatter允许我们使用自定义函数来格式化刻度标签。
示例代码:
import matplotlib.pyplot as plt
import numpy as np
from matplotlib.ticker import FuncFormatter

def currency_formatter(x, p):
    return f"${x:,.2f}"

# 创建数据
x = np.linspace(0, 10, 11)
y = x**2 * 1000

# 创建图表
fig, ax = plt.subplots(figsize=(10, 6))
ax.plot(x, y)

# 设置y轴格式化器
ax.yaxis.set_major_formatter(FuncFormatter(currency_formatter))

ax.set_title("Custom Tick Formatter - how2matplotlib.com")
ax.set_xlabel("X axis")
ax.set_ylabel("Y axis (USD)")

plt.show()
Output:
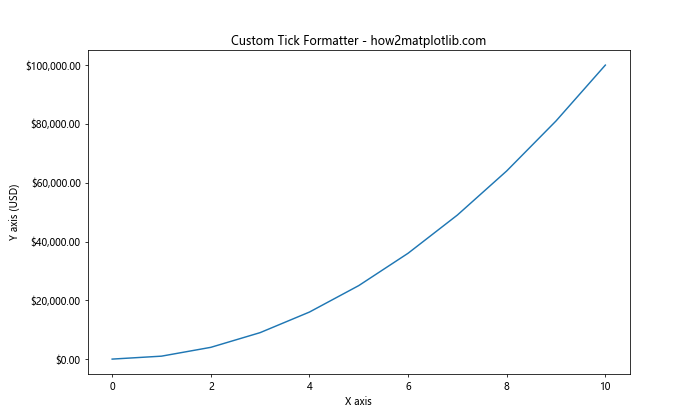
在这个例子中,我们定义了一个currency_formatter函数来将数值格式化为美元金额。然后我们使用FuncFormatter将这个函数应用到y轴的刻度标签上。
17. 调整刻度标签的旋转和对齐
有时,刻度标签可能会重叠,特别是在x轴上。我们可以通过旋转和对齐刻度标签来解决这个问题。
示例代码:
import matplotlib.pyplot as plt
import numpy as np

# 创建数据
x = np.arange(10)
y = np.random.rand(10)

# 创建图表
fig, ax = plt.subplots(figsize=(10, 6))
ax.bar(x, y)

# 设置x轴刻度标签
ax.set_xticks(x)
ax.set_xticklabels([f'Label {i}\nHow2Matplotlib' for i in x], rotation=45, ha='right')

ax.set_title("Rotating and Aligning Tick Labels - how2matplotlib.com")
ax.set_xlabel("X axis")
ax.set_ylabel("Y axis")

plt.tight_layout()
plt.show()
Output:
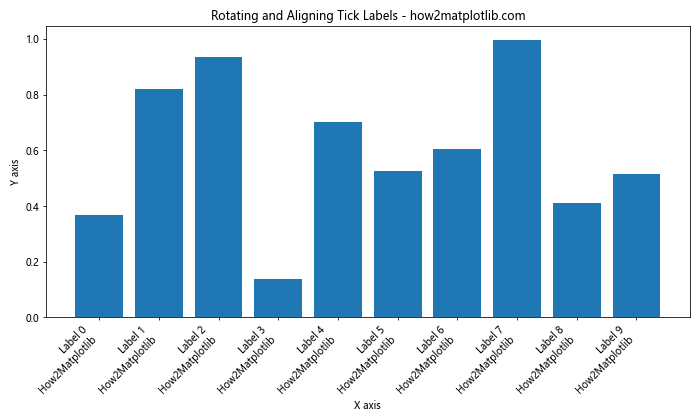
在这个例子中,我们使用set_xticklabels()方法设置x轴的刻度标签,并通过rotation参数将标签旋转45度,通过ha='right'参数将标签右对齐。
18. 使用SymmetricalLogLocator处理正负值
当数据包含正负值且跨越多个数量级时,SymmetricalLogLocator可能是一个好选择。
示例代码:
import matplotlib.pyplot as plt
import numpy as np
from matplotlib.ticker import SymmetricalLogLocator, SymmetricalLogFormatter

# 创建数据
x = np.linspace(-1000, 1000, 1000)
y = x**3 - x

# 创建图表
fig, ax = plt.subplots(figsize=(10, 6))
ax.plot(x, y)

# 设置y轴为对称对数刻度
ax.set_yscale('symlog', linthresh=10)
ax.yaxis.set_major_locator(SymmetricalLogLocator(linthresh=10, base=10))
ax.yaxis.set_major_formatter(SymmetricalLogFormatter(linthresh=10, base=10))

ax.set_title("Using SymmetricalLogLocator - how2matplotlib.com")
ax.set_xlabel("X axis")
ax.set_ylabel("Y axis (symlog scale)")

plt.show()
在这个例子中,我们使用SymmetricalLogLocator和SymmetricalLogFormatter来处理y轴上的正负值。linthresh参数定义了线性区域的阈值,在这个阈值之外使用对数刻度。
19. 使用ScalarFormatter控制科学记数法
当处理非常大或非常小的数值时,Matplotlib默认会使用科学记数法。我们可以使用ScalarFormatter来控制这种行为。
示例代码:
import matplotlib.pyplot as plt
import numpy as np
from matplotlib.ticker import ScalarFormatter

# 创建数据
x = np.linspace(0, 1, 10)
y = x * 1e-5

# 创建图表
fig, (ax1, ax2) = plt.subplots(1, 2, figsize=(12, 5))

# 默认行为
ax1.plot(x, y)
ax1.set_title("Default Behavior - how2matplotlib.com")

# 使用ScalarFormatter
ax2.plot(x, y)
formatter = ScalarFormatter(useMathText=True)
formatter.set_scientific(False)
ax2.yaxis.set_major_formatter(formatter)
ax2.set_title("Using ScalarFormatter - how2matplotlib.com")

for ax in (ax1, ax2):
    ax.set_xlabel("X axis")
    ax.set_ylabel("Y axis")

plt.tight_layout()
plt.show()
Output:
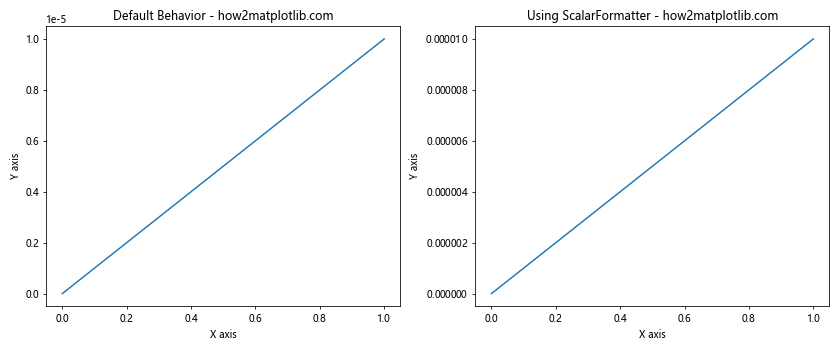
在这个例子中,我们创建了两个子图来对比默认行为和使用ScalarFormatter的结果。通过设置set_scientific(False),我们禁用了科学记数法,使得小数值以完整形式显示。
20. 使用MultipleLocator和FormatStrFormatter组合
我们可以组合使用MultipleLocator和FormatStrFormatter来精确控制刻度的位置和格式。
示例代码:
import matplotlib.pyplot as plt
import numpy as np
from matplotlib.ticker import MultipleLocator, FormatStrFormatter

# 创建数据
x = np.linspace(0, 10, 100)
y = np.sin(x)

# 创建图表
fig, ax = plt.subplots(figsize=(10, 6))
ax.plot(x, y)

# 设置x轴刻度
ax.xaxis.set_major_locator(MultipleLocator(2))
ax.xaxis.set_major_formatter(FormatStrFormatter('%.1f'))

# 设置y轴刻度
ax.yaxis.set_major_locator(MultipleLocator(0.5))
ax.yaxis.set_major_formatter(FormatStrFormatter('%.2f'))

ax.set_title("Combining MultipleLocator and FormatStrFormatter - how2matplotlib.com")
ax.set_xlabel("X axis")
ax.set_ylabel("Y axis")

plt.show()
Output:
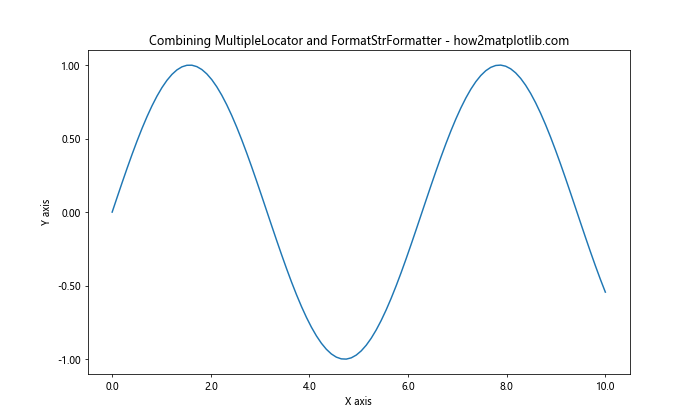
在这个例子中,我们使用MultipleLocator设置x轴和y轴的刻度间隔,然后使用FormatStrFormatter设置刻度标签的格式。x轴的刻度间隔为2,标签格式为一位小数;y轴的刻度间隔为0.5,标签格式为两位小数。
总结
调整Matplotlib中x轴或y轴的刻度频率是一项重要的技能,可以大大提高图表的可读性和美观度。本文详细介绍了多种方法和技巧,包括:
- 使用基本的
set_xticks()和set_yticks()方法 - 利用各种定位器如
MultipleLocator、MaxNLocator、LogLocator等 - 创建自定义定位器
- 调整次要刻度
- 处理日期和时间数据的刻度
- 调整对数刻度和极坐标图的刻度
- 3D图的刻度调整
- 使用格式化器自定义刻度标签
- 旋转和对齐刻度标签
- 处理正负值和科学记数法
在实际应用中,选择合适的方法取决于数据的性质和图表的具体需求。通过灵活运用这些技巧,我们可以创建出既准确又美观的数据可视化图表。
需要注意的是,刻度的调整应该与数据的特性相匹配,既不能过于稀疏导致信息丢失,也不能过于密集导致图表混乱。同时,刻度的调整还应考虑到图表的整体布局和美观性。
在进行刻度调整时,建议多尝试不同的方法,并结合实际需求进行微调。有时候,看似微小的调整可能会对图表的整体效果产生显著影响。
最后,随着Matplotlib的不断更新,可能会有新的功能和方法被引入。因此,建议经常查阅Matplotlib的官方文档,了解最新的特性和最佳实践。
通过掌握这些技巧,我们可以更好地控制Matplotlib图表的刻度频率,创建出更加专业和有说服力的数据可视化作品。无论是进行数据分析、科学研究还是商业报告,这些技能都将大有帮助。
希望本文能够帮助你更好地理解和使用Matplotlib中的刻度调整功能。记住,实践是掌握这些技巧的最好方法,所以不要犹豫,立即开始尝试这些方法,创建你自己的精美图表吧!
 极客教程
极客教程