Matplotlib中如何调整误差线的粗细:全面指南
参考:Change the error bar thickness in Matplotlib
在数据可视化中,误差线是表示数据不确定性或变异性的重要工具。Matplotlib作为Python中最流行的绘图库之一,提供了强大的功能来创建和自定义误差线。本文将深入探讨如何在Matplotlib中调整误差线的粗细,以及与之相关的各种技巧和最佳实践。
1. 误差线的基本概念
误差线(Error bars)是数据可视化中用来表示测量或估计不确定性的图形元素。它们通常以垂直或水平线段的形式出现在数据点周围,指示数据的可能变化范围。
在Matplotlib中,我们可以使用errorbar()函数来添加误差线。这个函数允许我们指定数据点的位置以及相应的误差值。
让我们从一个简单的例子开始:
import matplotlib.pyplot as plt
import numpy as np

x = np.linspace(0, 10, 5)
y = np.sin(x)
yerr = 0.2 * np.ones_like(y)

plt.figure(figsize=(8, 6))
plt.errorbar(x, y, yerr=yerr, fmt='o', capsize=5)
plt.title('Basic Error Bars - how2matplotlib.com')
plt.xlabel('X-axis')
plt.ylabel('Y-axis')
plt.show()
Output:
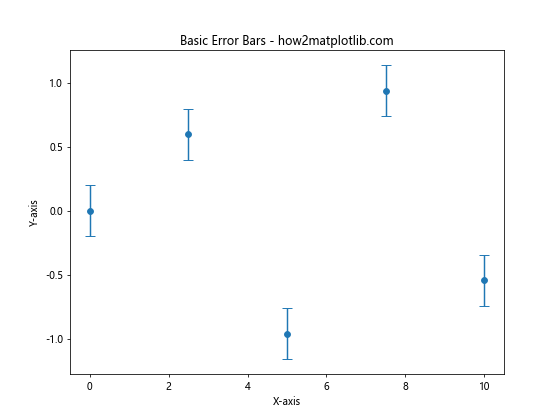
在这个例子中,我们创建了一个简单的正弦曲线,并为每个数据点添加了固定大小的误差线。fmt='o'参数指定数据点使用圆形标记,capsize=5设置误差线端点的大小。
2. 调整误差线的粗细
调整误差线的粗细是自定义误差线外观的重要方面。Matplotlib提供了多种方法来实现这一目标。
2.1 使用linewidth参数
最直接的方法是使用errorbar()函数的linewidth参数(或其缩写lw)。这个参数控制误差线的粗细。
import matplotlib.pyplot as plt
import numpy as np

x = np.linspace(0, 10, 5)
y = np.cos(x)
yerr = 0.1 + 0.2 * np.random.rand(len(x))

plt.figure(figsize=(8, 6))
plt.errorbar(x, y, yerr=yerr, fmt='o', capsize=5, linewidth=2)
plt.title('Thicker Error Bars - how2matplotlib.com')
plt.xlabel('X-axis')
plt.ylabel('Y-axis')
plt.show()
Output:
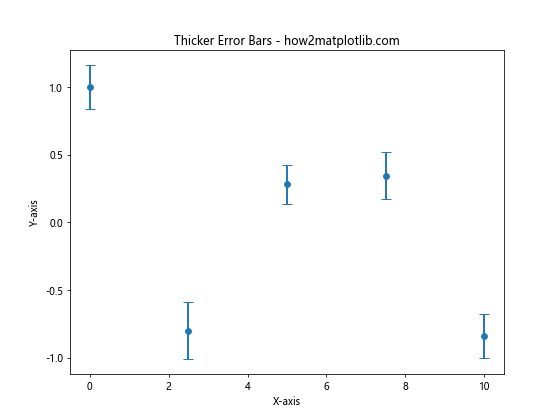
在这个例子中,我们将linewidth设置为2,使误差线变得更粗。你可以根据需要调整这个值,更大的值会产生更粗的线条。
2.2 分别设置误差线和端点的粗细
有时,你可能想要分别控制误差线主体和端点(caps)的粗细。Matplotlib允许我们通过elinewidth和capthick参数来实现这一点。
import matplotlib.pyplot as plt
import numpy as np

x = np.linspace(0, 10, 5)
y = np.exp(-x/10)
yerr = 0.1 * y

plt.figure(figsize=(8, 6))
plt.errorbar(x, y, yerr=yerr, fmt='o', capsize=5, elinewidth=3, capthick=1.5)
plt.title('Custom Error Bar and Cap Thickness - how2matplotlib.com')
plt.xlabel('X-axis')
plt.ylabel('Y-axis')
plt.show()
Output:
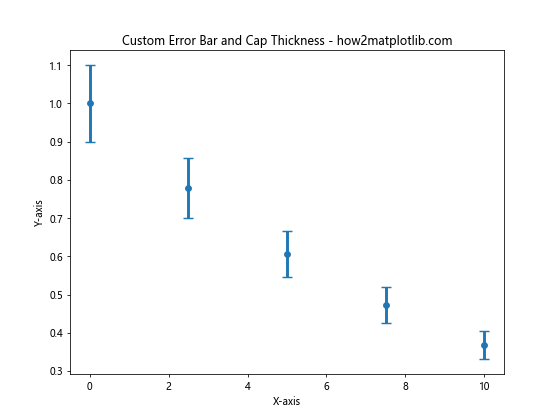
在这个例子中,elinewidth=3设置误差线主体的粗细,而capthick=1.5设置端点的粗细。这种方法让你能够更精细地控制误差线的外观。
3. 高级误差线自定义
除了调整粗细,Matplotlib还提供了许多其他方式来自定义误差线的外观。
3.1 改变误差线的颜色
你可以使用ecolor参数来改变误差线的颜色:
import matplotlib.pyplot as plt
import numpy as np

x = np.linspace(0, 10, 5)
y = np.log(x + 1)
yerr = 0.2 * np.random.rand(len(x))

plt.figure(figsize=(8, 6))
plt.errorbar(x, y, yerr=yerr, fmt='o', capsize=5, ecolor='red', linewidth=2)
plt.title('Colored Error Bars - how2matplotlib.com')
plt.xlabel('X-axis')
plt.ylabel('Y-axis')
plt.show()
Output:
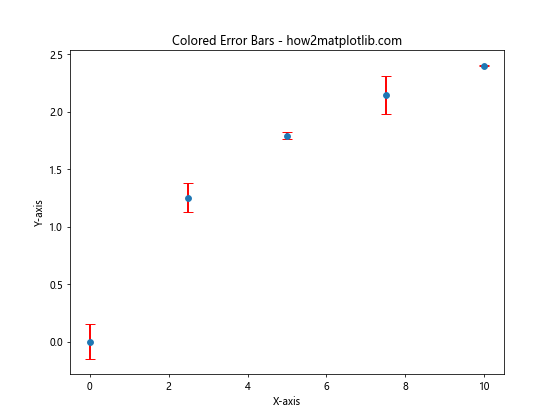
这个例子将误差线的颜色设置为红色,使其在图表中更加突出。
3.2 使用不同的线型
你可以使用ls(或linestyle)参数来改变误差线的线型:
import matplotlib.pyplot as plt
import numpy as np

x = np.linspace(0, 10, 5)
y = x**2
yerr = 5 * np.random.rand(len(x))

plt.figure(figsize=(8, 6))
plt.errorbar(x, y, yerr=yerr, fmt='o', capsize=5, linewidth=2, ls='--')
plt.title('Dashed Error Bars - how2matplotlib.com')
plt.xlabel('X-axis')
plt.ylabel('Y-axis')
plt.show()
Output:
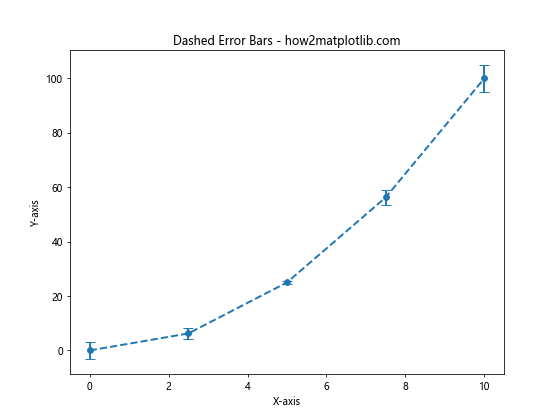
这个例子使用虚线('--')作为误差线的线型,你也可以尝试其他线型如点线(':')或点划线('-.')。
3.3 添加水平误差线
到目前为止,我们只展示了垂直误差线。但Matplotlib也支持水平误差线,或者同时显示水平和垂直误差线:
import matplotlib.pyplot as plt
import numpy as np

x = np.linspace(0, 10, 5)
y = np.sin(x) * np.exp(-x/10)
xerr = 0.5 * np.random.rand(len(x))
yerr = 0.2 * np.random.rand(len(y))

plt.figure(figsize=(8, 6))
plt.errorbar(x, y, xerr=xerr, yerr=yerr, fmt='o', capsize=5, linewidth=1.5)
plt.title('Horizontal and Vertical Error Bars - how2matplotlib.com')
plt.xlabel('X-axis')
plt.ylabel('Y-axis')
plt.show()
Output:
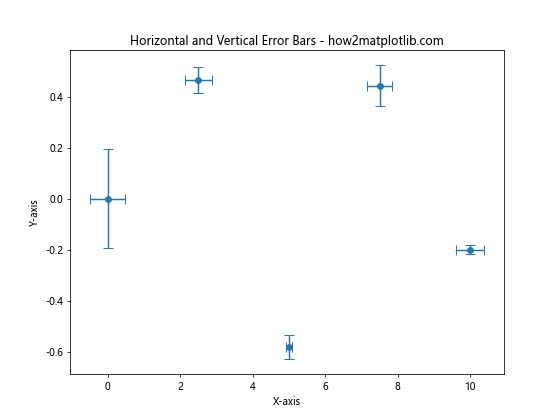
这个例子同时显示了水平和垂直误差线,为数据点提供了更全面的不确定性表示。
4. 误差线与其他绘图元素的结合
误差线通常与其他绘图元素结合使用,以创建更丰富、更有信息量的可视化。
4.1 误差线与线图结合
你可以将误差线与线图结合,以显示数据的趋势和不确定性:
import matplotlib.pyplot as plt
import numpy as np

x = np.linspace(0, 10, 10)
y = np.sin(x) + 0.1 * np.random.randn(len(x))
yerr = 0.2 * np.ones_like(y)

plt.figure(figsize=(8, 6))
plt.errorbar(x, y, yerr=yerr, fmt='-o', capsize=5, linewidth=1, elinewidth=1, capthick=1)
plt.title('Error Bars with Line Plot - how2matplotlib.com')
plt.xlabel('X-axis')
plt.ylabel('Y-axis')
plt.show()
Output:
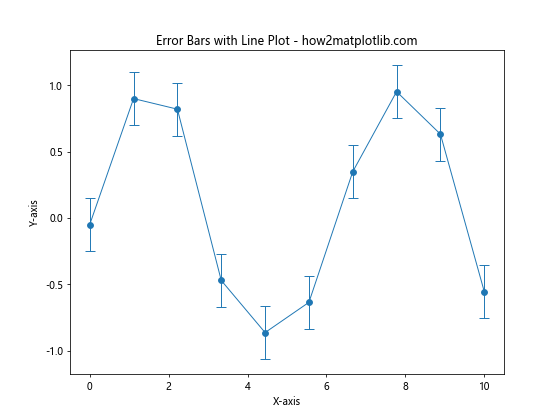
在这个例子中,fmt='-o'参数同时绘制了线条和数据点,误差线则显示了每个点的不确定性范围。
4.2 误差线与填充区域结合
有时,你可能想要用填充区域来表示误差范围,而不是使用传统的误差线:
import matplotlib.pyplot as plt
import numpy as np

x = np.linspace(0, 10, 50)
y = np.sin(x)
yerr = 0.2 * np.ones_like(y)

plt.figure(figsize=(8, 6))
plt.plot(x, y, 'b-', label='Data')
plt.fill_between(x, y-yerr, y+yerr, alpha=0.3)
plt.title('Error Range as Filled Area - how2matplotlib.com')
plt.xlabel('X-axis')
plt.ylabel('Y-axis')
plt.legend()
plt.show()
Output:
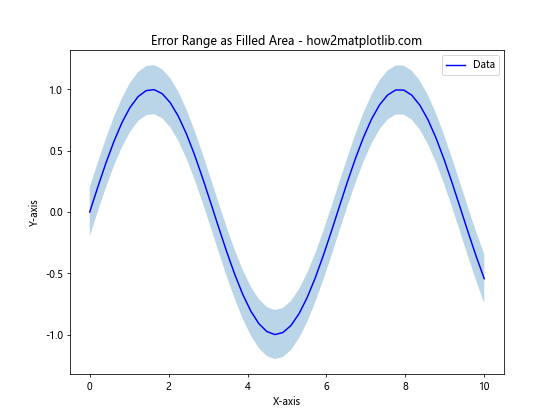
这个例子使用fill_between()函数创建了一个填充区域来表示误差范围,alpha=0.3参数使填充区域半透明。
5. 处理不对称误差
有时,数据的上下误差可能不相等。Matplotlib允许你为每个数据点指定不同的上下误差值。
import matplotlib.pyplot as plt
import numpy as np

x = np.linspace(0, 10, 5)
y = np.exp(x/10)
yerr = [0.1 * y, 0.2 * y]  # [下误差, 上误差]

plt.figure(figsize=(8, 6))
plt.errorbar(x, y, yerr=yerr, fmt='o', capsize=5, linewidth=2)
plt.title('Asymmetric Error Bars - how2matplotlib.com')
plt.xlabel('X-axis')
plt.ylabel('Y-axis')
plt.yscale('log')
plt.show()
Output:
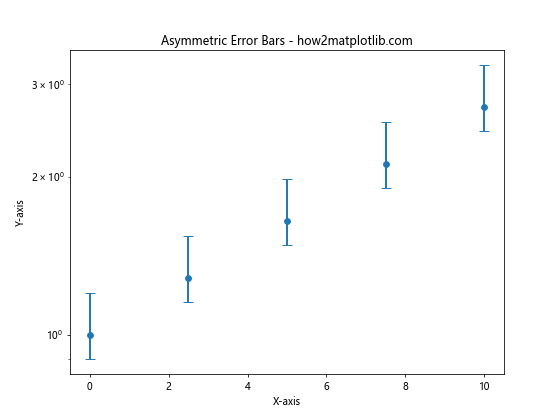
在这个例子中,我们为每个数据点指定了不同的上下误差值,yerr参数接受一个包含两个数组的列表,分别表示下误差和上误差。
6. 在子图中使用误差线
当你需要在一个图形中比较多组数据时,使用子图是一个很好的选择。以下是如何在子图中使用误差线的示例:
import matplotlib.pyplot as plt
import numpy as np

x = np.linspace(0, 10, 5)
y1 = np.sin(x)
y2 = np.cos(x)
yerr1 = 0.1 + 0.1 * np.random.rand(len(x))
yerr2 = 0.1 + 0.1 * np.random.rand(len(x))

fig, (ax1, ax2) = plt.subplots(1, 2, figsize=(12, 5))

ax1.errorbar(x, y1, yerr=yerr1, fmt='o-', capsize=5, linewidth=1.5, label='Sin')
ax1.set_title('Sine Function - how2matplotlib.com')
ax1.set_xlabel('X-axis')
ax1.set_ylabel('Y-axis')
ax1.legend()

ax2.errorbar(x, y2, yerr=yerr2, fmt='s-', capsize=5, linewidth=1.5, label='Cos')
ax2.set_title('Cosine Function - how2matplotlib.com')
ax2.set_xlabel('X-axis')
ax2.set_ylabel('Y-axis')
ax2.legend()

plt.tight_layout()
plt.show()
Output:
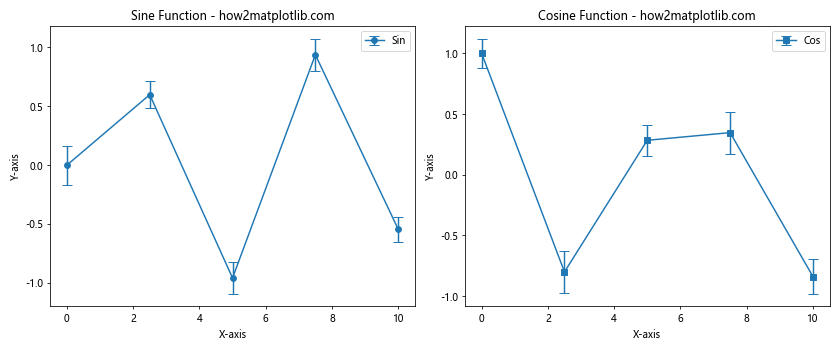
这个例子创建了两个子图,分别显示带有误差线的正弦和余弦函数。
7. 自定义误差线的端点样式
Matplotlib允许你自定义误差线端点的样式。你可以使用不同的标记来替代默认的直线端点:
import matplotlib.pyplot as plt
import numpy as np

x = np.linspace(0, 10, 5)
y = x**2
yerr = 10 * np.random.rand(len(x))

plt.figure(figsize=(8, 6))
plt.errorbar(x, y, yerr=yerr, fmt='o', capsize=0, linewidth=2,
             markeredgewidth=2, capthick=2,
             ecolor='red', markeredgecolor='blue',
             barsabove=True, errorevery=1,
             uplims=True, lolims=True)
plt.title('Custom Error Bar Caps - how2matplotlib.com')
plt.xlabel('X-axis')
plt.ylabel('Y-axis')
plt.show()
Output:
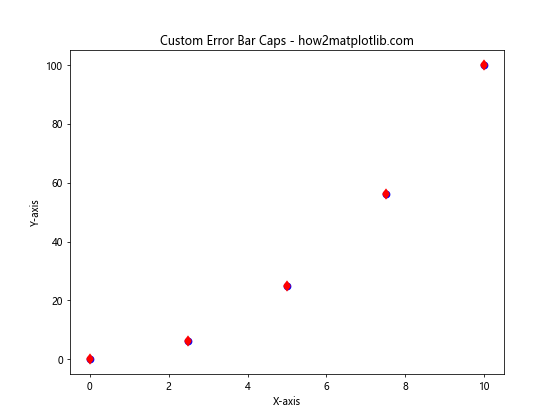
在这个例子中:
– capsize=0 移除了默认的端点
– uplims=True 和 lolims=True 在误差线的顶部和底部添加了箭头
– barsabove=True 使误差线绘制在数据点上方
– errorevery=1 为每个数据点都绘制误差线
8. 在3D图中使用误差线
Matplotlib也支持在3D图中使用误差线,尽管这需要一些额外的设置:
import matplotlib.pyplot as plt
import numpy as np
from mpl_toolkits.mplot3d import Axes3D

fig = plt.figure(figsize=(10, 8))
ax = fig.add_subplot(111, projection='3d')

x = np.linspace(0, 10, 5)
y = np.linspace(0, 10, 5)
z = x * y
zerr = 5 * np.random.rand(len(x))

ax.errorbar(x, y, z, zerr=zerr, fmt='o', ecolor='r', capthick=2, capsize=5)
ax.set_title('3D Error Bars - how2matplotlib.com')
ax.set_xlabel('X-axis')
ax.set_ylabel('Y-axis')
ax.set_zlabel('Z-axis')

plt.show()
Output:
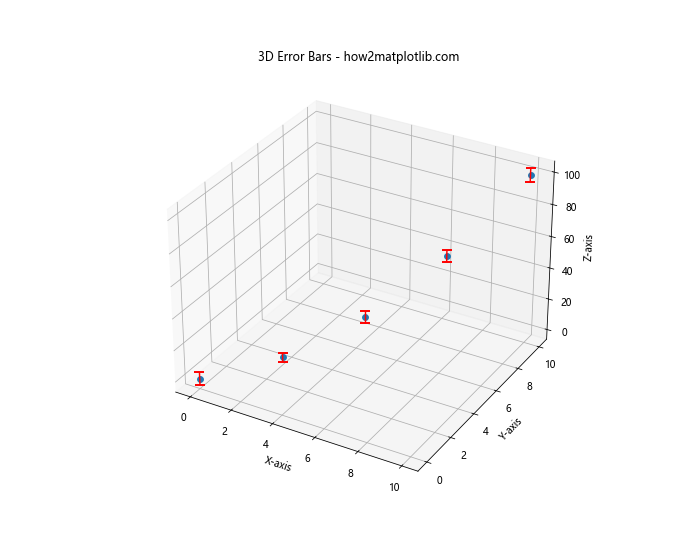
这个例子展示了如何在3D图中添加垂直误差线。注意,3D误差线的支持在Matplotlib中相对有限。
9. 使用误差线表示置信区间
误差线不仅可以用来表示测量误差,还可以用来表示统计学中的置信区间:
import matplotlib.pyplot as plt
import numpy as np
from scipy import stats

x = np.linspace(0, 10, 50)
y = 2 * x + 1 + np.random.normal(0,2, size=x.shape)

# 线性回归
slope, intercept, r_value, p_value, std_err = stats.linregress(x, y)
line = slope * x + intercept

# 计算置信区间
def predict_interval(x, y, x_pred):
    n = len(x)
    x_mean = np.mean(x)
    sum_x_sq = np.sum((x - x_mean)**2)
    se = np.sqrt(np.sum((y - (slope * x + intercept))**2) / (n - 2))
    syx = se * np.sqrt(1/n + (x_pred - x_mean)**2 / sum_x_sq)
    return syx

pred_interval = predict_interval(x, y, x)

plt.figure(figsize=(10, 6))
plt.scatter(x, y, label='Data')
plt.plot(x, line, 'r', label='Fitted line')
plt.fill_between(x, line - 1.96 * pred_interval, line + 1.96 * pred_interval,
                 alpha=0.2, label='95% Confidence Interval')
plt.title('Linear Regression with Confidence Interval - how2matplotlib.com')
plt.xlabel('X-axis')
plt.ylabel('Y-axis')
plt.legend()
plt.show()
Output:
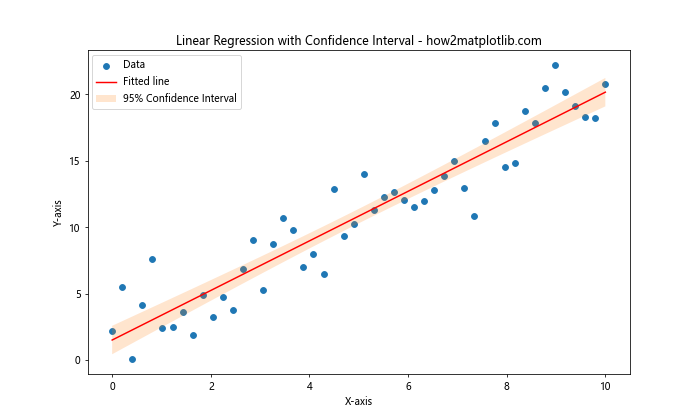
这个例子展示了如何使用误差线(或者更准确地说,误差区域)来表示线性回归的95%置信区间。
10. 误差线的动画效果
你甚至可以为误差线添加动画效果,使其在时间上变化:
import matplotlib.pyplot as plt
import matplotlib.animation as animation
import numpy as np

fig, ax = plt.subplots(figsize=(8, 6))

x = np.linspace(0, 2*np.pi, 100)
y = np.sin(x)
line, = ax.plot(x, y)
errorbar = ax.errorbar(x, y, yerr=0.1, fmt='none', ecolor='r', capsize=5)

ax.set_xlim(0, 2*np.pi)
ax.set_ylim(-1.5, 1.5)
ax.set_title('Animated Error Bars - how2matplotlib.com')

def animate(i):
    y = np.sin(x + i/10)
    yerr = 0.1 + 0.1 * np.sin(i/10)
    line.set_ydata(y)
    errorbar[0].set_ydata(y)
    new_segments = [np.array([[x, y-yerr], [x, y+yerr]]).T for x, y in zip(x, y)]
    errorbar[2][0].set_segments(new_segments)
    return errorbar

ani = animation.FuncAnimation(fig, animate, frames=100, interval=50, blit=False)
plt.show()
Output:
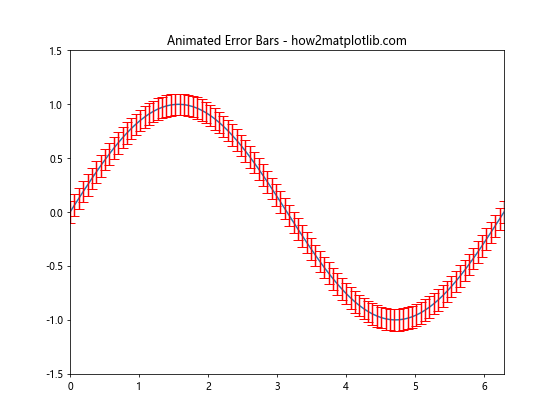
这个例子创建了一个动画,其中正弦波和相应的误差线随时间变化。
11. 使用误差线表示数据分布
误差线还可以用来表示数据的分布情况,例如四分位数范围:
import matplotlib.pyplot as plt
import numpy as np

np.random.seed(42)
data = [np.random.normal(0, std, 100) for std in range(1, 4)]

fig, ax = plt.subplots(figsize=(8, 6))

bp = ax.boxplot(data, patch_artist=True)

for median in bp['medians']:
    median.set(color='red', linewidth=2)

for box in bp['boxes']:
    box.set(facecolor='lightblue', edgecolor='blue', linewidth=2)

ax.set_xticklabels(['Group 1', 'Group 2', 'Group 3'])
ax.set_title('Box Plot with Error Bars - how2matplotlib.com')
ax.set_ylabel('Value')

plt.show()
Output:
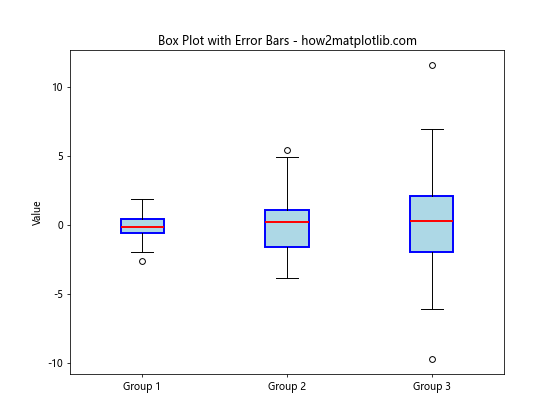
这个例子使用箱线图来显示数据的分布,其中的”误差线”实际上表示了数据的四分位范围和极值。
12. 在极坐标图中使用误差线
Matplotlib也支持在极坐标图中使用误差线:
import matplotlib.pyplot as plt
import numpy as np

theta = np.linspace(0, 2*np.pi, 8, endpoint=False)
radii = 10 * np.random.rand(8)
width = np.pi/4 * np.random.rand(8)
colors = plt.cm.viridis(radii / 10.)

fig = plt.figure(figsize=(8, 8))
ax = fig.add_subplot(111, projection='polar')
bars = ax.bar(theta, radii, width=width, bottom=0.0, color=colors, alpha=0.5)

for r, bar in zip(radii, bars):
    bar.set_alpha(0.5)
    bar.set_edgecolor('white')
    ax.errorbar(bar.get_x() + bar.get_width()/2, r, yerr=1, capsize=5, color='red')

ax.set_title('Polar Plot with Error Bars - how2matplotlib.com')
plt.show()
Output:
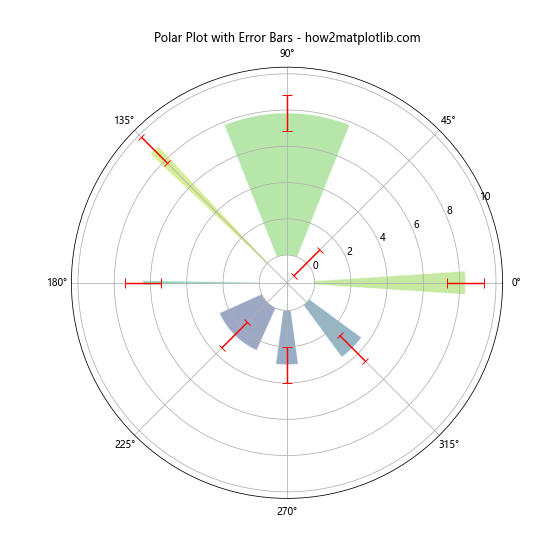
这个例子在极坐标系中创建了一个条形图,并为每个条形添加了误差线。
13. 使用误差线表示数据的上下限
有时,你可能想要使用误差线来表示数据的上下限,而不是标准误差:
import matplotlib.pyplot as plt
import numpy as np

categories = ['A', 'B', 'C', 'D', 'E']
values = np.random.randint(50, 100, size=len(categories))
min_values = values - np.random.randint(10, 30, size=len(categories))
max_values = values + np.random.randint(10, 30, size=len(categories))

fig, ax = plt.subplots(figsize=(10, 6))

ax.bar(categories, values, yerr=[values-min_values, max_values-values],
       capsize=5, color='skyblue', ecolor='black')

ax.set_ylabel('Value')
ax.set_title('Bar Chart with Min-Max Error Bars - how2matplotlib.com')
ax.spines['top'].set_visible(False)
ax.spines['right'].set_visible(False)

plt.show()
Output:
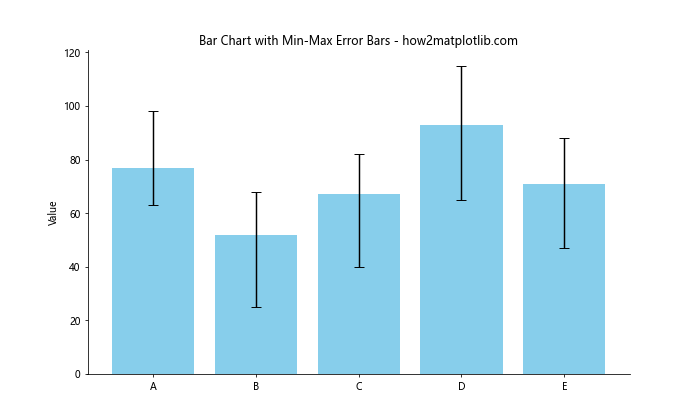
这个例子创建了一个条形图,误差线表示每个类别数据的最小值和最大值。
结论
调整误差线的粗细只是Matplotlib中自定义误差线的众多方法之一。通过本文介绍的各种技巧和示例,你应该能够根据自己的需求创建出既美观又信息丰富的误差线图表。记住,好的数据可视化不仅要准确传达信息,还要易于理解和解释。在使用误差线时,始终要考虑你的目标受众和你想要传达的核心信息。
 极客教程
极客教程