Matplotlib中如何调整图表大小:全面指南
参考:Change plot size in Matplotlib
Matplotlib是Python中最流行的数据可视化库之一,它提供了丰富的功能来创建各种类型的图表和绘图。在使用Matplotlib时,调整图表大小是一个常见且重要的任务。本文将详细介绍如何在Matplotlib中改变图表大小,包括不同的方法、参数设置以及一些实用技巧。
1. 基本概念
在开始学习如何调整图表大小之前,我们需要了解一些基本概念:
1.1 Figure和Axes
- Figure:整个图形窗口
- Axes:图形窗口中的单个图表
理解这两个概念对于调整图表大小至关重要,因为我们可以分别调整整个Figure的大小和单个Axes的大小。
1.2 单位
Matplotlib中的大小通常以英寸为单位。1英寸约等于2.54厘米。
2. 使用figure()函数设置图表大小
最简单的调整图表大小的方法是使用plt.figure()函数。这个函数允许我们在创建新的Figure时指定其大小。
import matplotlib.pyplot as plt

plt.figure(figsize=(10, 6))
plt.plot([1, 2, 3, 4], [1, 4, 2, 3])
plt.title('How to change plot size in Matplotlib - how2matplotlib.com')
plt.show()
Output:
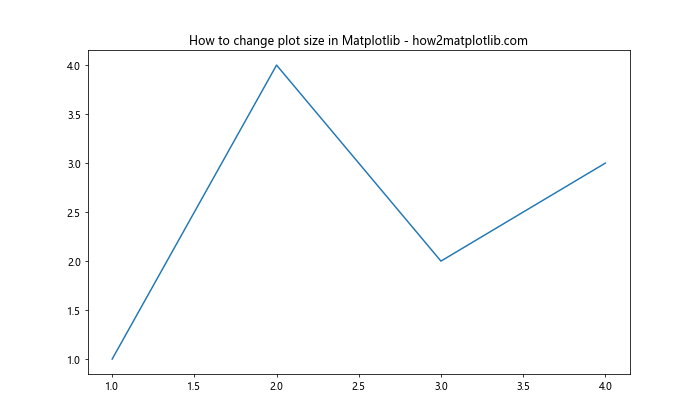
在这个例子中,我们创建了一个宽10英寸、高6英寸的Figure。figsize参数接受一个元组,其中第一个值是宽度,第二个值是高度。
3. 使用rcParams全局设置图表大小
如果你想为整个脚本或notebook设置默认的图表大小,可以使用plt.rcParams。
import matplotlib.pyplot as plt

plt.rcParams['figure.figsize'] = [10, 6]

plt.plot([1, 2, 3, 4], [1, 4, 2, 3])
plt.title('Default size changed - how2matplotlib.com')
plt.show()
Output:
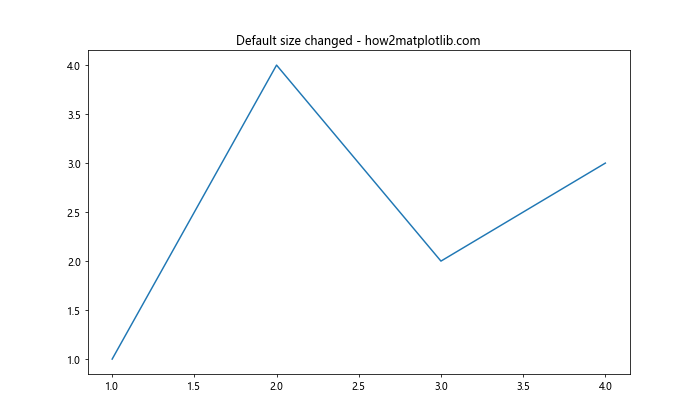
这个设置会影响之后创建的所有图表,除非你在创建特定图表时明确指定了不同的大小。
4. 调整子图大小
当你使用子图时,可以通过plt.subplots()函数来设置整个Figure的大小。
import matplotlib.pyplot as plt

fig, (ax1, ax2) = plt.subplots(1, 2, figsize=(12, 5))
ax1.plot([1, 2, 3, 4], [1, 4, 2, 3])
ax2.plot([1, 2, 3, 4], [3, 2, 4, 1])
fig.suptitle('Subplots with custom size - how2matplotlib.com')
plt.show()
Output:
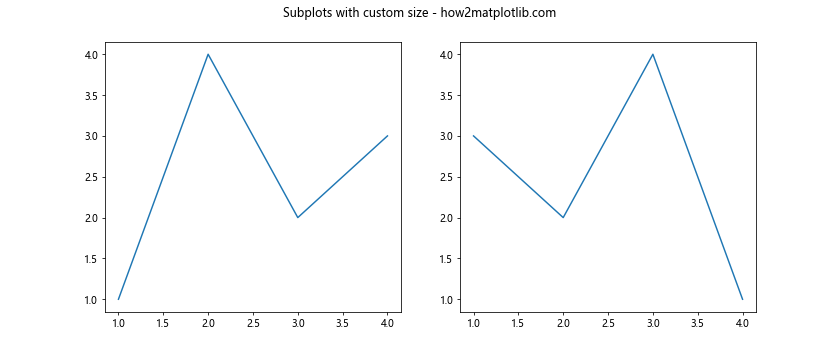
这个例子创建了一个包含两个子图的Figure,整个Figure的大小为12×5英寸。
5. 使用set_size_inches()方法
对于已经创建的Figure对象,你可以使用set_size_inches()方法来调整其大小。
import matplotlib.pyplot as plt

fig, ax = plt.subplots()
ax.plot([1, 2, 3, 4], [1, 4, 2, 3])
fig.set_size_inches(10, 6)
plt.title('Size changed using set_size_inches() - how2matplotlib.com')
plt.show()
Output:
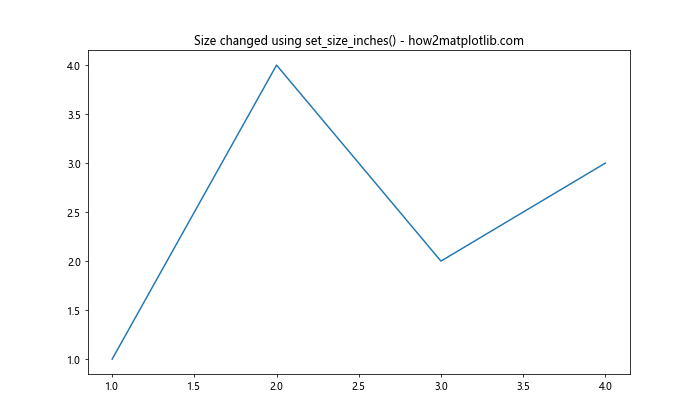
这个方法允许你在创建图表后动态地改变其大小。
6. 调整Axes的大小和位置
有时候,你可能只想调整Axes(实际绘图区域)的大小,而不是整个Figure的大小。这可以通过set_position()方法实现。
import matplotlib.pyplot as plt

fig, ax = plt.subplots(figsize=(10, 6))
ax.plot([1, 2, 3, 4], [1, 4, 2, 3])
ax.set_position([0.1, 0.1, 0.8, 0.8])  # [left, bottom, width, height]
plt.title('Axes size adjusted - how2matplotlib.com')
plt.show()
Output:
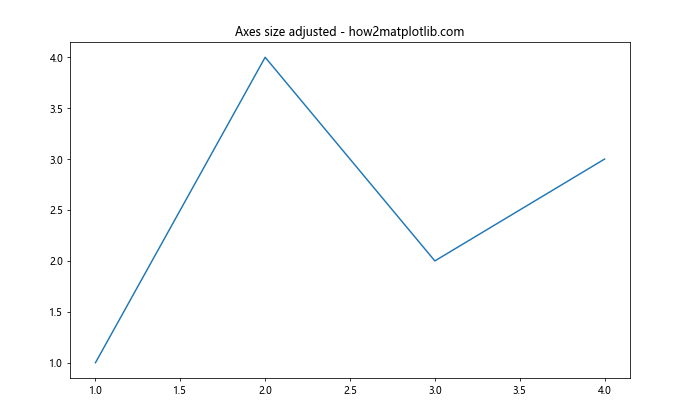
这个例子将Axes调整为占据Figure 80%的宽度和高度,并且距离左边和底部各10%的距离。
7. 使用tight_layout()自动调整布局
tight_layout()函数可以自动调整子图之间的间距,以避免重叠。
import matplotlib.pyplot as plt

fig, (ax1, ax2) = plt.subplots(2, 1, figsize=(8, 8))
ax1.plot([1, 2, 3, 4], [1, 4, 2, 3])
ax2.plot([1, 2, 3, 4], [3, 2, 4, 1])
plt.tight_layout()
fig.suptitle('Tight layout example - how2matplotlib.com', y=1.02)
plt.show()
Output:
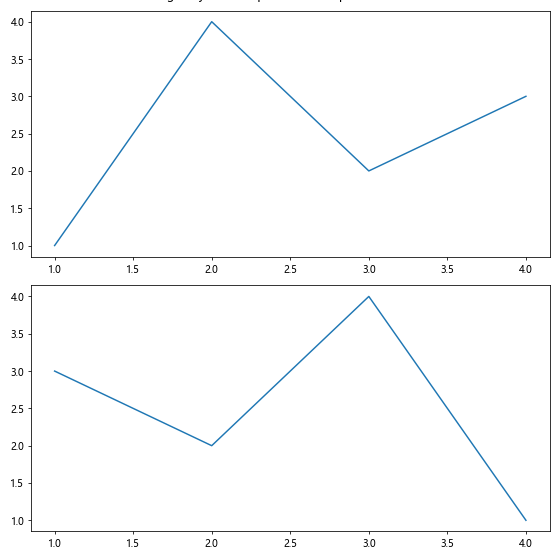
这个函数特别有用,因为它可以自动处理标题、标签等元素的位置,确保它们不会相互重叠。
8. 使用constrained_layout
constrained_layout是一个更高级的自动布局调整工具,它可以处理更复杂的布局情况。
import matplotlib.pyplot as plt

fig, axs = plt.subplots(2, 2, figsize=(10, 10), constrained_layout=True)
for ax in axs.flat:
    ax.plot([1, 2, 3, 4], [1, 4, 2, 3])
fig.suptitle('Constrained layout example - how2matplotlib.com')
plt.show()
Output:
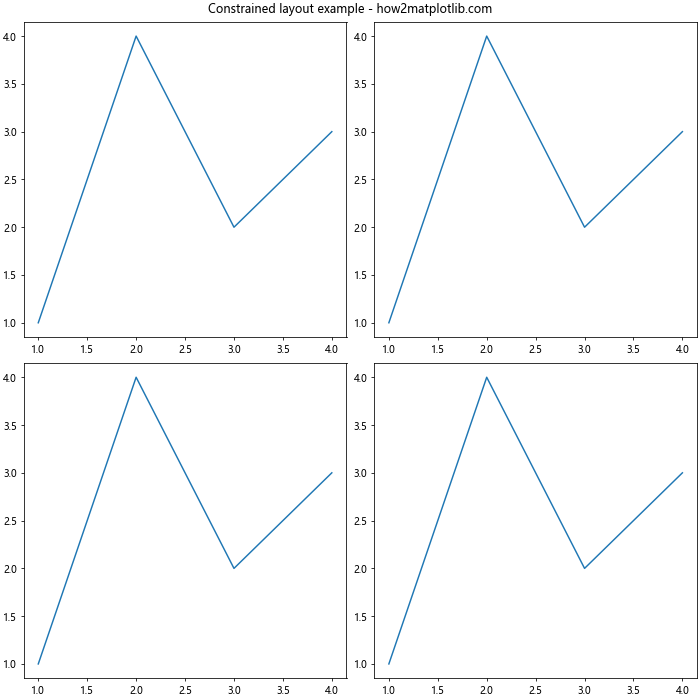
constrained_layout会自动调整子图之间的间距,并确保标题和标签不会重叠。
9. 调整图表大小以适应屏幕分辨率
在某些情况下,你可能想要创建一个适合特定屏幕分辨率的图表。这可以通过设置DPI(每英寸点数)来实现。
import matplotlib.pyplot as plt

dpi = 100  # 假设屏幕DPI为100
width_inches = 1920 / dpi
height_inches = 1080 / dpi

fig, ax = plt.subplots(figsize=(width_inches, height_inches), dpi=dpi)
ax.plot([1, 2, 3, 4], [1, 4, 2, 3])
plt.title('Plot sized for 1920x1080 screen - how2matplotlib.com')
plt.show()
Output:
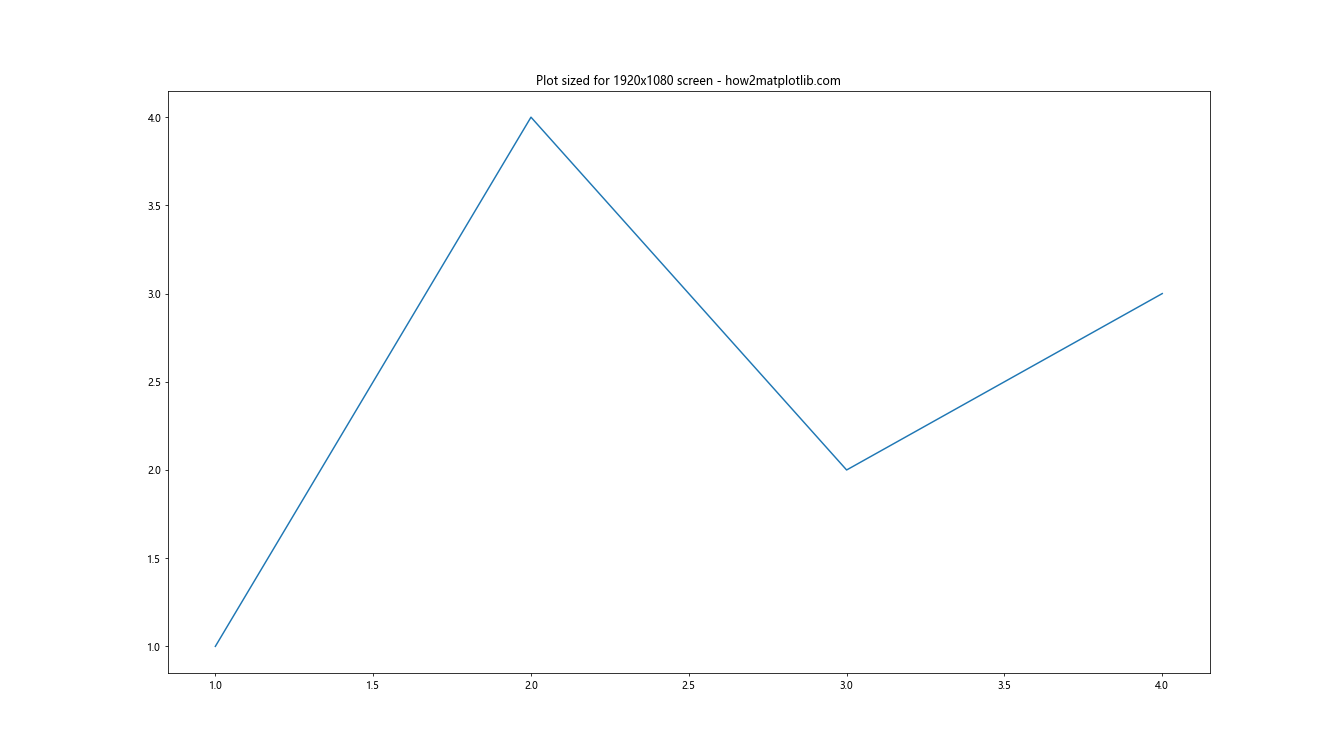
这个例子创建了一个适合1920×1080分辨率屏幕的图表。
10. 保存时调整图表大小
当保存图表为图片文件时,你可以在保存时指定大小。
import matplotlib.pyplot as plt

fig, ax = plt.subplots()
ax.plot([1, 2, 3, 4], [1, 4, 2, 3])
plt.title('Saved with custom size - how2matplotlib.com')
plt.savefig('plot.png', dpi=300, bbox_inches='tight', figsize=(10, 6))
这个例子将图表保存为一个300 DPI、10×6英寸的PNG文件。bbox_inches='tight'参数确保图表的所有部分都被包含在保存的图片中。
11. 使用GridSpec调整复杂布局
对于更复杂的布局,GridSpec提供了更灵活的选项来调整子图的大小和位置。
import matplotlib.pyplot as plt
import matplotlib.gridspec as gridspec

fig = plt.figure(figsize=(12, 8))
gs = gridspec.GridSpec(2, 2, width_ratios=[2, 1], height_ratios=[1, 2])

ax1 = fig.add_subplot(gs[0, 0])
ax2 = fig.add_subplot(gs[0, 1])
ax3 = fig.add_subplot(gs[1, :])

ax1.plot([1, 2, 3, 4], [1, 4, 2, 3])
ax2.plot([1, 2, 3, 4], [3, 2, 4, 1])
ax3.plot([1, 2, 3, 4], [2, 3, 1, 4])

plt.suptitle('GridSpec layout - how2matplotlib.com')
plt.tight_layout()
plt.show()
Output:
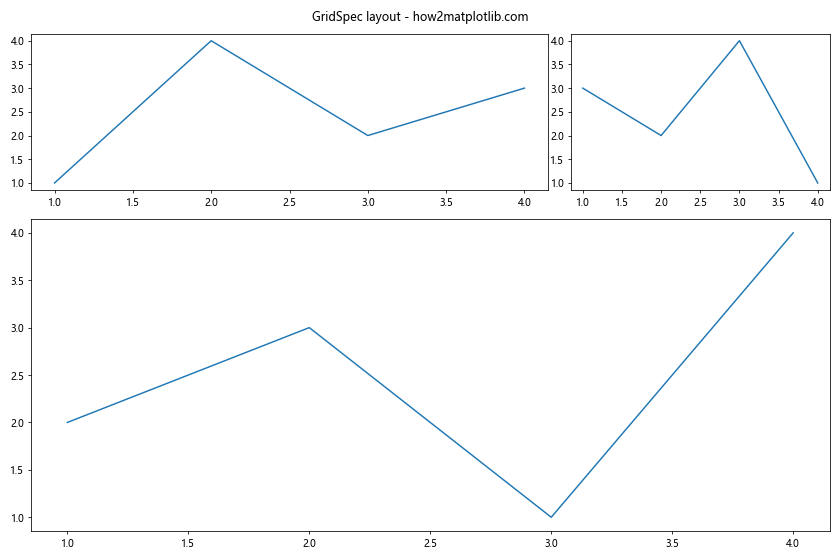
这个例子创建了一个2×2的网格,其中右上角的子图比左上角的窄,底部的子图跨越整个宽度。
12. 动态调整图表大小
有时,你可能需要根据数据动态调整图表大小。这里有一个例子,展示了如何根据数据点的数量来调整图表的宽度。
import matplotlib.pyplot as plt
import numpy as np

def plot_with_dynamic_size(data):
    base_width = 6
    width = base_width + len(data) * 0.1  # 每增加10个数据点,宽度增加1英寸
    height = 6

    fig, ax = plt.subplots(figsize=(width, height))
    ax.plot(data)
    plt.title(f'Dynamic size plot - how2matplotlib.com (width: {width:.2f} inches)')
    plt.show()

# 测试不同长度的数据
plot_with_dynamic_size(np.random.rand(20))
plot_with_dynamic_size(np.random.rand(100))
这个函数会根据数据的长度动态调整图表的宽度,使得数据点较多的图表会更宽。
13. 调整图表大小以适应文本
有时,你可能需要根据图表中的文本内容来调整图表大小。这里有一个例子,展示了如何根据标题的长度来调整图表的宽度。
import matplotlib.pyplot as plt

def plot_with_text_adjusted_size(title):
    base_width = 6
    width = base_width + len(title) * 0.1  # 每10个字符增加1英寸宽度
    height = 4

    fig, ax = plt.subplots(figsize=(width, height))
    ax.plot([1, 2, 3, 4], [1, 4, 2, 3])
    plt.title(f'{title} - how2matplotlib.com')
    plt.show()

# 测试不同长度的标题
plot_with_text_adjusted_size("Short Title")
plot_with_text_adjusted_size("This is a much longer title that will make the plot wider")
这个函数会根据标题的长度动态调整图表的宽度,确保长标题不会被截断。
14. 使用inches和pixels互相转换
有时你可能需要在英寸和像素之间进行转换。这里有一个辅助函数可以帮助你实现这一点:
import matplotlib.pyplot as plt

def inches_to_pixels(inches, dpi=100):
    return inches * dpi

def pixels_to_inches(pixels, dpi=100):
    return pixels / dpi

# 示例使用
width_pixels = 800
height_pixels = 600
dpi = 100

width_inches = pixels_to_inches(width_pixels, dpi)
height_inches = pixels_to_inches(height_pixels, dpi)

fig, ax = plt.subplots(figsize=(width_inches, height_inches), dpi=dpi)
ax.plot([1, 2, 3, 4], [1, 4, 2, 3])
plt.title(f'Plot sized to {width_pixels}x{height_pixels} pixels - how2matplotlib.com')
plt.show()
Output:
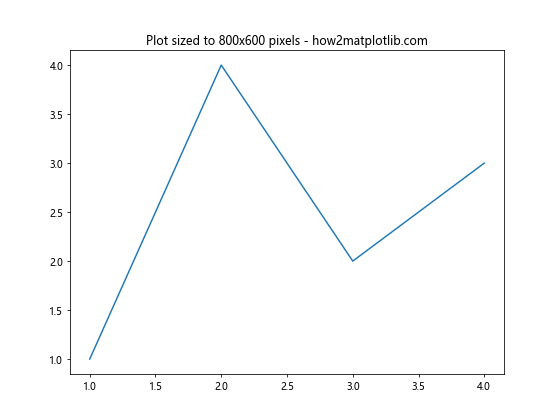
这个例子展示了如何创建一个指定像素大小的图表。
15. 调整图表大小以适应不同的屏幕方向
在某些情况下,你可能需要创建适合不同屏幕方向(横向或纵向)的图表。这里有一个例子展示了如何实现:
import matplotlib.pyplot as plt

def plot_for_orientation(orientation='landscape'):
    if orientation == 'landscape':
        figsize = (10, 6)
    else:  # portrait
        figsize = (6, 10)

    fig, ax = plt.subplots(figsize=figsize)
    ax.plot([1, 2, 3, 4], [1, 4, 2, 3])
    plt.title(f'{orientation.capitalize()} orientation - how2matplotlib.com')
    plt.show()

# 测试不同的方向
plot_for_orientation('landscape')
plot_for_orientation('portrait')
这个函数可以根据指定的方向创建适合的图表大小。
结论
调整Matplotlib中的图表大小是一项重要的技能,它可以帮助你创建更加美观和信息丰富的可视化。本文介绍了多种方法来改变图表大小,从简单的figsize参数设置到更复杂的GridSpec布局。我们还探讨了如何动态调整大小、适应不同的屏幕分辨率和方向,以及如何根据内容调整大小。
记住,图表大小的选择应该基于你的具体需求,包括数据的复杂性、展示的媒介(如屏幕显示或打印)以及美学考虑。通过实践和实验,你将能够为每个可视化任务找到最佳的图表大小设置。
最后,不要忘记Matplotlib的强大之处在于其灵活性。你可以组合使用本文中介绍的各种技术,以创建完全符合你需求的自定义图表大小和布局。继续探索和实验,你会发现更多创新的方式来优化你的数据可视化。
 极客教程
极客教程