Matplotlib ax.set_title 的使用详解
参考:ax.set_title
在数据可视化的过程中,图表的标题是帮助观众快速理解图表信息的重要元素。在 Python 的 Matplotlib 库中,ax.set_title 方法用于设置图表的标题。本文将详细介绍如何使用 ax.set_title 方法,并通过多个示例展示如何在不同情况下设置和调整标题。
1. 基本用法
ax.set_title 方法主要用于为图表添加标题。其基本语法如下:
ax.set_title(label, fontdict=None, loc='center', pad=None, **kwargs)
label:标题的文本内容。fontdict:字体属性的字典。loc:标题的位置,可选值有'left','center','right'。pad:标题与图表顶部的距离(单位是点)。
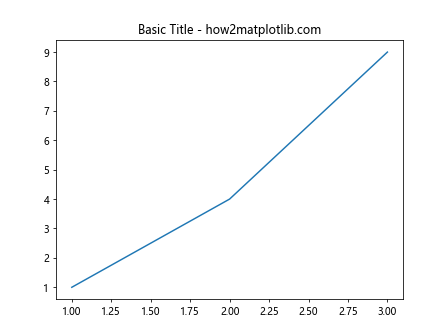
示例代码 1:基础标题设置
import matplotlib.pyplot as plt

fig, ax = plt.subplots()
ax.plot([1, 2, 3], [1, 4, 9])
ax.set_title('Basic Title - how2matplotlib.com')
plt.show()
Output:
2. 调整标题位置
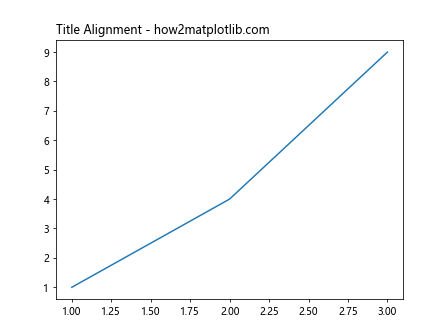
通过 loc 参数,我们可以调整标题的水平位置。
示例代码 2:设置标题位置
import matplotlib.pyplot as plt

fig, ax = plt.subplots()
ax.plot([1, 2, 3], [1, 4, 9])
ax.set_title('Title Alignment - how2matplotlib.com', loc='left')
plt.show()
Output:
3. 字体属性设置
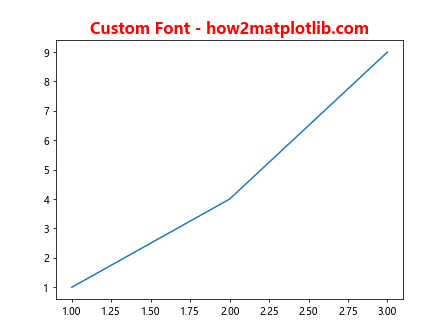
使用 fontdict 参数,可以详细定义标题的字体样式,如字体大小、颜色和字体类型等。
示例代码 3:自定义字体属性
import matplotlib.pyplot as plt

fig, ax = plt.subplots()
ax.plot([1, 2, 3], [1, 4, 9])
title_font = {'fontsize': 16, 'fontweight': 'bold', 'color': 'red'}
ax.set_title('Custom Font - how2matplotlib.com', fontdict=title_font)
plt.show()
Output:
4. 调整标题与图表的距离
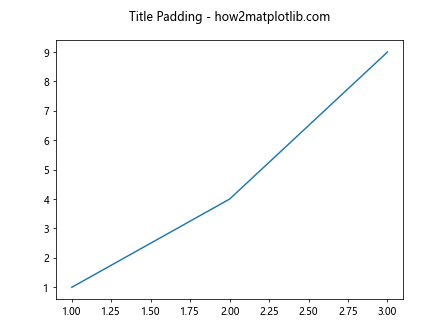
通过 pad 参数,可以调整标题与图表顶部的距离。
示例代码 4:调整标题距离
import matplotlib.pyplot as plt

fig, ax = plt.subplots()
ax.plot([1, 2, 3], [1, 4, 9])
ax.set_title('Title Padding - how2matplotlib.com', pad=20)
plt.show()
Output:
5. 使用关键字参数进一步自定义标题
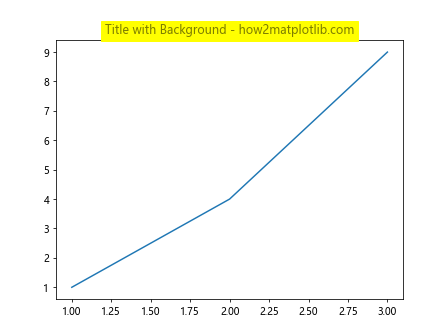
除了上述参数外,ax.set_title 还接受其他关键字参数,如 backgroundcolor,alpha 等,用于进一步自定义标题的显示效果。
示例代码 5:使用关键字参数
import matplotlib.pyplot as plt

fig, ax = plt.subplots()
ax.plot([1, 2, 3], [1, 4, 9])
ax.set_title('Title with Background - how2matplotlib.com', backgroundcolor='yellow', alpha=0.5)
plt.show()
Output:
6. 多图表中的标题设置
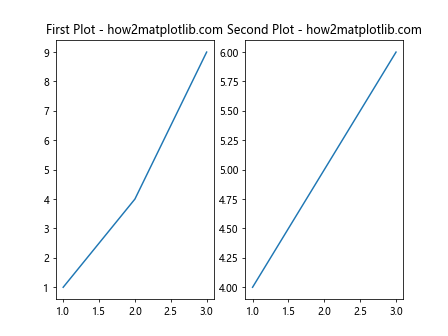
在一个画布上绘制多个图表时,可以为每个子图设置不同的标题。
示例代码 6:为多个子图设置标题
import matplotlib.pyplot as plt

fig, (ax1, ax2) = plt.subplots(1, 2)
ax1.plot([1, 2, 3], [1, 4, 9])
ax1.set_title('First Plot - how2matplotlib.com')
ax2.plot([1, 2, 3], [4, 5, 6])
ax2.set_title('Second Plot - how2matplotlib.com')
plt.show()
Output:
7. 标题的进阶用法
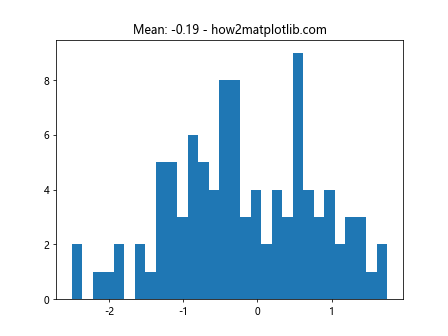
在实际应用中,我们可能需要根据图表的具体内容动态调整标题的样式或内容。通过结合图表的数据分析结果,我们可以动态生成更有信息量的标题。
示例代码 7:动态生成标题
import matplotlib.pyplot as plt
import numpy as np

data = np.random.randn(100)
fig, ax = plt.subplots()
ax.hist(data, bins=30)
mean_val = np.mean(data)
ax.set_title(f'Mean: {mean_val:.2f} - how2matplotlib.com')
plt.show()
Output:
8. 结合文本格式化进一步优化标题
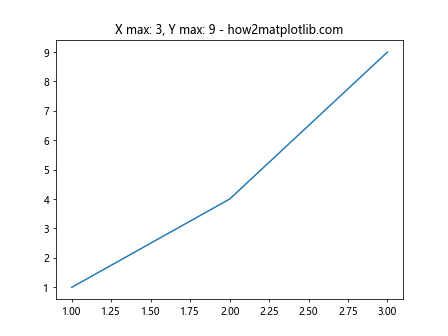
使用 Python 的字符串格式化功能,可以在标题中包含更复杂的文本格式。
示例代码 8:文本格式化标题
import matplotlib.pyplot as plt

x = [1, 2, 3]
y = [1, 4, 9]
fig, ax = plt.subplots()
ax.plot(x, y)
ax.set_title('X max: {xmax}, Y max: {ymax} - how2matplotlib.com'.format(xmax=max(x), ymax=max(y)))
plt.show()
Output:
9. 结合图表元素调整标题样式
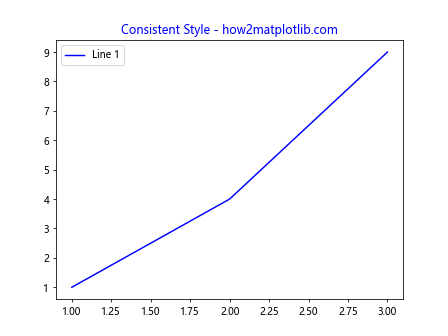
有时候,标题的样式需要与图表中的其他元素(如颜色、线型等)保持一致,以增强图表的整体美观性。
示例代码 9:与图表元素一致的标题样式
import matplotlib.pyplot as plt

fig, ax = plt.subplots()
ax.plot([1, 2, 3], [1, 4, 9], label='Line 1', color='blue')
ax.set_title('Consistent Style - how2matplotlib.com', color='blue')
ax.legend()
plt.show()
Output:
10. 多行标题
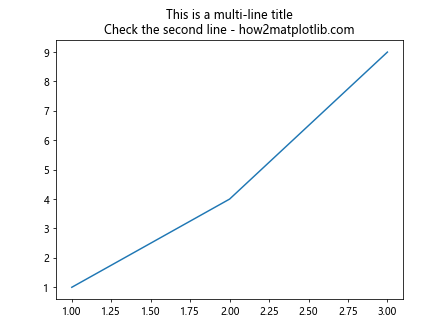
在某些情况下,标题可能需要分多行显示,以便更详细地描述图表的内容或目的。
示例代码 10:多行标题
import matplotlib.pyplot as plt

fig, ax = plt.subplots()
ax.plot([1, 2, 3], [1, 4, 9])
ax.set_title('This is a multi-line title\nCheck the second line - how2matplotlib.com')
plt.show()
Output:
以上示例展示了如何使用 ax.set_title 方法在 Matplotlib 中设置和调整图表标题。通过这些示例,可以看到 ax.set_title 在数据可视化中的灵活性和强大功能。
 极客教程
极客教程