Matplotlib ax.title 的使用详解
参考:ax.title
在数据可视化的过程中,图表的标题不仅起到美化作用,还能够提供关于图表内容的直接信息。在 Python 的 Matplotlib 库中,ax.title 是设置图表标题的一个重要方法。本文将详细介绍如何使用 ax.title 来设置图表标题,并通过多个示例展示其灵活性和实用性。
1. 基本用法
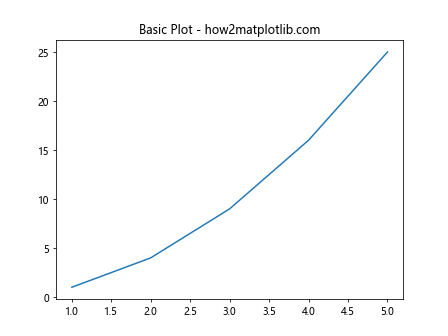
ax.title 方法用于添加或修改图表的标题。它通常与 matplotlib.pyplot 模块中的 subplot 或 axes 对象一起使用。下面是一个基本的示例:
import matplotlib.pyplot as plt

fig, ax = plt.subplots()
ax.plot([1, 2, 3, 4, 5], [1, 4, 9, 16, 25])
ax.set_title("Basic Plot - how2matplotlib.com")
plt.show()
Output:
2. 设置标题位置
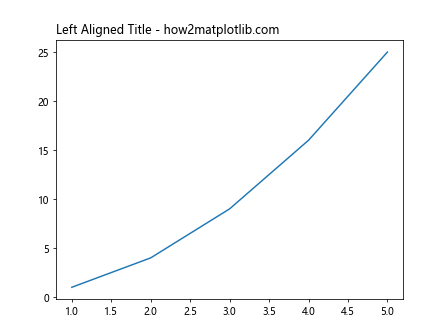
标题的位置可以通过 loc 参数来调整,常用的值有 'left', 'right', 和 'center'(默认)。
示例代码:设置标题位置
import matplotlib.pyplot as plt

fig, ax = plt.subplots()
ax.plot([1, 2, 3, 4, 5], [1, 4, 9, 16, 25])
ax.set_title("Left Aligned Title - how2matplotlib.com", loc='left')
plt.show()
Output:
3. 调整标题字体
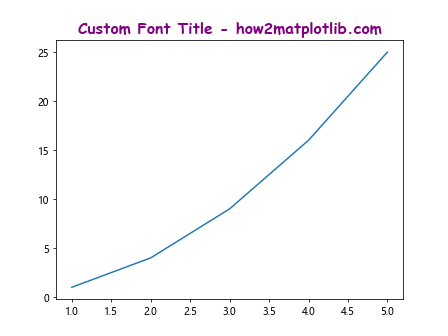
可以通过 fontdict 参数来自定义标题的字体样式,如字体大小、颜色和字体类型等。
示例代码:自定义标题字体
import matplotlib.pyplot as plt

fig, ax = plt.subplots()
ax.plot([1, 2, 3, 4, 5], [1, 4, 9, 16, 25])
title_font = {'fontname':'Comic Sans MS', 'size':'16', 'color':'purple', 'weight':'bold'}
ax.set_title("Custom Font Title - how2matplotlib.com", fontdict=title_font)
plt.show()
Output:
4. 添加多行标题
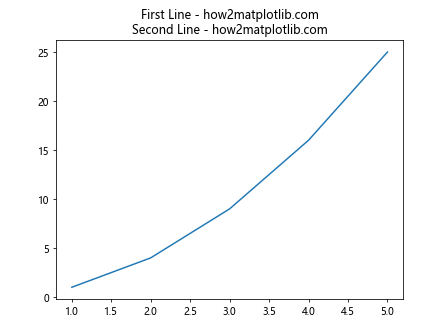
如果需要在标题中添加多行文本,可以在字符串中使用 \n 来换行。
示例代码:多行标题
import matplotlib.pyplot as plt

fig, ax = plt.subplots()
ax.plot([1, 2, 3, 4, 5], [1, 4, 9, 16, 25])
ax.set_title("First Line - how2matplotlib.com\nSecond Line - how2matplotlib.com")
plt.show()
Output:
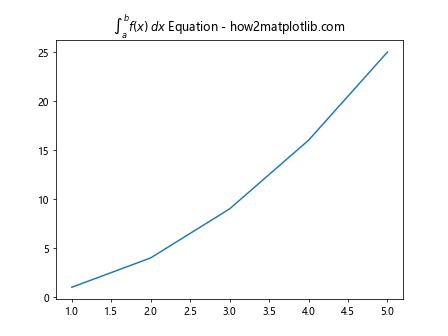
5. 标题内的数学表达式
Matplotlib 支持在标题中添加 LaTeX 类型的数学表达式。
示例代码:数学表达式标题
import matplotlib.pyplot as plt

fig, ax = plt.subplots()
ax.plot([1, 2, 3, 4, 5], [1, 4, 9, 16, 25])
ax.set_title(r"\int_a^b f(x)\,dx Equation - how2matplotlib.com")
plt.show()
Output:
6. 调整标题的透明度
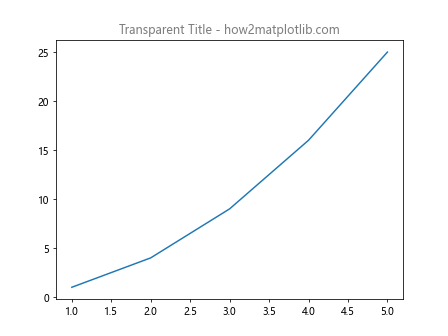
通过 alpha 参数可以设置标题的透明度。
示例代码:设置标题透明度
import matplotlib.pyplot as plt

fig, ax = plt.subplots()
ax.plot([1, 2, 3, 4, 5], [1, 4, 9, 16, 25])
ax.set_title("Transparent Title - how2matplotlib.com", alpha=0.5)
plt.show()
Output:
7. 设置标题的背景颜色
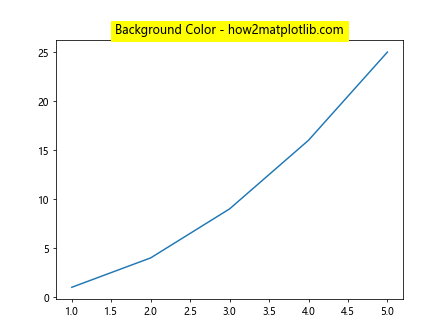
通过 backgroundcolor 参数可以设置标题的背景颜色。
示例代码:标题背景颜色
import matplotlib.pyplot as plt

fig, ax = plt.subplots()
ax.plot([1, 2, 3, 4, 5], [1, 4, 9, 16, 25])
ax.set_title("Background Color - how2matplotlib.com", backgroundcolor='yellow')
plt.show()
Output:
8. 设置标题的边框
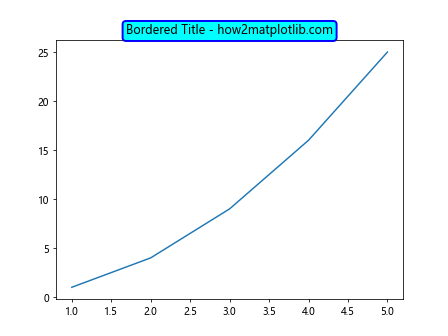
标题的边框可以通过 bbox 参数来设置,这个参数接受一个字典,其中可以定义边框的样式、颜色和宽度等属性。
示例代码:标题边框
import matplotlib.pyplot as plt

fig, ax = plt.subplots()
ax.plot([1, 2, 3, 4, 5], [1, 4, 9, 16, 25])
bbox_props = {'boxstyle': "round,pad=0.3", 'fc': "cyan", 'ec': "b", 'lw': 2}
ax.set_title("Bordered Title - how2matplotlib.com", bbox=bbox_props)
plt.show()
Output:
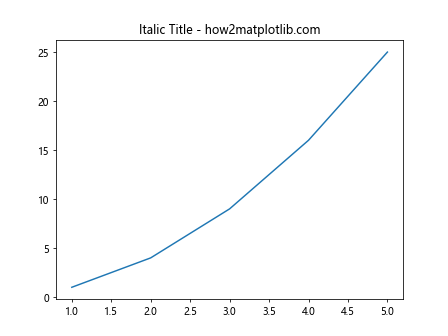
9. 使用不同的字体样式
通过 style 参数可以设置标题的字体样式,如 ‘italic’ 或 ‘oblique’。
示例代码:斜体标题
import matplotlib.pyplot as plt

fig, ax = plt.subplots()
ax.plot([1, 2, 3, 4, 5], [1, 4, 9, 16, 25])
ax.set_title("Italic Title - how2matplotlib.com", style='italic')
plt.show()
Output:
10. 设置标题的水平和垂直位置
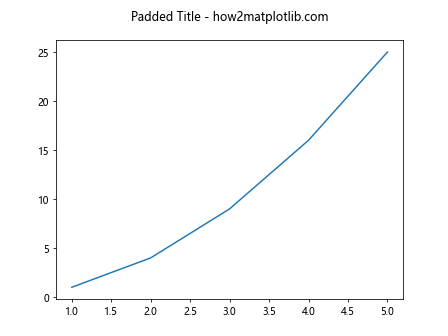
通过 pad 参数可以调整标题与图表的距离。
示例代码:调整标题位置
import matplotlib.pyplot as plt

fig, ax = plt.subplots()
ax.plot([1, 2, 3, 4, 5], [1, 4, 9, 16, 25])
ax.set_title("Padded Title - how2matplotlib.com", pad=20)
plt.show()
Output:
以上就是关于 ax.title 的详细介绍和示例代码。通过这些示例,可以看到 ax.title 在 Matplotlib 中的灵活性和强大功能,能够帮助用户更好地定制和展示他们的数据可视化结果。
 极客教程
极客教程