Matplotlib ax.errorbar
参考:ax.errorbar
在Matplotlib中,ax.errorbar是用于在图表中绘制具有误差线的散点图的函数。误差线显示了每个数据点的不确定性范围,帮助观众更好地理解数据的可靠性。在本文中,我将详细介绍如何使用ax.errorbar函数绘制带有误差线的散点图。
1. 基本用法
以下是一个简单的示例,展示了如何使用ax.errorbar函数创建一个带有误差线的散点图:
import matplotlib.pyplot as plt
import numpy as np

x = np.arange(10)
y = np.random.rand(10)
errors = np.random.rand(10) * 0.5

fig, ax = plt.subplots()
ax.errorbar(x, y, yerr=errors, fmt='o')
plt.show()
Output:
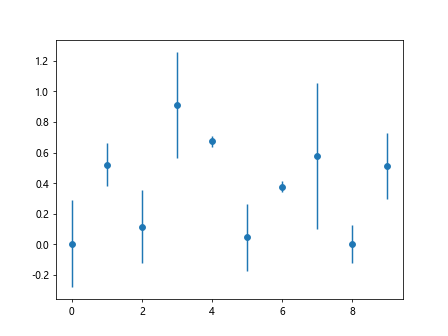
在这个示例中,我们首先生成了包含10个数据点的x和y数组。然后使用np.random.rand函数生成了误差范围的数组errors。接下来,我们创建了一个图形和轴对象,然后调用ax.errorbar函数,传入x、y和errors数组以及fmt参数设置格式为’o’。
2. 自定义误差线样式
您可以通过一些参数来自定义误差线的样式,下面是一个示例代码:
import matplotlib.pyplot as plt
import numpy as np

x = np.arange(10)
y = np.random.rand(10)
errors = np.random.rand(10) * 0.5
colors = np.random.rand(10)
sizes = np.random.randint(5, 15, 10)

fig, ax = plt.subplots()
ax.errorbar(x, y, yerr=errors, fmt='o', ecolor='red', elinewidth=2, capsize=5, markerfacecolor='blue', markersize=sizes)
plt.show()
在这个示例中,我们通过设置ecolor参数为’red’来改变误差线的颜色为红色,设置elinewidth参数为2来增加误差线的线宽,设置capsize参数为5来调整误差线顶端的横线长度,设置markerfacecolor参数为’blue’来改变数据点的填充颜色,最后通过markersize参数设定数据点的大小。
3. 多组数据展示
有时候我们需要同时展示多组数据,以下是一个示例代码:
import matplotlib.pyplot as plt
import numpy as np

x = np.arange(10)
y1 = np.random.rand(10)
errors1 = np.random.rand(10) * 0.5
y2 = np.random.rand(10)
errors2 = np.random.rand(10) * 0.5

fig, ax = plt.subplots()
ax.errorbar(x, y1, yerr=errors1, fmt='o', label='Group 1')
ax.errorbar(x, y2, yerr=errors2, fmt='x', label='Group 2')
ax.legend()
plt.show()
Output:
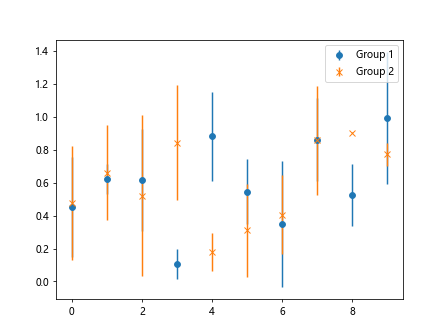
在这个示例中,我们生成了两组数据y1和y2,以及对应的误差errors1和errors2。然后使用两次ax.errorbar函数分别绘制了两组数据的散点图,通过设置不同的fmt参数和label参数来区分不同的组。
4. 横向误差线
有时候我们需要在水平方向绘制误差线,下面是一个示例代码:
import matplotlib.pyplot as plt

x = [1, 2, 3, 4, 5]
y = [10, 15, 13, 18, 17]
errors = [0.5, 1, 0.8, 0.6, 1.2]

fig, ax = plt.subplots()
ax.errorbar(x, y, xerr=errors, fmt='o')
plt.show()
Output:
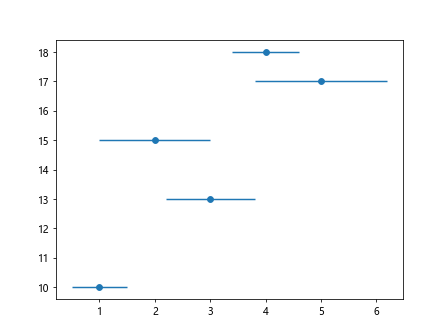
在这个示例中,我们创建了包含5个数据点的x和y数组,以及对应的水平误差errors数组。然后调用ax.errorbar函数时,传入xerr参数设置水平误差。
5. 自定义误差线箭头
您可以通过设置标记线末端的样式来自定义误差线箭头,以下是一个示例代码:
import matplotlib.pyplot as plt
import numpy as np

x = np.arange(10)
y = np.random.rand(10)
errors = np.random.rand(10) * 0.5

fig, ax = plt.subplots()
ax.errorbar(x, y, yerr=errors, fmt='o', capsize=5, capthick=2, ecolor='red', elinewidth=2, lolims=True, uplims=True, xlolims=True, xuplims=True)
plt.show()
Output:
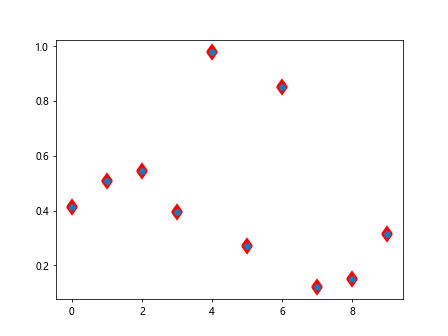
在这个示例中,我们通过设置capsize参数为5来调整误差线顶端的横线长度,设置capthick参数为2来增加标记线粗细,设置lolims、uplims、xlolims和xuplims参数为True来显示误差线箭头。
6. 对数坐标轴
如果您的数据在对数坐标轴上,也可以使用ax.errorbar函数进行绘制,以下是一个示例代码:
import matplotlib.pyplot as plt
import numpy as np

x = np.arange(1, 10)
y = np.random.rand(9)
errors = np.random.rand(9) * 0.5

fig, ax = plt.subplots()
ax.set_xscale('log')
ax.errorbar(x, y, yerr=errors, fmt='o')
plt.show()
Output:
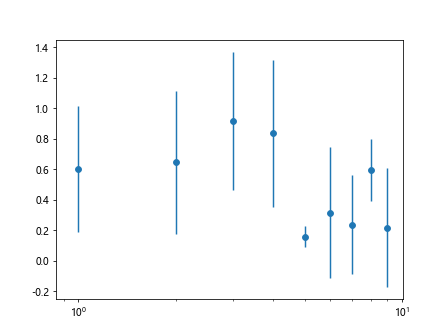
在这个示例中,我们首先生成了一个在对数坐标轴上展示的x数组,然后调用ax.set_xscale函数来设置x轴为对数坐标轴。
7. 带有误差线的柱状图
除了散点图,您也可以在柱状图上绘制误差线,以下是一个示例代码:
import matplotlib.pyplot as plt
import numpy as np

x = np.arange(5)
y = np.random.rand(5)
errors = np.random.rand(5) * 0.5

fig, ax = plt.subplots()
ax.bar(x, y, yerr=errors, alpha=0.7)
plt.show()
Output:
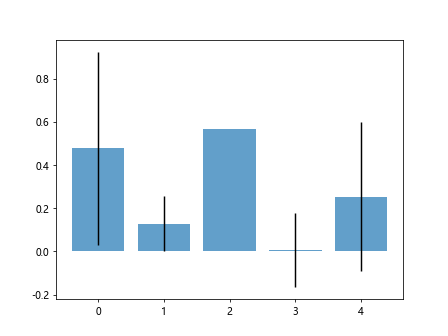
在这个示例中,我们生成了一个包含5个数据点的x和y数组,以及对应的误差errors数组。然后调用ax.bar函数绘制了一个带有误差线的柱状图,设置alpha参数为0.7使柱子半透明。
通过以上示例代码,您已经了解了如何使用ax.errorbar函数在Matplotlib中绘制带有误差线的散点图,并进行了一些自定义样式和进阶用法的示例演示。
 极客教程
极客教程