在Matplotlib中标注时间序列图
参考: Annotate Time Series plot in Matplotlib
在数据可视化中,时间序列图是展示随时间变化的数据点的一种有效方式。使用Python的Matplotlib库,我们可以轻松地创建时间序列图,并通过标注(Annotate)增加图表的可读性和信息量。本文将详细介绍如何在Matplotlib中创建和标注时间序列图,包括多种标注技巧和示例代码。
1. 基础时间序列图
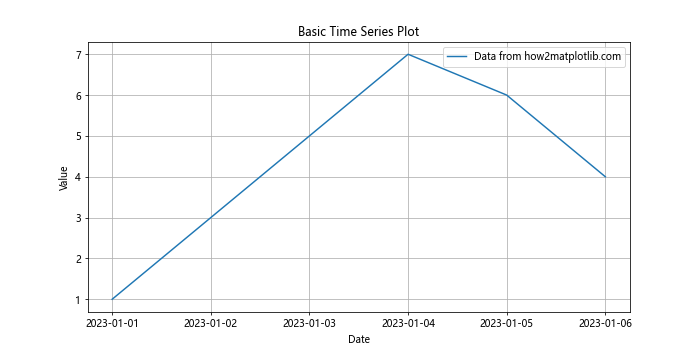
首先,我们需要了解如何在Matplotlib中创建一个基础的时间序列图。以下是一个简单的示例,展示了如何绘制一个基本的时间序列数据。
import matplotlib.pyplot as plt
import pandas as pd

# 创建时间序列数据
dates = pd.date_range('20230101', periods=6)
data = pd.Series([1, 3, 5, 7, 6, 4], index=dates)

# 绘制时间序列图
plt.figure(figsize=(10, 5))
plt.plot(data, label='Data from how2matplotlib.com')
plt.title('Basic Time Series Plot')
plt.xlabel('Date')
plt.ylabel('Value')
plt.legend()
plt.grid(True)
plt.show()
Output:

2. 在时间序列图中添加标注
在时间序列图中添加标注可以帮助观众更好地理解图中的特定数据点或趋势。以下是一个添加标注的示例。
import matplotlib.pyplot as plt
import pandas as pd

# 创建时间序列数据
dates = pd.date_range('20230101', periods=6)
data = pd.Series([1, 3, 5, 7, 6, 4], index=dates)

# 绘制时间序列图并添加标注
plt.figure(figsize=(10, 5))
plt.plot(data, label='Data from how2matplotlib.com')
plt.annotate('Highest Point', xy=(dates[3], data[3]), xytext=(dates[2], data[3]+1),
             arrowprops=dict(facecolor='black', shrink=0.05),
             )
plt.title('Time Series Plot with Annotation')
plt.xlabel('Date')
plt.ylabel('Value')
plt.legend()
plt.grid(True)
plt.show()
3. 使用不同的标注样式
Matplotlib提供了多种标注样式,包括不同的箭头样式和连接线类型。下面的示例展示了如何使用不同的箭头样式进行标注。
import matplotlib.pyplot as plt
import pandas as pd

# 创建时间序列数据
dates = pd.date_range('20230101', periods=6)
data = pd.Series([1, 3, 5, 7, 6, 4], index=dates)

# 绘制时间序列图并使用不同的箭头样式添加标注
plt.figure(figsize=(10, 5))
plt.plot(data, label='Data from how2matplotlib.com')
plt.annotate('Peak', xy=(dates[3], data[3]), xytext=(dates[1], data[3]+2),
             arrowprops=dict(arrowstyle='->', connectionstyle='arc3,rad=.5', color='red'),
             )
plt.title('Time Series Plot with Different Annotation Styles')
plt.xlabel('Date')
plt.ylabel('Value')
plt.legend()
plt.grid(True)
plt.show()
4. 标注多个点
在时间序列图中,我们可能需要标注多个点。以下示例展示了如何同时标注多个重要数据点。
import matplotlib.pyplot as plt
import pandas as pd

# 创建时间序列数据
dates = pd.date_range('20230101', periods=6)
data = pd.Series([1, 3, 5, 7, 6, 4], index=dates)

# 绘制时间序列图并标注多个点
plt.figure(figsize=(10, 5))
plt.plot(data, label='Data from how2matplotlib.com')
plt.annotate('Start', xy=(dates[0], data[0]), xytext=(dates[0], data[0]+1),
             arrowprops=dict(facecolor='green', shrink=0.05),
             )
plt.annotate('End', xy=(dates[-1], data[-1]), xytext=(dates[-1], data[-1]-1),
             arrowprops=dict(facecolor='red', shrink=0.05),
             )
plt.title('Time Series Plot with Multiple Annotations')
plt.xlabel('Date')
plt.ylabel('Value')
plt.legend()
plt.grid(True)
plt.show()
5. 结合文本和箭头进行标注
在某些情况下,我们可能需要在标注中同时使用文本和箭头来强调图表中的信息。以下示例展示了如何结合使用文本和箭头进行标注。
import matplotlib.pyplot as plt
import pandas as pd

# 创建时间序列数据
dates = pd.date_range('20230101', periods=6)
data = pd.Series([1, 3, 5, 7, 6, 4], index=dates)

# 绘制时间序列图并结合文本和箭头进行标注
plt.figure(figsize=(10, 5))
plt.plot(data, label='Data from how2matplotlib.com')
plt.annotate('Important', xy=(dates[2], data[2]), xytext=(dates[1], data[2]+2),
             textcoords='offset points', ha='right', va='bottom',
             bbox=dict(boxstyle='round,pad=0.5', fc='yellow', alpha=0.5),
             arrowprops=dict(arrowstyle='->', connectionstyle='arc3,rad=0', color='blue'),
             )
plt.title('Time Series Plot with Text and Arrow Annotations')
plt.xlabel('Date')
plt.ylabel('Value')
plt.legend()
plt.grid(True)
plt.show()
6. 使用自定义箭头和文本样式
Matplotlib允许用户自定义箭头和文本的样式,以适应不同的视觉需求。以下示例展示了如何自定义箭头和文本样式进行标注。
import matplotlib.pyplot as plt
import pandas as pd

# 创建时间序列数据
dates = pd.date_range('20230101', periods=6)
data = pd.Series([1, 3, 5, 7, 6, 4], index=dates)

# 绘制时间序列图并使用自定义箭头和文本样式进行标注
plt.figure(figsize=(10, 5))
plt.plot(data, label='Data from how2matplotlib.com')
plt.annotate('Custom Style', xy=(dates[4], data[4]), xytext=(dates[3], data[4]+1),
             textcoords='offset points', ha='center', va='bottom',
             bbox=dict(boxstyle='round4,pad=0.5', fc='cyan', alpha=0.5),
             arrowprops=dict(arrowstyle='fancy', connectionstyle='arc3,rad=0.3', color='purple'),
             )
plt.title('Time Series Plot with Custom Arrow and Text Styles')
plt.xlabel('Date')
plt.ylabel('Value')
plt.legend()
plt.grid(True)
plt.show()
7. 高级标注技巧
在复杂的时间序列数据中,高级标注技巧可以帮助更好地突出显示数据的特定部分。以下示例展示了一些高级标注技巧,如使用不透明度、背景色和不同的连接线样式。
import matplotlib.pyplot as plt
import pandas as pd

# 创建时间序列数据
dates = pd.date_range('20230101', periods=10)
data = pd.Series([1, 3, 5, 7, 6, 4, 8, 10, 9, 7], index=dates)

# 绘制时间序列图并使用高级标注技巧
plt.figure(figsize=(10, 5))
plt.plot(data, label='Data from how2matplotlib.com')
plt.annotate('Peak', xy=(dates[7], data[7]), xytext=(dates[5], data[7]+2),
             textcoords='offset points', ha='center', va='bottom',
             bbox=dict(boxstyle='larrow,pad=0.3', fc='lightblue', alpha=0.5),
             arrowprops=dict(arrowstyle='wedge,tail_width=0.5', alpha=0.1, color='gray'),
             )
plt.title('Time Series Plot with Advanced Annotation Techniques')
plt.xlabel('Date')
plt.ylabel('Value')
plt.legend()
plt.grid(True)
plt.show()
8. 标注的动态位置调整
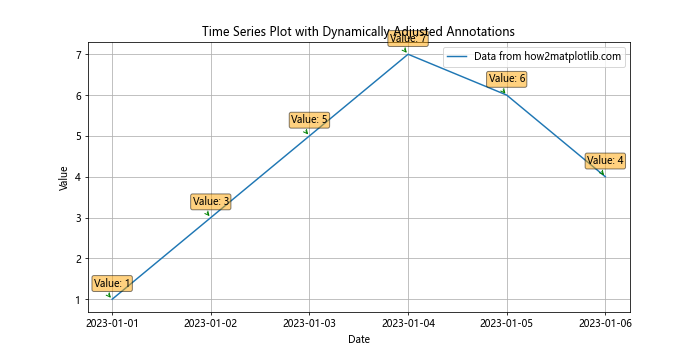
在某些情况下,标注的位置需要根据图表的其他元素动态调整,以避免遮挡重要信息。以下示例展示了如何动态调整标注位置。
import matplotlib.pyplot as plt
import pandas as pd

# 创建时间序列数据
dates = pd.date_range('20230101', periods=6)
data = pd.Series([1, 3, 5, 7, 6, 4], index=dates)

# 绘制时间序列图并动态调整标注位置
plt.figure(figsize=(10, 5))
plt.plot(data, label='Data from how2matplotlib.com')
for i, val in enumerate(data):
    plt.annotate(f'Value: {val}', xy=(dates[i], val), xytext=(0, 10),
                 textcoords='offset points', ha='center', va='bottom',
                 bbox=dict(boxstyle='round,pad=0.2', fc='orange', alpha=0.5),
                 arrowprops=dict(arrowstyle='->', connectionstyle='arc3,rad=.5', color='green'),
                 )
plt.title('Time Series Plot with Dynamically Adjusted Annotations')
plt.xlabel('Date')
plt.ylabel('Value')
plt.legend()
plt.grid(True)
plt.show()
Output:

9. 结合多种标注元素
在复杂的图表中,可能需要结合使用多种标注元素来提供更多信息。以下示例展示了如何结合使用文本框、箭头和其他图形元素进行标注。
import matplotlib.pyplot as plt
import pandas as pd

# 创建时间序列数据
dates = pd.date_range('20230101', periods=8)
data = pd.Series([2, 4, 6, 8, 7, 5, 3, 1], index=dates)

# 绘制时间序列图并结合多种标注元素
plt.figure(figsize=(10, 5))
plt.plot(data, label='Data from how2matplotlib.com')
plt.annotate('Highlight', xy=(dates[3], data[3]), xytext=(dates[5], data[3]+3),
             textcoords='offset points', ha='right', va='top',
             bbox=dict(boxstyle='round4,pad=0.5', fc='violet', alpha=0.5),
             arrowprops=dict(arrowstyle='->', connectionstyle='arc3,rad=-0.3', color='black'),
             )
plt.scatter([dates[3]], [data[3]], color='red')  # Highlight the point
plt.title('Time Series Plot with Combined Annotation Elements')
plt.xlabel('Date')
plt.ylabel('Value')
plt.legend()
plt.grid(True)
plt.show()
10. 使用注释强调趋势
在时间序列分析中,强调数据趋势是非常重要的。以下示例展示了如何使用标注来强调数据的上升或下降趋势。
import matplotlib.pyplot as plt
import pandas as pd

# 创建时间序列数据
dates = pd.date_range('20230101', periods=9)
data = pd.Series([1, 2, 3, 4, 5, 4, 3, 2, 1], index=dates)

# 绘制时间序列图并使用标注强调趋势
plt.figure(figsize=(10, 5))
plt.plot(data, label='Data from how2matplotlib.com')
plt.annotate('Rising Trend', xy=(dates[2], data[2]), xytext=(dates[0], data[4]),
             arrowprops=dict(arrowstyle='->', connectionstyle='arc3,rad=.5', color='blue'),
             )
plt.annotate('Falling Trend', xy=(dates[6], data[6]), xytext=(dates[7], data[5]),
             arrowprops=dict(arrowstyle='->', connectionstyle='arc3,rad=-.5', color='red'),
             )
plt.title('Time Series Plot Highlighting Trends')
plt.xlabel('Date')
plt.ylabel('Value')
plt.legend()
plt.grid(True)
plt.show()
以上示例展示了在Matplotlib中使用标注来增强时间序列图的表达力。通过这些技巧,可以更有效地传达数据的关键信息和趋势。
 极客教程
极客教程