在Python中调整Matplotlib子图的高度
参考: Adjusting the heights of individual subplots in Matplotlib in Python
在数据可视化中,使用Matplotlib库创建图表是Python中一种常见的做法。Matplotlib提供了强大的功能来定制图表,包括调整子图的大小和布局。本文将详细介绍如何在Python中使用Matplotlib调整子图的高度,确保你的图表布局更加合理和美观。
1. 基础概念
在深入代码实现之前,我们首先需要理解一些基础概念。Matplotlib中的Figure对象可以被看作是一个可以容纳多个子图(Axes)的画布。调整子图的高度,实际上是在调整这些Axes对象在Figure中的布局。
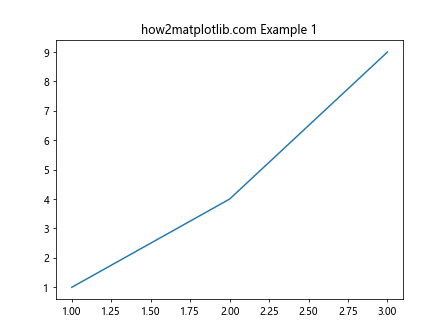
示例代码 1:创建基础图表
import matplotlib.pyplot as plt

fig, ax = plt.subplots()
ax.plot([1, 2, 3], [1, 4, 9])
ax.set_title("how2matplotlib.com Example 1")
plt.show()
Output:
2. 使用subplots_adjust调整子图高度
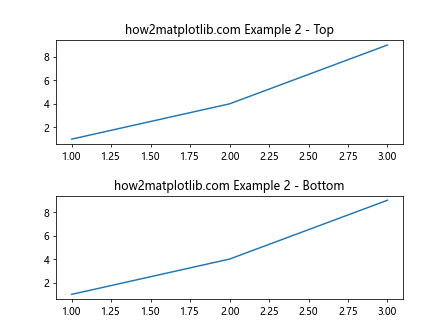
subplots_adjust方法提供了一种直接调整子图间距和大小的方式。通过设置top, bottom, left, right, hspace, 和 wspace 参数,你可以控制子图的布局。
示例代码 2:调整子图间的垂直间距
import matplotlib.pyplot as plt

fig, axs = plt.subplots(2, 1)
axs[0].plot([1, 2, 3], [1, 4, 9])
axs[0].set_title("how2matplotlib.com Example 2 - Top")
axs[1].plot([1, 2, 3], [1, 4, 9])
axs[1].set_title("how2matplotlib.com Example 2 - Bottom")
fig.subplots_adjust(hspace=0.5)
plt.show()
Output:
3. 使用GridSpec进行更复杂的布局调整
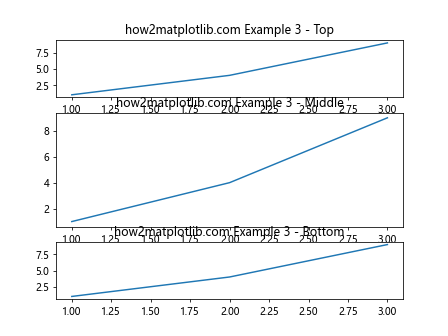
GridSpec是一个更为强大的布局系统,它允许更精细的控制子图的位置和大小。
示例代码 3:使用GridSpec调整特定子图的高度
import matplotlib.pyplot as plt
import matplotlib.gridspec as gridspec

fig = plt.figure()
gs = gridspec.GridSpec(3, 1, height_ratios=[1, 2, 1])
ax1 = fig.add_subplot(gs[0])
ax1.plot([1, 2, 3], [1, 4, 9])
ax1.set_title("how2matplotlib.com Example 3 - Top")
ax2 = fig.add_subplot(gs[1])
ax2.plot([1, 2, 3], [1, 4, 9])
ax2.set_title("how2matplotlib.com Example 3 - Middle")
ax3 = fig.add_subplot(gs[2])
ax3.plot([1, 2, 3], [1, 4, 9])
ax3.set_title("how2matplotlib.com Example 3 - Bottom")
plt.show()
Output:
4. 使用constrained_layout自动调整布局
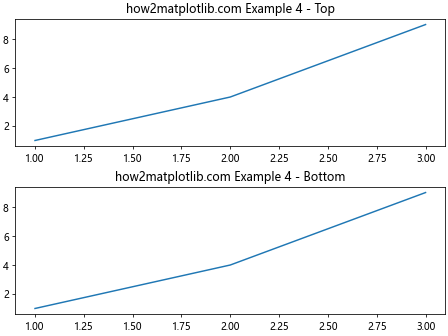
从Matplotlib 3.0开始,constrained_layout系统提供了一种自动调整子图和装饰(如标题和标签)的方式,以避免重叠和更好地利用可用空间。
示例代码 4:启用constrained_layout
import matplotlib.pyplot as plt
import matplotlib.gridspec as gridspec

fig, axs = plt.subplots(2, 1, constrained_layout=True)
axs[0].plot([1, 2, 3], [1, 4, 9])
axs[0].set_title("how2matplotlib.com Example 4 - Top")
axs[1].plot([1, 2, 3], [1, 4, 9])
axs[1].set_title("how2matplotlib.com Example 4 - Bottom")
plt.show()
Output:
5. 使用tight_layout自动调整子图参数
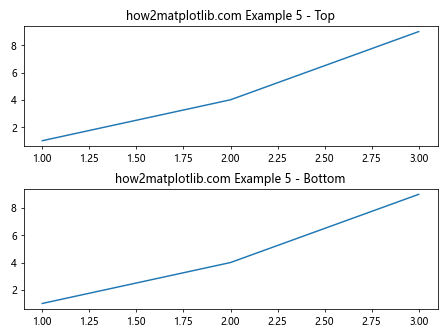
tight_layout自动调整子图参数,使之填充整个图形区域,同时还考虑到轴标签、标题等其他元素。
示例代码 5:使用tight_layout调整布局
import matplotlib.pyplot as plt
import matplotlib.gridspec as gridspec

fig, axs = plt.subplots(2, 1)
axs[0].plot([1, 2, 3], [1, 4, 9])
axs[0].set_title("how2matplotlib.com Example 5 - Top")
axs[1].plot([1, 2, 3], [1, 4, 9])
axs[1].set_title("how2matplotlib.com Example 5 - Bottom")
fig.tight_layout()
plt.show()
Output:
6. 结合Figure和Axes的方法调整子图
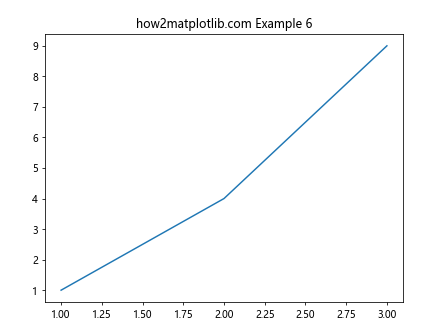
在某些情况下,你可能需要对单个Axes实例进行更精细的控制,比如调整特定子图的边距。
示例代码 6:调整单个子图的边距
import matplotlib.pyplot as plt
import matplotlib.gridspec as gridspec

fig = plt.figure()
ax = fig.add_axes([0.1, 0.1, 0.8, 0.8])
ax.plot([1, 2, 3], [1, 4, 9])
ax.set_title("how2matplotlib.com Example 6")
plt.show()
Output:
7. 使用add_axes精确控制子图位置
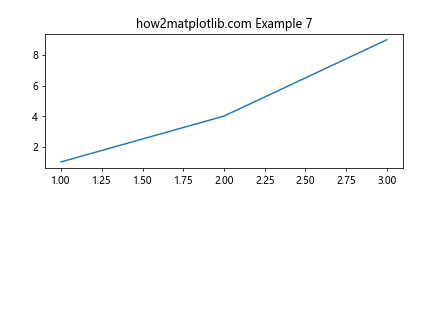
add_axes允许你通过指定子图的确切位置来创建Axes,这在需要精确布局时非常有用。
示例代码 7:使用add_axes创建精确布局
import matplotlib.pyplot as plt
import matplotlib.gridspec as gridspec

fig = plt.figure()
ax = fig.add_axes([0.1, 0.5, 0.8, 0.4])  # left, bottom, width, height
ax.plot([1, 2, 3], [1, 4, 9])
ax.set_title("how2matplotlib.com Example 7")
plt.show()
Output:
8. 结论
本文介绍了多种在Python中使用Matplotlib调整子图高度的方法。从简单的subplots_adjust到更复杂的GridSpec,再到自动布局的constrained_layout和tight_layout,每种方法都有其适用场景。通过这些工具,你可以创建出既美观又实用的数据可视化图表。
 极客教程
极客教程