Matplotlib柱状图添加数值标签:全面指南与实用技巧
参考:Adding value labels on a Matplotlib Bar Chart
Matplotlib是Python中最流行的数据可视化库之一,它提供了丰富的绘图功能,其中柱状图(Bar Chart)是一种常用的图表类型。在数据分析和展示中,为柱状图添加数值标签可以大大提高图表的可读性和信息传递效果。本文将详细介绍如何在Matplotlib柱状图中添加数值标签,包括基本方法、自定义样式、处理复杂数据等多个方面。
1. 基础柱状图绘制
在开始添加数值标签之前,我们先回顾一下如何使用Matplotlib绘制基本的柱状图。以下是一个简单的示例:
import matplotlib.pyplot as plt

categories = ['A', 'B', 'C', 'D']
values = [25, 40, 30, 55]

plt.figure(figsize=(10, 6))
plt.bar(categories, values)
plt.title('Basic Bar Chart - how2matplotlib.com')
plt.xlabel('Categories')
plt.ylabel('Values')
plt.show()
Output:
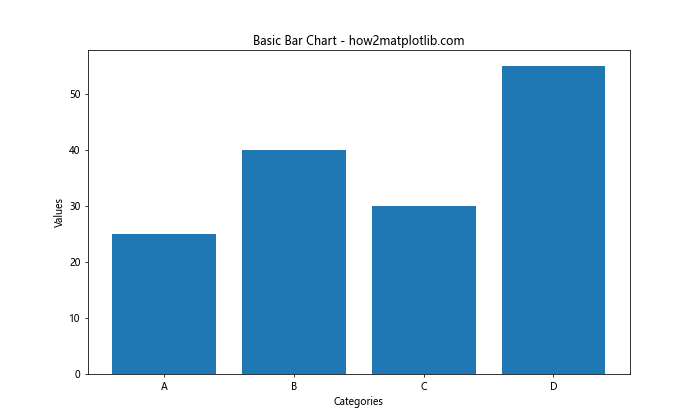
这段代码创建了一个简单的柱状图,包含四个类别和对应的数值。接下来,我们将在此基础上添加数值标签。
2. 添加基本数值标签
为柱状图添加数值标签的最简单方法是使用plt.text()函数。我们可以遍历每个柱子,并在适当的位置添加文本:
import matplotlib.pyplot as plt

categories = ['A', 'B', 'C', 'D']
values = [25, 40, 30, 55]

plt.figure(figsize=(10, 6))
bars = plt.bar(categories, values)

for bar in bars:
    height = bar.get_height()
    plt.text(bar.get_x() + bar.get_width()/2., height,
             f'{height}',
             ha='center', va='bottom')

plt.title('Bar Chart with Value Labels - how2matplotlib.com')
plt.xlabel('Categories')
plt.ylabel('Values')
plt.show()
Output:

在这个例子中,我们遍历每个柱子(bar),获取其高度,然后使用plt.text()在柱子顶部添加文本。ha='center'和va='bottom'参数用于调整文本的水平和垂直对齐方式。
3. 自定义标签样式
我们可以通过调整plt.text()函数的参数来自定义标签的样式,包括字体大小、颜色、旋转角度等:
import matplotlib.pyplot as plt

categories = ['A', 'B', 'C', 'D']
values = [25, 40, 30, 55]

plt.figure(figsize=(10, 6))
bars = plt.bar(categories, values)

for bar in bars:
    height = bar.get_height()
    plt.text(bar.get_x() + bar.get_width()/2., height,
             f'{height}',
             ha='center', va='bottom',
             fontsize=12, color='red', rotation=45)

plt.title('Customized Value Labels - how2matplotlib.com')
plt.xlabel('Categories')
plt.ylabel('Values')
plt.show()
Output:
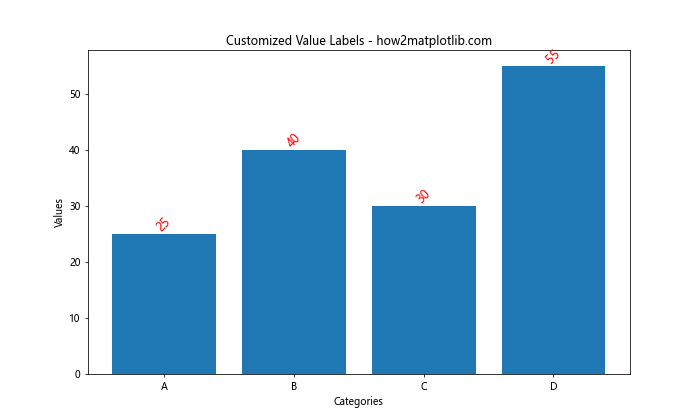
在这个例子中,我们设置了标签的字体大小为12,颜色为红色,并将文本旋转45度。这些自定义选项可以根据需要进行调整,以适应不同的设计需求。
4. 处理负值
当柱状图包含负值时,我们需要调整标签的位置,以确保它们显示在正确的位置:
import matplotlib.pyplot as plt

categories = ['A', 'B', 'C', 'D', 'E']
values = [25, -15, 30, -10, 40]

plt.figure(figsize=(10, 6))
bars = plt.bar(categories, values)

for bar in bars:
    height = bar.get_height()
    plt.text(bar.get_x() + bar.get_width()/2.,
             height if height >= 0 else height - 1,
             f'{height}',
             ha='center', va='bottom' if height >= 0 else 'top')

plt.title('Bar Chart with Negative Values - how2matplotlib.com')
plt.xlabel('Categories')
plt.ylabel('Values')
plt.axhline(y=0, color='k', linestyle='-', linewidth=0.5)
plt.show()
Output:
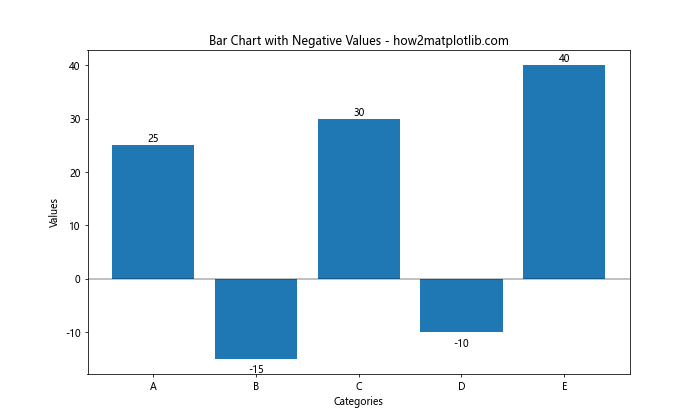
在这个例子中,我们根据值的正负来调整标签的垂直对齐方式。对于负值,我们将标签放在柱子的下方,并使用va='top'来对齐。
5. 堆叠柱状图的标签
对于堆叠柱状图,我们需要计算每个部分的累积高度,并在适当的位置添加标签:
import matplotlib.pyplot as plt
import numpy as np

categories = ['A', 'B', 'C', 'D']
values1 = [20, 35, 30, 35]
values2 = [25, 25, 15, 30]

plt.figure(figsize=(10, 6))
bars1 = plt.bar(categories, values1, label='Group 1')
bars2 = plt.bar(categories, values2, bottom=values1, label='Group 2')

def add_labels(bars):
    for bar in bars:
        height = bar.get_height()
        plt.text(bar.get_x() + bar.get_width()/2., bar.get_y() + height/2,
                 f'{height}',
                 ha='center', va='center')

add_labels(bars1)
add_labels(bars2)

plt.title('Stacked Bar Chart with Labels - how2matplotlib.com')
plt.xlabel('Categories')
plt.ylabel('Values')
plt.legend()
plt.show()
Output:
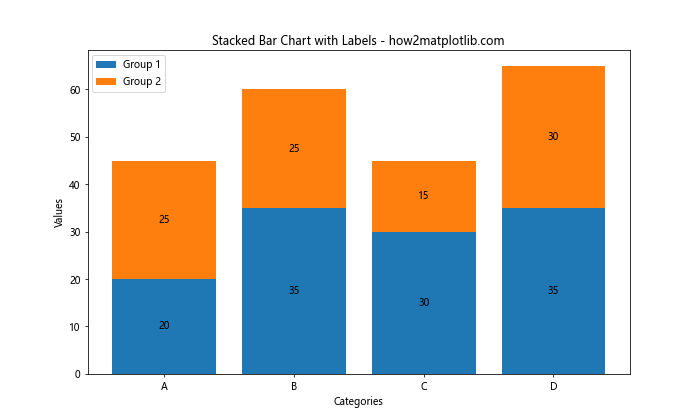
这个例子展示了如何为堆叠柱状图的每个部分添加标签。我们定义了一个add_labels函数来复用标签添加逻辑,并将标签放置在每个部分的中心。
6. 水平柱状图的标签
水平柱状图(也称为条形图)的标签添加方式略有不同:
import matplotlib.pyplot as plt

categories = ['A', 'B', 'C', 'D']
values = [25, 40, 30, 55]

plt.figure(figsize=(10, 6))
bars = plt.barh(categories, values)

for bar in bars:
    width = bar.get_width()
    plt.text(width, bar.get_y() + bar.get_height()/2.,
             f'{width}',
             ha='left', va='center')

plt.title('Horizontal Bar Chart with Labels - how2matplotlib.com')
plt.xlabel('Values')
plt.ylabel('Categories')
plt.show()
Output:
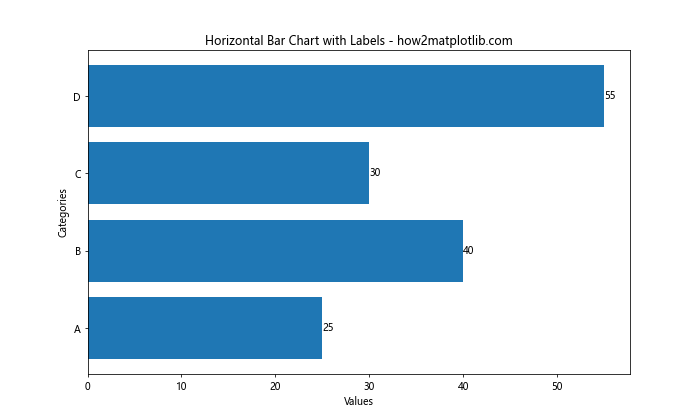
在水平柱状图中,我们使用plt.barh()函数,并调整标签的位置和对齐方式。标签被放置在每个条的右侧,并垂直居中对齐。
7. 百分比标签
有时我们需要显示百分比而不是绝对值。以下是一个示例:
import matplotlib.pyplot as plt

categories = ['A', 'B', 'C', 'D']
values = [25, 40, 30, 55]
total = sum(values)

plt.figure(figsize=(10, 6))
bars = plt.bar(categories, values)

for bar in bars:
    height = bar.get_height()
    percentage = height / total * 100
    plt.text(bar.get_x() + bar.get_width()/2., height,
             f'{percentage:.1f}%',
             ha='center', va='bottom')

plt.title('Bar Chart with Percentage Labels - how2matplotlib.com')
plt.xlabel('Categories')
plt.ylabel('Values')
plt.show()
Output:
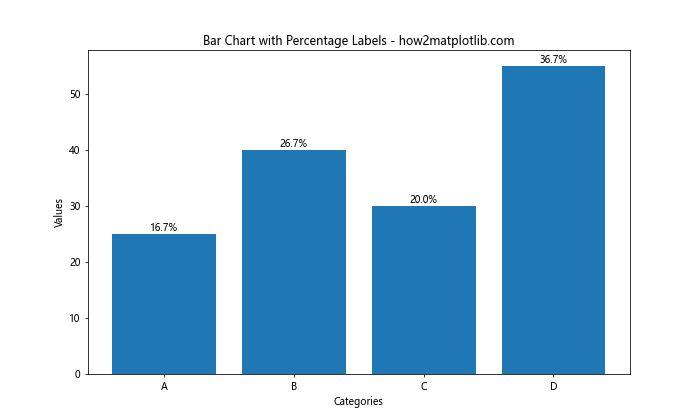
这个例子计算了每个值占总和的百分比,并将结果显示为标签。我们使用:.1f格式化字符串来限制小数点后的位数。
8. 动态调整标签位置
当柱子高度差异很大时,固定的标签位置可能不太理想。我们可以根据柱子的高度动态调整标签的位置:
import matplotlib.pyplot as plt

categories = ['A', 'B', 'C', 'D', 'E']
values = [5, 25, 50, 75, 100]

plt.figure(figsize=(10, 6))
bars = plt.bar(categories, values)

for bar in bars:
    height = bar.get_height()
    if height < 30:
        va = 'bottom'
        y = height
    else:
        va = 'top'
        y = height - 5

    plt.text(bar.get_x() + bar.get_width()/2., y,
             f'{height}',
             ha='center', va=va)

plt.title('Dynamic Label Positioning - how2matplotlib.com')
plt.xlabel('Categories')
plt.ylabel('Values')
plt.ylim(0, max(values) * 1.1)
plt.show()
Output:
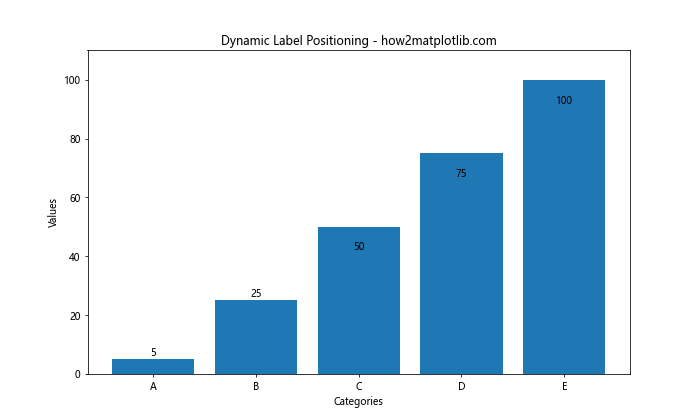
在这个例子中,我们根据柱子的高度来决定标签是放在柱子内部还是顶部。这种方法可以提高标签的可读性,特别是当数据范围很大时。
9. 使用注释(Annotation)
除了使用plt.text(),我们还可以使用plt.annotate()函数来添加更灵活的标签:
import matplotlib.pyplot as plt

categories = ['A', 'B', 'C', 'D']
values = [25, 40, 30, 55]

plt.figure(figsize=(10, 6))
bars = plt.bar(categories, values)

for bar in bars:
    height = bar.get_height()
    plt.annotate(f'{height}',
                 xy=(bar.get_x() + bar.get_width() / 2, height),
                 xytext=(0, 3),  # 3 points vertical offset
                 textcoords="offset points",
                 ha='center', va='bottom')

plt.title('Bar Chart with Annotations - how2matplotlib.com')
plt.xlabel('Categories')
plt.ylabel('Values')
plt.show()
Output:
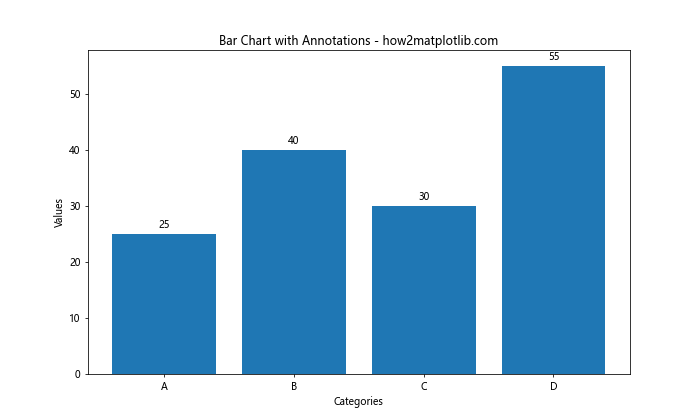
plt.annotate()函数提供了更多的控制选项,例如添加箭头或调整文本的精确位置。
10. 处理长标签
当标签文本较长时,可能需要调整其显示方式以避免重叠:
import matplotlib.pyplot as plt

categories = ['Category A', 'Category B', 'Category C', 'Category D']
values = [25, 40, 30, 55]

plt.figure(figsize=(12, 6))
bars = plt.bar(categories, values)

for bar in bars:
    height = bar.get_height()
    plt.text(bar.get_x() + bar.get_width()/2., height,
             f'Value: {height}',
             ha='center', va='bottom', rotation=45)

plt.title('Bar Chart with Long Labels - how2matplotlib.com')
plt.xlabel('Categories')
plt.ylabel('Values')
plt.xticks(rotation=45, ha='right')
plt.tight_layout()
plt.show()
Output:
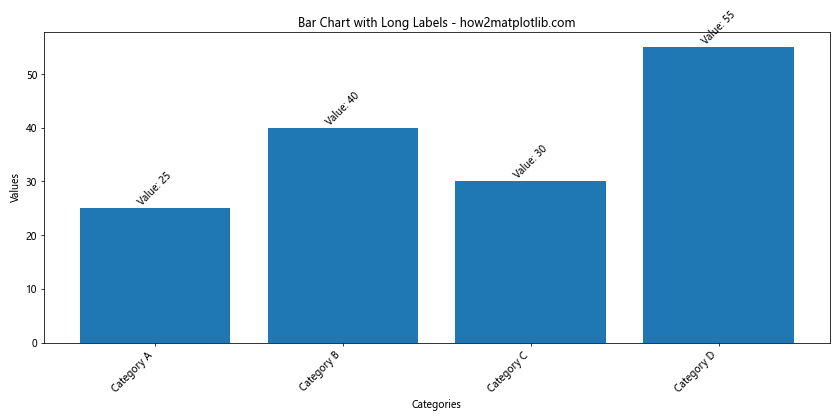
在这个例子中,我们旋转了x轴标签和数值标签,以适应较长的文本。plt.tight_layout()函数用于自动调整子图参数,以给标签留出足够的空间。
11. 使用格式化字符串
为了更好地控制标签的格式,我们可以使用Python的格式化字符串功能:
import matplotlib.pyplot as plt

categories = ['A', 'B', 'C', 'D']
values = [25.75, 40.33, 30.20, 55.15]

plt.figure(figsize=(10, 6))
bars = plt.bar(categories, values)

for bar in bars:
    height = bar.get_height()
    plt.text(bar.get_x() + bar.get_width()/2., height,
             f'{height:.2f}',
             ha='center', va='bottom')

plt.title('Formatted Value Labels - how2matplotlib.com')
plt.xlabel('Categories')
plt.ylabel('Values')
plt.show()
Output:
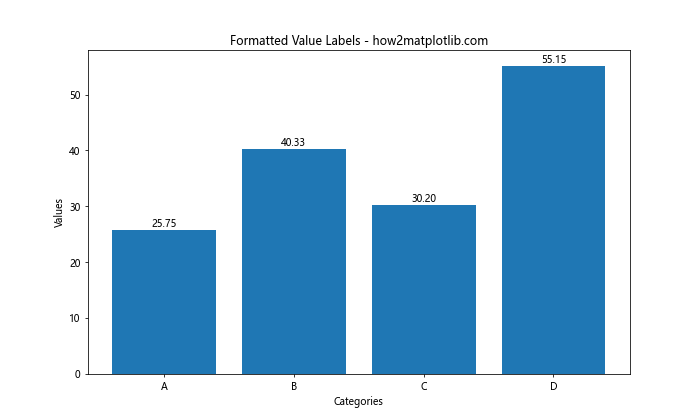
这个例子使用:.2f格式化字符串来限制小数点后的位数为两位。你可以根据需要调整格式化字符串,例如使用:.0f来显示整数,或:.1%来显示百分比。
12. 条件格式化
有时我们可能想根据数值的大小来改变标签的颜色或样式:
import matplotlib.pyplot as plt

categories = ['A', 'B', 'C', 'D', 'E']
values = [15, 30, 45, 60, 75]

plt.figure(figsize=(10, 6))
bars = plt.bar(categories, values)

for bar in bars:
    height = bar.get_height()
    color = 'red' if height > 50 else 'black'
    weight = 'bold' if height > 50 else 'normal'
    plt.text(bar.get_x() + bar.get_width()/2., height,
             f'{height}',
             ha='center', va='bottom',
             color=color, weight=weight)

plt.title('Conditional Label Formatting - how2matplotlib.com')
plt.xlabel('Categories')
plt.ylabel('Values')
plt.show()
Output:
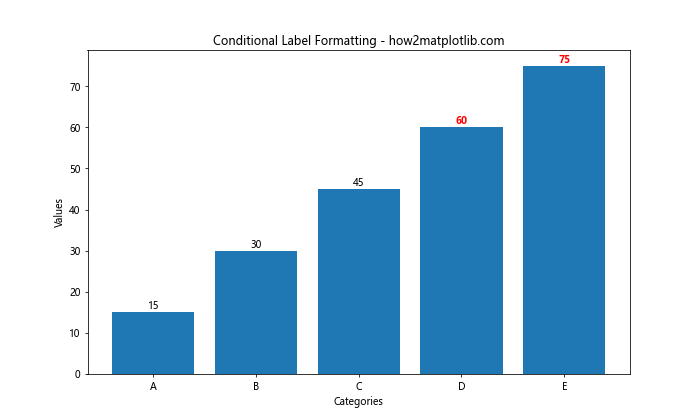
在这个例子中,我们根据值的大小来改变标签的颜色和字体粗细。这种方法可以帮助突出显示重要的数据点。
13. 添加单位或前缀
为了使标签更具信息量,我们可能需要添加单位或前缀:
import matplotlib.pyplot as plt

categories = ['A', 'B', 'C', 'D']
values = [2500, 4000, 3000, 5500]

plt.figure(figsize=(10, 6))
bars = plt.bar(categories, values)

for bar in bars:
    height = bar.get_height()
    plt.text(bar.get_x() + bar.get_width()/2., height,
             f'{height:,}',
             ha='center', va='bottom')

plt.title('BarChart with Currency Labels - how2matplotlib.com')
plt.xlabel('Categories')
plt.ylabel('Sales ()')
plt.show()
Output:
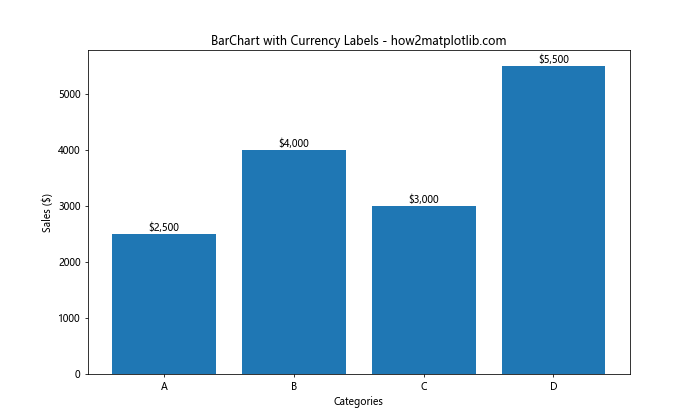
这个例子在标签前添加了美元符号,并使用,格式化符来添加千位分隔符,使大数字更易读。
14. 多行标签
有时我们可能需要在标签中显示多行信息:
import matplotlib.pyplot as plt

categories = ['A', 'B', 'C', 'D']
values = [25, 40, 30, 55]
percentages = [15, 24, 18, 33]

plt.figure(figsize=(10, 6))
bars = plt.bar(categories, values)

for bar, percentage in zip(bars, percentages):
    height = bar.get_height()
    plt.text(bar.get_x() + bar.get_width()/2., height,
             f'{height}\n({percentage}%)',
             ha='center', va='bottom')

plt.title('Multi-line Value Labels - how2matplotlib.com')
plt.xlabel('Categories')
plt.ylabel('Values')
plt.show()
Output:
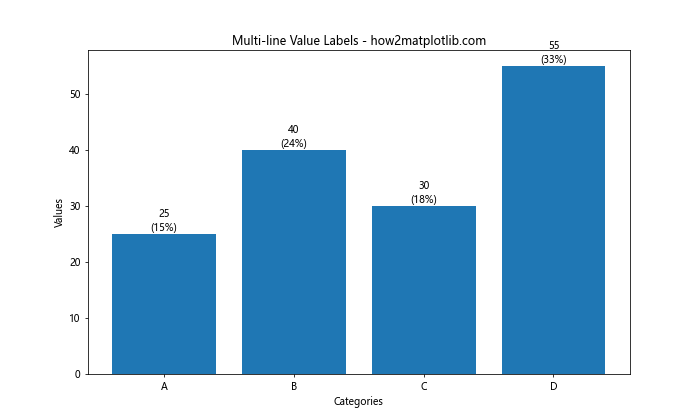
在这个例子中,我们在标签中同时显示了绝对值和百分比,使用\n来创建换行。
15. 使用不同的字体
Matplotlib允许我们使用不同的字体来自定义标签的外观:
import matplotlib.pyplot as plt

categories = ['A', 'B', 'C', 'D']
values = [25, 40, 30, 55]

plt.figure(figsize=(10, 6))
bars = plt.bar(categories, values)

for bar in bars:
    height = bar.get_height()
    plt.text(bar.get_x() + bar.get_width()/2., height,
             f'{height}',
             ha='center', va='bottom',
             fontname='Comic Sans MS', fontsize=12)

plt.title('Custom Font for Labels - how2matplotlib.com', fontname='Arial')
plt.xlabel('Categories')
plt.ylabel('Values')
plt.show()
Output:
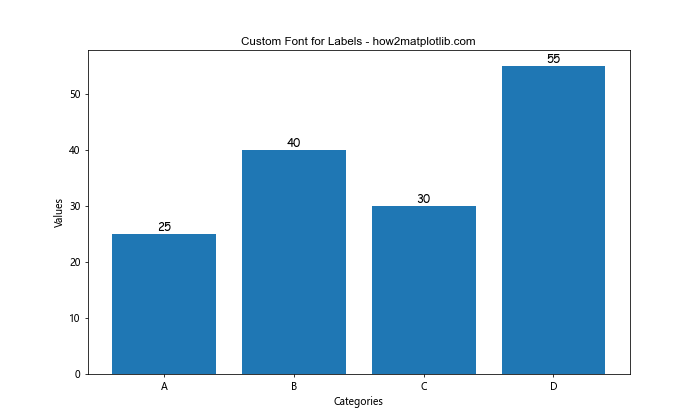
这个例子使用了”Comic Sans MS”字体来显示标签。请注意,使用特定字体可能需要确保该字体在你的系统上可用。
16. 标签与数据分离
有时,将标签数据与图表数据分开管理可能更方便:
import matplotlib.pyplot as plt

categories = ['A', 'B', 'C', 'D']
values = [25, 40, 30, 55]
labels = ['Good', 'Great', 'OK', 'Excellent']

plt.figure(figsize=(10, 6))
bars = plt.bar(categories, values)

for bar, label in zip(bars, labels):
    height = bar.get_height()
    plt.text(bar.get_x() + bar.get_width()/2., height,
             label,
             ha='center', va='bottom')

plt.title('Separate Labels Data - how2matplotlib.com')
plt.xlabel('Categories')
plt.ylabel('Values')
plt.show()
Output:
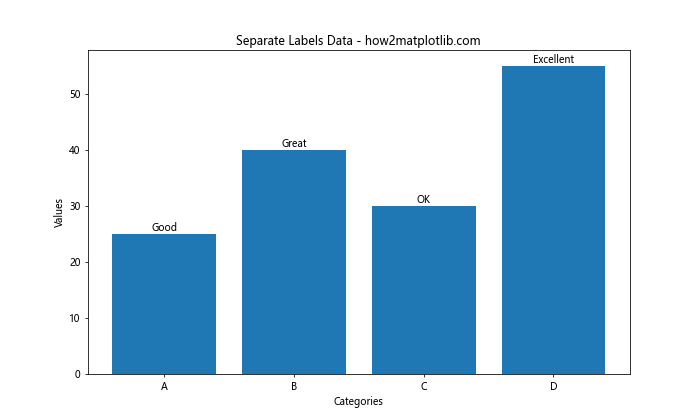
这种方法允许你为每个柱子使用自定义的标签文本,而不仅仅是显示数值。
17. 使用颜色映射
我们可以使用颜色映射来为标签添加额外的视觉信息:
import matplotlib.pyplot as plt
import numpy as np

categories = ['A', 'B', 'C', 'D', 'E']
values = [25, 40, 30, 55, 45]

plt.figure(figsize=(10, 6))
bars = plt.bar(categories, values, color=plt.cm.viridis(np.linspace(0, 1, len(categories))))

for bar in bars:
    height = bar.get_height()
    plt.text(bar.get_x() + bar.get_width()/2., height,
             f'{height}',
             ha='center', va='bottom',
             color='white')

plt.title('Color-mapped Labels - how2matplotlib.com')
plt.xlabel('Categories')
plt.ylabel('Values')
plt.show()
Output:
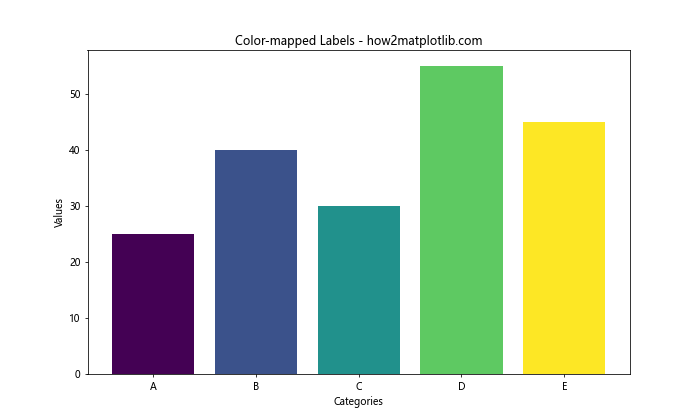
这个例子使用了viridis颜色映射来为柱子着色,并将标签颜色设置为白色以提高可读性。
18. 添加误差线和标签
当数据包含误差范围时,我们可以同时显示误差线和数值标签:
import matplotlib.pyplot as plt
import numpy as np

categories = ['A', 'B', 'C', 'D']
values = [25, 40, 30, 55]
errors = [2, 3, 4, 5]

plt.figure(figsize=(10, 6))
bars = plt.bar(categories, values, yerr=errors, capsize=5)

for bar in bars:
    height = bar.get_height()
    plt.text(bar.get_x() + bar.get_width()/2., height,
             f'{height}±{errors[bars.index(bar)]}',
             ha='center', va='bottom')

plt.title('Bar Chart with Error Bars and Labels - how2matplotlib.com')
plt.xlabel('Categories')
plt.ylabel('Values')
plt.show()
Output:
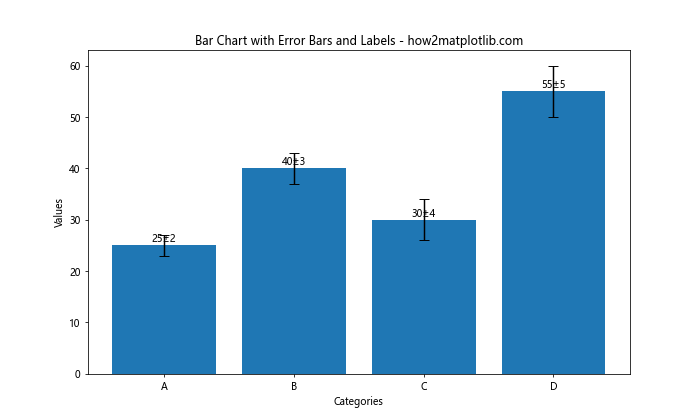
这个例子展示了如何在柱状图上添加误差线,并在标签中包含误差值。
19. 使用自定义函数格式化标签
对于更复杂的标签格式化需求,我们可以定义一个自定义函数:
import matplotlib.pyplot as plt

def format_label(value):
    if value < 30:
        return f'Low: {value}'
    elif value < 50:
        return f'Medium: {value}'
    else:
        return f'High: {value}'

categories = ['A', 'B', 'C', 'D', 'E']
values = [25, 40, 30, 55, 45]

plt.figure(figsize=(10, 6))
bars = plt.bar(categories, values)

for bar in bars:
    height = bar.get_height()
    plt.text(bar.get_x() + bar.get_width()/2., height,
             format_label(height),
             ha='center', va='bottom')

plt.title('Custom Formatted Labels - how2matplotlib.com')
plt.xlabel('Categories')
plt.ylabel('Values')
plt.show()
Output:
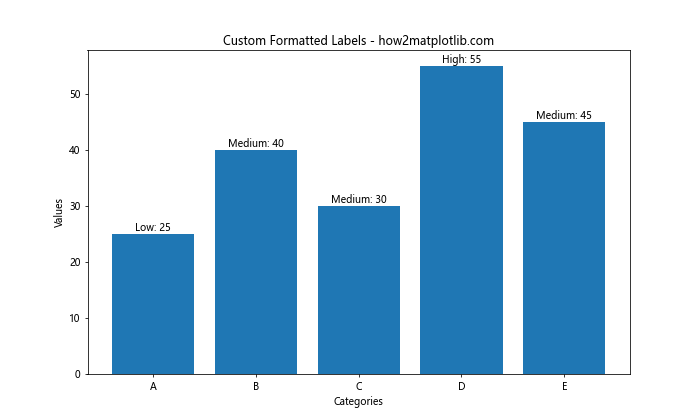
这个例子定义了一个format_label函数,根据值的大小返回不同的标签文本。
20. 结合其他图表元素
最后,我们可以将标签与其他图表元素结合,以创建更丰富的可视化:
import matplotlib.pyplot as plt
import numpy as np

categories = ['A', 'B', 'C', 'D']
values1 = [25, 40, 30, 55]
values2 = [20, 35, 25, 45]

x = np.arange(len(categories))
width = 0.35

fig, ax = plt.subplots(figsize=(12, 6))
rects1 = ax.bar(x - width/2, values1, width, label='Group 1')
rects2 = ax.bar(x + width/2, values2, width, label='Group 2')

def autolabel(rects):
    for rect in rects:
        height = rect.get_height()
        ax.annotate(f'{height}',
                    xy=(rect.get_x() + rect.get_width() / 2, height),
                    xytext=(0, 3),  # 3 points vertical offset
                    textcoords="offset points",
                    ha='center', va='bottom')

autolabel(rects1)
autolabel(rects2)

ax.set_title('Grouped Bar Chart with Labels - how2matplotlib.com')
ax.set_xlabel('Categories')
ax.set_ylabel('Values')
ax.set_xticks(x)
ax.set_xticklabels(categories)
ax.legend()

fig.tight_layout()
plt.show()
Output:
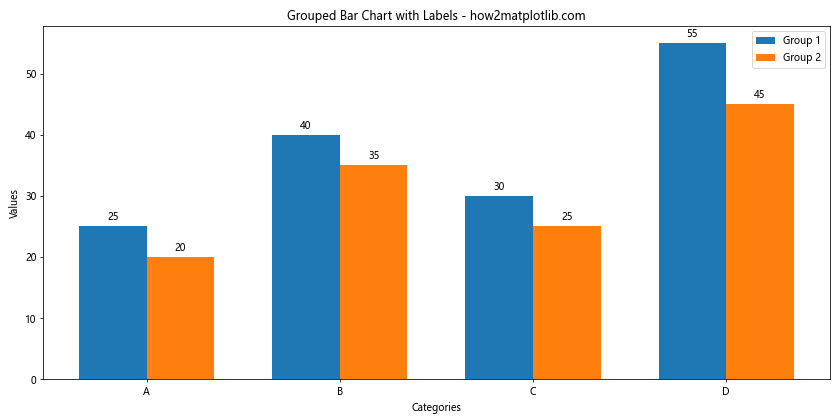
这个最后的例子展示了如何创建分组柱状图,并为每个柱子添加标签。它结合了多个我们之前讨论过的技巧,包括使用annotate函数和自定义标签函数。
总结起来,在Matplotlib柱状图中添加数值标签是一个强大的工具,可以显著提高数据可视化的信息量和可读性。通过调整标签的位置、样式、格式和内容,我们可以创建出既美观又信息丰富的图表。无论是简单的数值显示,还是复杂的条件格式化,Matplotlib都提供了灵活的选项来满足各种需求。在实际应用中,选择合适的标签样式和内容对于有效传达数据信息至关重要。
 极客教程
极客教程