Matplotlib中如何在图表内添加文本:全面指南
参考:Add Text Inside the Plot in Matplotlib
Matplotlib是Python中最流行的数据可视化库之一,它提供了丰富的功能来创建各种类型的图表。在数据可视化过程中,往往需要在图表内添加文本来解释数据点、标注重要信息或提供额外的上下文。本文将详细介绍如何在Matplotlib图表中添加文本,包括基本文本添加、文本属性设置、特殊文本效果以及高级文本定位技巧等。
1. 基本文本添加
在Matplotlib中,最简单的添加文本的方法是使用text()函数。这个函数允许你在图表的任何位置添加文本。
1.1 使用text()函数
text()函数的基本语法如下:
import matplotlib.pyplot as plt

fig, ax = plt.subplots()
ax.text(x, y, 'Your text here - how2matplotlib.com')
plt.show()
在这个例子中,x和y是文本在图表中的坐标位置。默认情况下,这些坐标使用数据坐标系统。
让我们看一个具体的例子:
import matplotlib.pyplot as plt

fig, ax = plt.subplots()
ax.plot([0, 1, 2, 3, 4], [0, 1, 4, 9, 16])
ax.text(2, 8, 'Quadratic curve - how2matplotlib.com')
plt.title('Simple Plot with Text')
plt.xlabel('X-axis')
plt.ylabel('Y-axis')
plt.show()
Output:
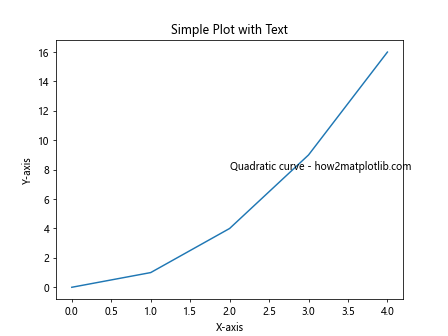
在这个例子中,我们绘制了一个简单的二次曲线,并在坐标(2, 8)处添加了文本”Quadratic curve – how2matplotlib.com”。这个文本会出现在曲线的上方,解释了图表中显示的是什么类型的曲线。
1.2 使用annotate()函数
annotate()函数提供了更多的灵活性,特别是当你想要指向图表中的特定点时。它不仅可以添加文本,还可以添加箭头或其他连接线。
基本语法如下:
import matplotlib.pyplot as plt

fig, ax = plt.subplots()
ax.annotate('Annotation text - how2matplotlib.com', xy=(x, y), xytext=(x_text, y_text))
plt.show()
这里,xy参数指定了要标注的点的坐标,而xytext参数指定了文本的位置。
让我们看一个更具体的例子:
import matplotlib.pyplot as plt
import numpy as np

x = np.linspace(0, 10, 100)
y = np.sin(x)

fig, ax = plt.subplots()
ax.plot(x, y)

ax.annotate('Maximum - how2matplotlib.com', xy=(np.pi/2, 1), xytext=(4, 0.8),
            arrowprops=dict(facecolor='black', shrink=0.05))

plt.title('Sine Wave with Annotation')
plt.xlabel('X-axis')
plt.ylabel('Y-axis')
plt.show()
Output:
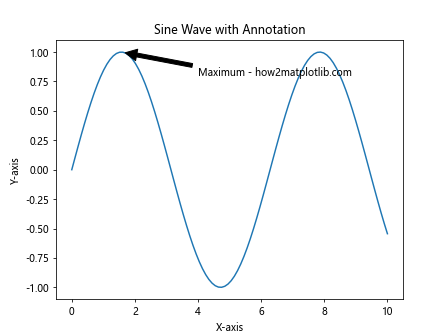
在这个例子中,我们绘制了一个正弦波,并在其最大值点(π/2, 1)添加了一个注释。注释文本位于(4, 0.8),并用一个箭头指向最大值点。
2. 文本属性设置
Matplotlib提供了多种方式来自定义文本的外观,包括字体、大小、颜色、样式等。
2.1 设置字体属性
你可以使用fontdict参数来设置文本的多个属性:
import matplotlib.pyplot as plt

fig, ax = plt.subplots()

font_dict = {'family': 'serif',
             'color':  'darkred',
             'weight': 'normal',
             'size': 16,
             }

ax.text(0.5, 0.5, 'Styled Text - how2matplotlib.com', fontdict=font_dict)
plt.title('Text with Custom Font Properties')
plt.show()
Output:
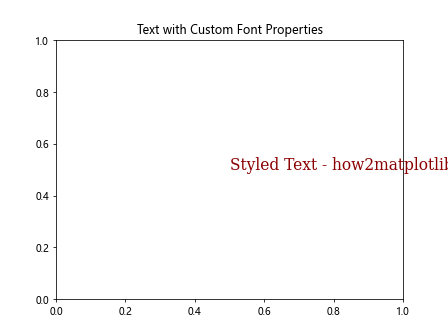
在这个例子中,我们创建了一个字典font_dict来指定文本的字体系列、颜色、粗细和大小。这个字典被传递给text()函数的fontdict参数。
2.2 使用LaTeX渲染数学公式
Matplotlib支持使用LaTeX语法来渲染数学公式:
import matplotlib.pyplot as plt

fig, ax = plt.subplots()

ax.text(0.5, 0.5, r'\alpha>\beta - how2matplotlib.com', fontsize=20)
plt.title('LaTeX Rendered Equation')
plt.show()
Output:
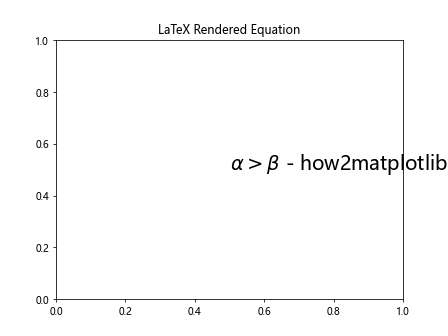
在这个例子中,我们使用了原始字符串(前缀r)和美元符号来包裹LaTeX公式。这允许我们在图表中显示数学符号和公式。
2.3 文本对齐
你可以使用horizontalalignment和verticalalignment参数来控制文本的对齐方式:
import matplotlib.pyplot as plt

fig, ax = plt.subplots()

ax.text(0.5, 0.5, 'Centered Text - how2matplotlib.com',
        horizontalalignment='center',
        verticalalignment='center')

plt.title('Text Alignment Example')
plt.show()
Output:
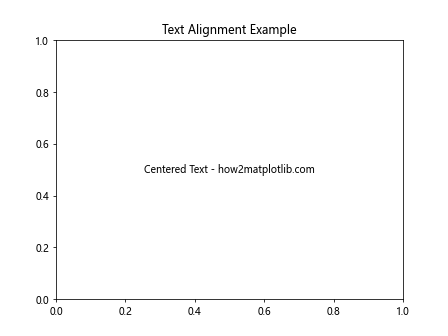
这个例子中的文本将会在指定坐标(0.5, 0.5)处水平和垂直居中对齐。
3. 特殊文本效果
Matplotlib还提供了一些特殊的文本效果,可以让你的图表更加生动和信息丰富。
3.1 文本框
你可以使用bbox参数为文本添加一个背景框:
import matplotlib.pyplot as plt

fig, ax = plt.subplots()

ax.text(0.5, 0.5, 'Text in a box - how2matplotlib.com',
        bbox=dict(facecolor='yellow', alpha=0.5, edgecolor='red'))

plt.title('Text with Background Box')
plt.show()
Output:
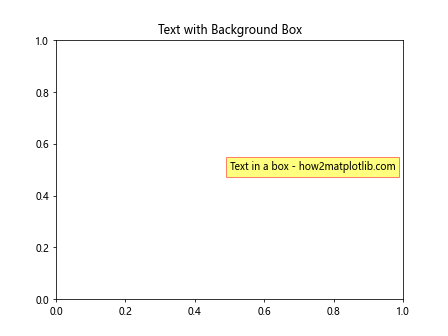
在这个例子中,我们为文本添加了一个黄色背景的框,框的边缘是红色的,透明度为0.5。
3.2 旋转文本
使用rotation参数可以旋转文本:
import matplotlib.pyplot as plt

fig, ax = plt.subplots()

ax.text(0.5, 0.5, 'Rotated Text - how2matplotlib.com', rotation=45)

plt.title('Rotated Text Example')
plt.show()
Output:
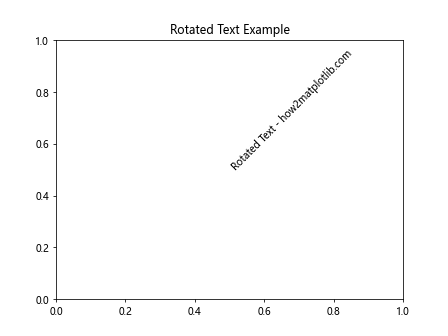
这个例子中的文本将会旋转45度。
3.3 文本阴影
你可以使用path_effects来为文本添加阴影效果:
import matplotlib.pyplot as plt
import matplotlib.patheffects as path_effects

fig, ax = plt.subplots()

text = ax.text(0.5, 0.5, 'Text with shadow - how2matplotlib.com', fontsize=20)
text.set_path_effects([path_effects.withSimplePatchShadow()])

plt.title('Text with Shadow Effect')
plt.show()
Output:
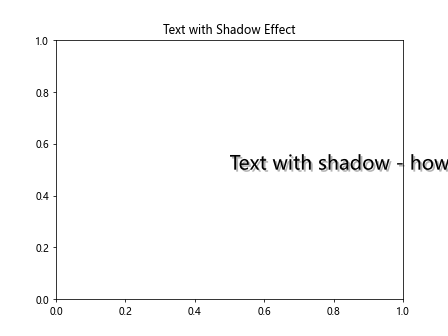
这个例子为文本添加了一个简单的阴影效果,使文本看起来更加立体。
4. 高级文本定位技巧
在某些情况下,你可能需要更精确地控制文本的位置,或者根据数据动态放置文本。
4.1 使用相对坐标
你可以使用transform参数来使用相对坐标:
import matplotlib.pyplot as plt

fig, ax = plt.subplots()

ax.text(0.5, 0.5, 'Center of the plot - how2matplotlib.com',
        transform=ax.transAxes,
        horizontalalignment='center',
        verticalalignment='center')

plt.title('Text Positioned Using Relative Coordinates')
plt.show()
Output:
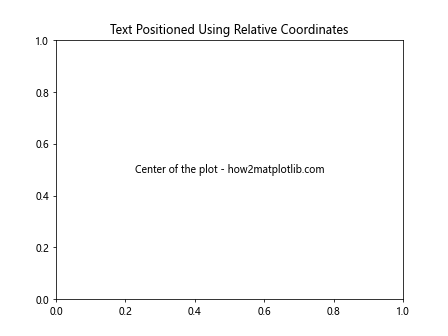
在这个例子中,transform=ax.transAxes使得坐标系统变为相对于轴的坐标,其中(0,0)是轴的左下角,(1,1)是右上角。
4.2 根据数据动态放置文本
你可以根据数据的特征动态地放置文本:
import matplotlib.pyplot as plt
import numpy as np

x = np.linspace(0, 10, 100)
y = np.sin(x)

fig, ax = plt.subplots()
ax.plot(x, y)

max_index = np.argmax(y)
ax.text(x[max_index], y[max_index], f'Max: {y[max_index]:.2f} - how2matplotlib.com',
        verticalalignment='bottom')

plt.title('Dynamic Text Placement')
plt.show()
Output:
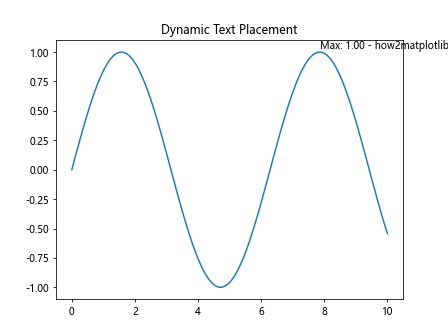
在这个例子中,我们找到了正弦波的最大值点,并在该点上方放置了一个文本标签。
4.3 避免文本重叠
当你需要在图表中添加多个文本标签时,可能会遇到文本重叠的问题。Matplotlib提供了adjustText库来帮助解决这个问题:
import matplotlib.pyplot as plt
import numpy as np
from adjustText import adjust_text

fig, ax = plt.subplots()

x = np.random.rand(10)
y = np.random.rand(10)
names = [f'Point {i} - how2matplotlib.com' for i in range(10)]

ax.scatter(x, y)

texts = []
for i, name in enumerate(names):
    texts.append(ax.text(x[i], y[i], name))

adjust_text(texts)

plt.title('Text Overlap Avoidance')
plt.show()
在这个例子中,我们使用adjust_text函数来自动调整文本的位置,以避免重叠。
5. 文本动画
Matplotlib还支持创建动画,你可以使用这个功能来创建动态的文本效果。
5.1 简单的文本动画
以下是一个简单的文本动画示例:
import matplotlib.pyplot as plt
import matplotlib.animation as animation

fig, ax = plt.subplots()

text = ax.text(0.5, 0.5, '', ha='center', va='center', fontsize=20)

def animate(frame):
    text.set_text(f'Frame {frame} - how2matplotlib.com')
    return text,

ani = animation.FuncAnimation(fig, animate, frames=range(60), interval=50)

plt.title('Simple Text Animation')
plt.show()
Output:
这个例子创建了一个简单的动画,文本内容会随时间变化。
5.2 文本淡入淡出效果
你可以通过改变文本的透明度来创建淡入淡出效果:
import matplotlib.pyplot as plt
import matplotlib.animation as animation
import numpy as np

fig, ax = plt.subplots()

text = ax.text(0.5, 0.5, 'Fading Text - how2matplotlib.com', ha='center', va='center', fontsize=20)

def animate(frame):
    alpha = np.sin(frame * 0.1) * 0.5 + 0.5
    text.set_alpha(alpha)
    return text,

ani = animation.FuncAnimation(fig, animate, frames=range(60), interval=50)

plt.title('Text Fade In/Out Animation')
plt.show()
Output:
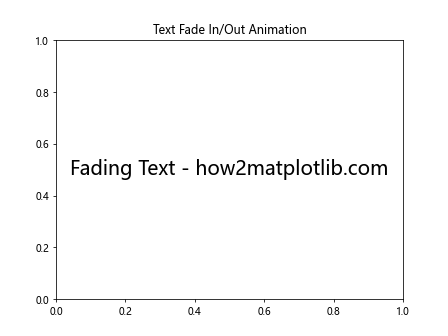
这个例子创建了一个文本淡入淡出的动画效果。
6. 多行文本和文本换行
有时候,你可能需要在图表中添加多行文本或者处理长文本的换行问题。
6.1 使用换行符
最简单的方法是在文本字符串中使用换行符\n:
import matplotlib.pyplot as plt

fig, ax = plt.subplots()

ax.text(0.5, 0.5, 'Line 1\nLine 2\nLine 3 - how2matplotlib.com',
        ha='center', va='center')

plt.title('Multi-line Text Using Newline Characters')
plt.show()
Output:
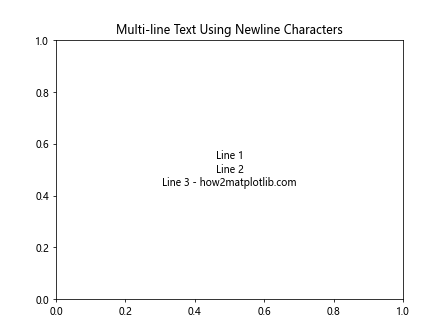
这个例子展示了如何使用换行符来创建多行文本。
6.2 使用textwrap模块
对于长文本,你可以使用Python的textwrap模块来自动换行:
import matplotlib.pyplot as plt
import textwrap

fig, ax = plt.subplots()

long_text = "This is a very long text that needs to be wrapped. It will be automatically split into multiple lines. - how2matplotlib.com"
wrapped_text = textwrap.fill(long_text, width=30)

ax.text(0.5, 0.5, wrapped_text, ha='center', va='center')

plt.title('Text Wrapping Using textwrap Module')
plt.show()
Output:
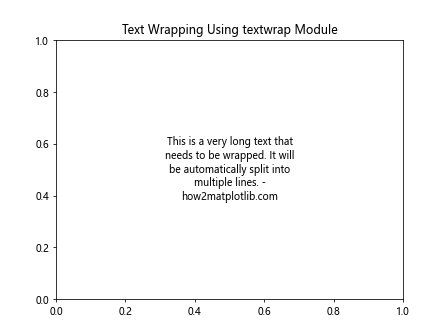
这个例子使用textwrap.fill()函数来将长文本自动分割成多行。
7. 文本与其他图形元素的交互
文本不仅可以单独使用,还可以与其他图形元素结合,创造出更丰富的视觉效果。
7.1 文本作为图例
你可以使用文本来创建自定义的图例:
import matplotlib.pyplot as plt
import numpy as np

fig, ax = plt.subplots()

x = np.linspace(0, 10, 100)
y1 = np.sin(x)
y2 = np.cos(x)

ax.plot(x, y1, 'r')
ax.plot(x, y2, 'b')

ax.text(0.1, 0.9, 'Sin curve', color='red', transform=ax.transAxes)
ax.text(0.1, 0.8, 'Cos curve', color='blue', transform=ax.transAxes)

plt.title('Custom Legend Using Text')
plt.show()
Output:
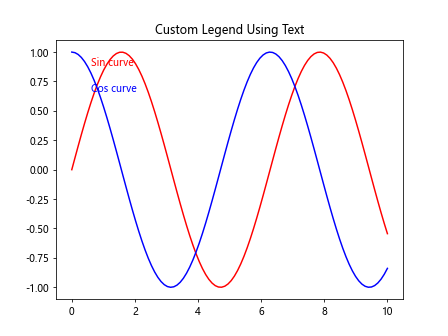
这个例子展示了如何使用文本来创建一个自定义的图例,而不是使用Matplotlib的内置图例功能。
7.2 文本与箭头结合
你可以结合使用文本和箭头来创建更具信息性的注释:
import matplotlib.pyplot as plt
import numpy as np

fig, ax = plt.subplots()

x = np.linspace(0, 10, 100)
y = np.sin(x)

ax.plot(x, y)

ax.annotate('Local maximum - how2matplotlib.com',
            xy=(np.pi/2, 1), xytext=(3, 0.5),
            arrowprops=dict(facecolor='black', shrink=0.05))

plt.title('Text with Arrow Annotation')
plt.show()
Output:
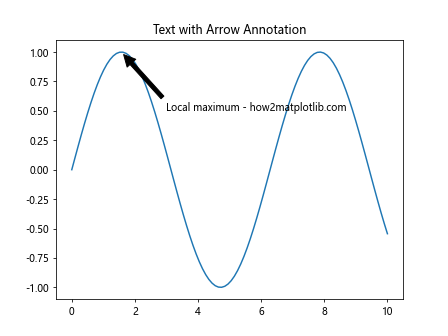
这个例子展示了如何使用annotate()函数来创建一个带箭头的文本注释,指向正弦曲线的局部最大值。
8. 文本样式和格式化
Matplotlib提供了多种方式来设置文本的样式和格式,使得你可以创建出更加美观和专业的图表。
8.1 使用HTML样式
Matplotlib支持在文本中使用一些基本的HTML标签:
import matplotlib.pyplot as plt

fig, ax = plt.subplots()

ax.text(0.5, 0.5, 'Text with <b>bold</b> and <i>italic</i> - how2matplotlib.com',
        ha='center', va='center')

plt.title('Text with HTML-like Formatting')
plt.show()
Output:
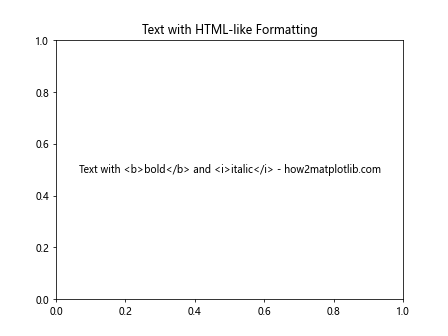
这个例子展示了如何使用HTML标签来设置文本的粗体和斜体。
8.2 使用自定义字体
你可以使用自定义字体来增强图表的视觉效果:
import matplotlib.pyplot as plt
from matplotlib import font_manager

fig, ax = plt.subplots()

font_path = '/path/to/your/font.ttf'  # 替换为你的字体文件路径
prop = font_manager.FontProperties(fname=font_path)

ax.text(0.5, 0.5, 'Custom Font Text - how2matplotlib.com',
        ha='center', va='center', fontproperties=prop)

plt.title('Text with Custom Font')
plt.show()
这个例子展示了如何使用自定义字体文件来设置文本的样式。注意要替换font_path为你实际的字体文件路径。
9. 文本与数据的结合
在数据可视化中,经常需要将文本与数据结合起来,以提供更多的上下文信息。
9.1 在数据点上添加标签
你可以在每个数据点上添加标签:
import matplotlib.pyplot as plt
import numpy as np

fig, ax = plt.subplots()

x = np.arange(5)
y = np.random.rand(5)

ax.bar(x, y)

for i, v in enumerate(y):
    ax.text(i, v, f'{v:.2f} - how2matplotlib.com', ha='center', va='bottom')

plt.title('Bar Chart with Data Labels')
plt.show()
Output:
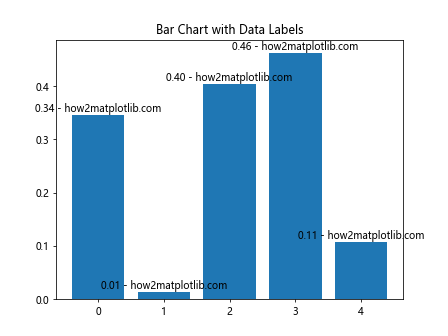
这个例子在每个柱状图上方添加了对应的数值标签。
9.2 添加统计信息
你可以在图表中添加一些统计信息:
import matplotlib.pyplot as plt
import numpy as np

fig, ax = plt.subplots()

data = np.random.randn(1000)
ax.hist(data, bins=30)

mean = np.mean(data)
std = np.std(data)

stats_text = f'Mean: {mean:.2f}\nStd Dev: {std:.2f}\n- how2matplotlib.com'
ax.text(0.95, 0.95, stats_text, transform=ax.transAxes,
        verticalalignment='top', horizontalalignment='right',
        bbox=dict(boxstyle='round', facecolor='wheat', alpha=0.5))

plt.title('Histogram with Statistics')
plt.show()
Output:
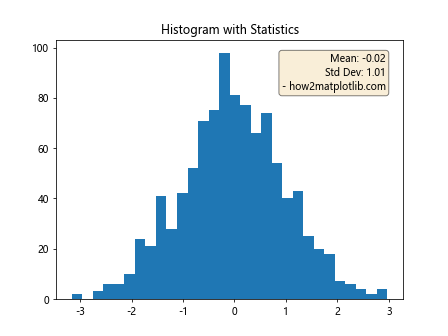
这个例子在直方图的右上角添加了数据的均值和标准差信息。
10. 文本与交互式图表
Matplotlib也支持创建交互式图表,你可以结合文本来增强交互体验。
10.1 鼠标悬停显示文本
使用mplcursors库,你可以创建鼠标悬停时显示文本的效果:
import matplotlib.pyplot as plt
import numpy as np
import mplcursors

fig, ax = plt.subplots()

x = np.linspace(0, 10, 100)
y = np.sin(x)

line = ax.plot(x, y)[0]

cursor = mplcursors.cursor(line)
cursor.connect("add", lambda sel: sel.annotation.set_text(
    f'x: {sel.target[0]:.2f}\ny: {sel.target[1]:.2f}\n- how2matplotlib.com'))

plt.title('Interactive Plot with Hover Text')
plt.show()
Output:
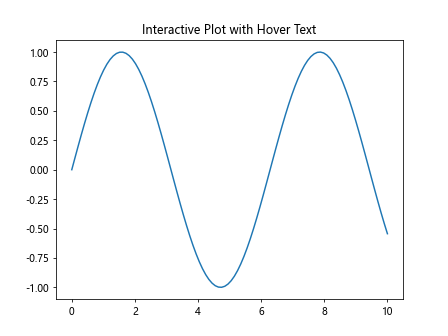
这个例子创建了一个交互式图表,当鼠标悬停在曲线上时,会显示当前点的x和y坐标。
10.2 点击显示文本
你可以使用Matplotlib的事件处理系统来创建点击显示文本的效果:
import matplotlib.pyplot as plt
import numpy as np

fig, ax = plt.subplots()

x = np.linspace(0, 10, 100)
y = np.sin(x)

line = ax.plot(x, y)[0]

annotation = ax.annotate("", xy=(0,0), xytext=(20,20),textcoords="offset points",
                         bbox=dict(boxstyle="round", fc="w"),
                         arrowprops=dict(arrowstyle="->"))
annotation.set_visible(False)

def on_click(event):
    if event.inaxes == ax:
        x, y = event.xdata, event.ydata
        annotation.xy = (x, y)
        annotation.set_text(f"x: {x:.2f}\ny: {y:.2f}\n- how2matplotlib.com")
        annotation.set_visible(True)
        fig.canvas.draw_idle()

fig.canvas.mpl_connect('button_press_event', on_click)

plt.title('Click to Show Text')
plt.show()
Output:
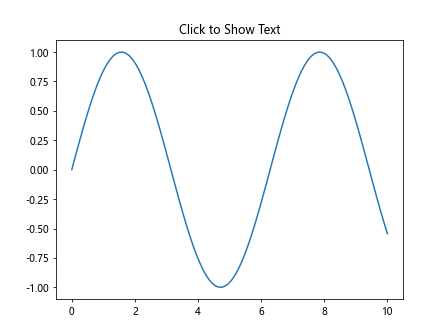
这个例子创建了一个图表,当用户点击图表上的任何位置时,会显示该点的坐标信息。
结论
在Matplotlib中添加文本是一个强大而灵活的功能,它可以大大增强你的数据可视化效果。从简单的标签到复杂的注释,从静态文本到动画效果,Matplotlib提供了丰富的工具来满足各种需求。通过本文介绍的各种技巧和方法,你应该能够在自己的图表中自如地添加和操作文本,创造出更加信息丰富、视觉吸引力强的数据可视化作品。
记住,文本不仅仅是用来标注数据点或解释图表内容,它还可以用来强调重要信息、提供上下文、甚至作为图表的主要元素。合理使用文本可以让你的图表更加清晰、专业,并更有效地传达你想要表达的信息。
最后,虽然本文提供了许多示例和技巧,但Matplotlib的功能远不止于此。随着你对Matplotlib的深入使用,你会发现更多有趣和有用的文本处理方法。不断实践和探索,你将能够创造出更加独特和有影响力的数据可视化作品。
 极客教程
极客教程