Matplotlib柱状图添加误差线:全面指南与实例
参考:Add error bars to a Matplotlib bar plot
Matplotlib是Python中最流行的数据可视化库之一,它提供了丰富的绘图功能,包括添加误差线到柱状图。误差线是表示数据不确定性或变异性的重要工具,在科学研究、数据分析和统计报告中广泛使用。本文将详细介绍如何在Matplotlib的柱状图中添加误差线,并提供多个实用示例。
1. 误差线的基本概念
误差线(Error bars)是用于表示数据点周围不确定性或变异性的图形元素。在柱状图中,误差线通常表现为从柱子顶部或底部延伸出的线段,有时还包括短横线(称为”帽子”)。误差线可以表示多种统计量,如标准差、标准误差、置信区间等。
在科学研究和数据分析中,误差线的重要性体现在:
1. 提供数据精确度的视觉表示
2. 帮助读者评估数据的可靠性
3. 便于比较不同组或条件下的数据
4. 突出显示数据的变异性或分布
2. Matplotlib中添加误差线的基本方法
在Matplotlib中,我们主要使用plt.bar()函数来创建柱状图,并使用其yerr参数来添加误差线。以下是一个基本示例:
import matplotlib.pyplot as plt
import numpy as np

# 数据
categories = ['A', 'B', 'C', 'D']
values = [3, 7, 2, 5]
errors = [0.5, 1, 0.3, 0.8]

# 创建柱状图并添加误差线
plt.figure(figsize=(8, 6))
plt.bar(categories, values, yerr=errors, capsize=5)

plt.title('Bar Plot with Error Bars - how2matplotlib.com')
plt.xlabel('Categories')
plt.ylabel('Values')
plt.show()
Output:
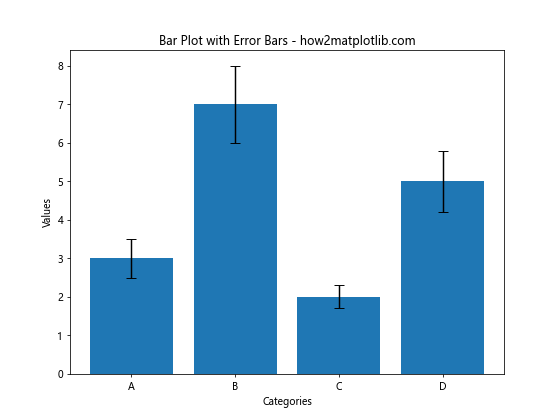
在这个例子中,我们创建了一个简单的柱状图,并为每个柱子添加了误差线。yerr参数指定了误差值,capsize参数设置了误差线顶部和底部横线(帽子)的宽度。
3. 自定义误差线样式
Matplotlib提供了多种方式来自定义误差线的外观。以下是一些常用的自定义选项:
import matplotlib.pyplot as plt
import numpy as np

categories = ['Group 1', 'Group 2', 'Group 3']
values = [4, 7, 3]
errors = [0.8, 1.2, 0.6]

plt.figure(figsize=(10, 6))
plt.bar(categories, values, yerr=errors,
        capsize=8,
        ecolor='red',
        color='skyblue',
        error_kw={'elinewidth': 3, 'capthick': 2})

plt.title('Customized Error Bars - how2matplotlib.com')
plt.xlabel('Groups')
plt.ylabel('Scores')
plt.show()
Output:
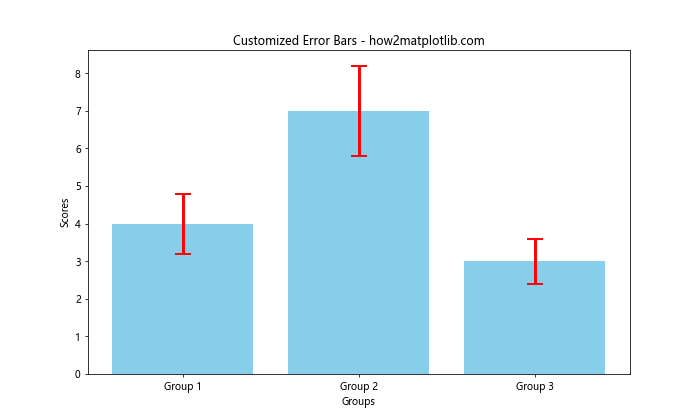
在这个例子中,我们自定义了以下内容:
– capsize: 设置误差线帽子的大小
– ecolor: 设置误差线的颜色
– color: 设置柱子的颜色
– error_kw: 一个字典,用于进一步自定义误差线,如线宽(elinewidth)和帽子厚度(capthick)
4. 不对称误差线
有时,我们需要表示上下不对称的误差。Matplotlib允许我们为每个数据点指定不同的上下误差值:
import matplotlib.pyplot as plt
import numpy as np

categories = ['Product A', 'Product B', 'Product C']
sales = [100, 150, 80]
lower_errors = [10, 20, 8]
upper_errors = [15, 25, 12]

plt.figure(figsize=(10, 6))
plt.bar(categories, sales, yerr=[lower_errors, upper_errors], capsize=7)

plt.title('Sales with Asymmetric Error Bars - how2matplotlib.com')
plt.xlabel('Products')
plt.ylabel('Sales (units)')
plt.show()
Output:
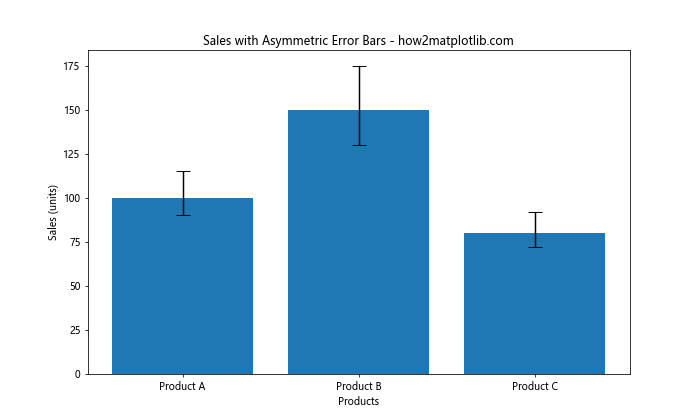
在这个例子中,yerr参数接受一个包含两个列表的列表,第一个列表表示下误差,第二个列表表示上误差。
5. 水平柱状图的误差线
除了垂直柱状图,我们也可以为水平柱状图添加误差线。这在处理长标签或比较多个类别时特别有用:
import matplotlib.pyplot as plt
import numpy as np

categories = ['Category A', 'Category B', 'Category C', 'Category D', 'Category E']
values = [4, 7, 3, 8, 5]
errors = [0.5, 1, 0.3, 1.1, 0.7]

plt.figure(figsize=(10, 6))
plt.barh(categories, values, xerr=errors, capsize=5)

plt.title('Horizontal Bar Plot with Error Bars - how2matplotlib.com')
plt.xlabel('Values')
plt.ylabel('Categories')
plt.show()
Output:
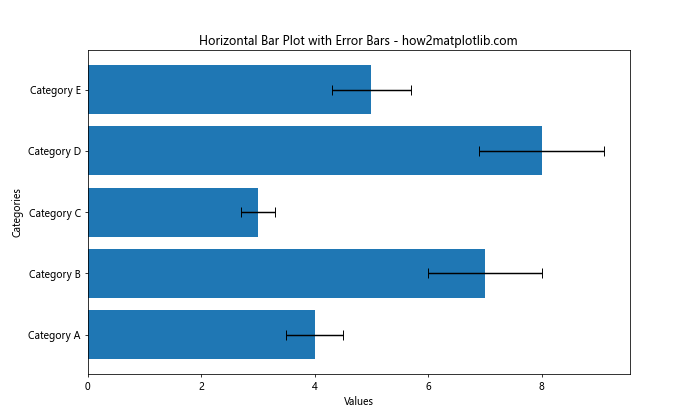
在水平柱状图中,我们使用plt.barh()函数,并将yerr参数改为xerr。
6. 分组柱状图的误差线
当我们需要比较多个组或类别时,分组柱状图非常有用。以下是如何为分组柱状图添加误差线:
import matplotlib.pyplot as plt
import numpy as np

categories = ['Group 1', 'Group 2', 'Group 3']
men_scores = [20, 35, 30]
women_scores = [25, 32, 34]
men_errors = [2, 3, 4]
women_errors = [3, 5, 2]

x = np.arange(len(categories))
width = 0.35

fig, ax = plt.subplots(figsize=(10, 6))
rects1 = ax.bar(x - width/2, men_scores, width, yerr=men_errors, label='Men', capsize=5)
rects2 = ax.bar(x + width/2, women_scores, width, yerr=women_errors, label='Women', capsize=5)

ax.set_ylabel('Scores')
ax.set_title('Grouped Bar Plot with Error Bars - how2matplotlib.com')
ax.set_xticks(x)
ax.set_xticklabels(categories)
ax.legend()

plt.show()
Output:
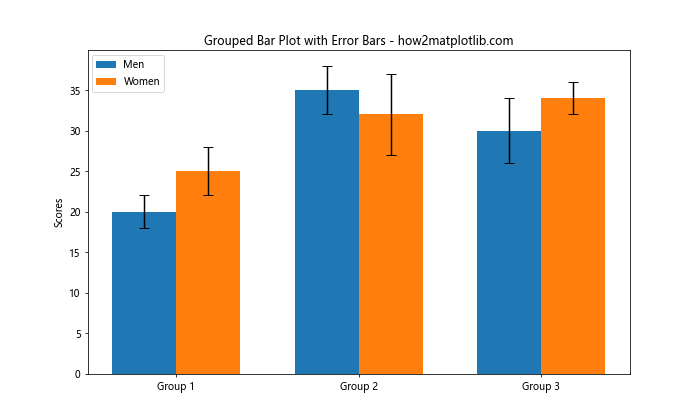
在这个例子中,我们创建了两组柱子,每组代表一个性别,并为每个柱子添加了相应的误差线。
7. 使用Pandas数据框的误差线
在实际应用中,我们经常使用Pandas处理数据。以下是如何直接从Pandas数据框创建带误差线的柱状图:
import matplotlib.pyplot as plt
import pandas as pd
import numpy as np

# 创建示例数据框
data = pd.DataFrame({
    'Category': ['A', 'B', 'C', 'D'],
    'Value': [10, 15, 13, 17],
    'Error': [1, 1.5, 1.2, 2]
})

plt.figure(figsize=(10, 6))
data.plot(kind='bar', x='Category', y='Value', yerr='Error', capsize=5, ax=plt.gca())

plt.title('Bar Plot from Pandas DataFrame - how2matplotlib.com')
plt.xlabel('Categories')
plt.ylabel('Values')
plt.show()
Output:
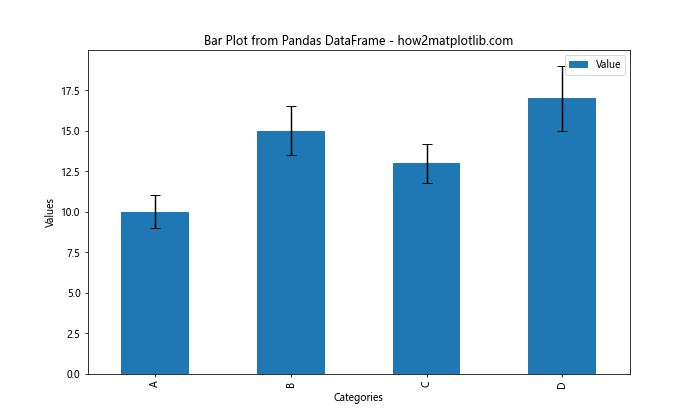
这个方法特别适合处理大型或复杂的数据集,因为它可以直接利用Pandas的数据处理能力。
8. 添加误差线到堆叠柱状图
堆叠柱状图用于显示部分对整体的贡献,我们也可以为其添加误差线:
import matplotlib.pyplot as plt
import numpy as np

categories = ['Q1', 'Q2', 'Q3', 'Q4']
product_a = [10, 15, 12, 18]
product_b = [5, 8, 7, 10]
errors_a = [1, 1.5, 1.2, 2]
errors_b = [0.5, 0.8, 0.7, 1]

plt.figure(figsize=(10, 6))

plt.bar(categories, product_a, label='Product A')
plt.bar(categories, product_b, bottom=product_a, label='Product B')

plt.errorbar(categories, np.array(product_a) + np.array(product_b),
             yerr=errors_b, fmt='none', capsize=5, color='black')
plt.errorbar(categories, product_a, yerr=errors_a, fmt='none', capsize=5, color='red')

plt.title('Stacked Bar Plot with Error Bars - how2matplotlib.com')
plt.xlabel('Quarters')
plt.ylabel('Sales')
plt.legend()
plt.show()
Output:
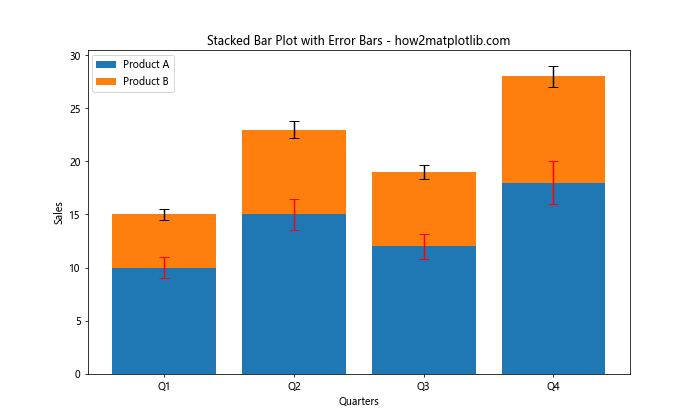
在这个例子中,我们使用plt.errorbar()函数单独添加误差线,以避免与堆叠柱子冲突。
9. 使用Seaborn库添加误差线
Seaborn是基于Matplotlib的统计数据可视化库,它提供了更简单的接口来创建带误差线的柱状图:
import matplotlib.pyplot as plt
import seaborn as sns
import pandas as pd

# 创建示例数据
data = pd.DataFrame({
    'Category': ['A', 'B', 'C', 'D'] * 3,
    'Value': [3, 7, 2, 5, 4, 6, 3, 4, 5, 8, 2, 3],
    'Group': ['Group1'] * 4 + ['Group2'] * 4 + ['Group3'] * 4
})

plt.figure(figsize=(12, 6))
sns.barplot(x='Category', y='Value', hue='Group', data=data, capsize=0.1)

plt.title('Seaborn Bar Plot with Error Bars - how2matplotlib.com')
plt.xlabel('Categories')
plt.ylabel('Values')
plt.show()
Output:
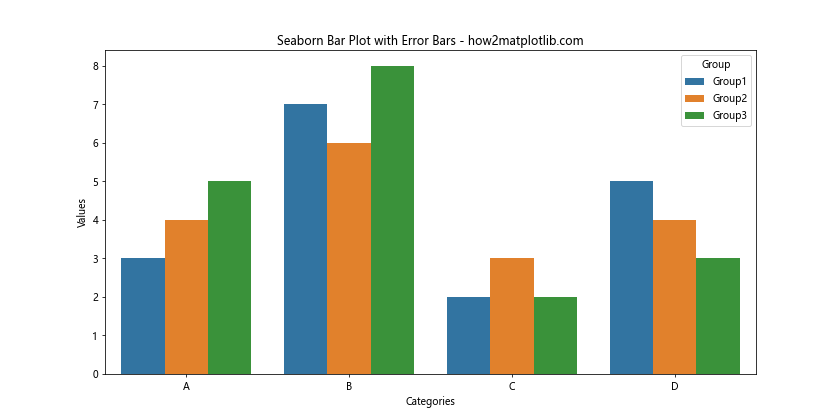
Seaborn自动计算并添加误差线(默认为95%置信区间),使得创建统计图表变得更加简单。
10. 自定义误差线计算方法
有时,我们可能需要使用自定义的方法来计算误差。以下是一个使用标准差作为误差的例子:
import matplotlib.pyplot as plt
import numpy as np

categories = ['Group A', 'Group B', 'Group C']
data = [
    [1, 2, 3, 4, 5],
    [2, 4, 6, 8, 10],
    [3, 6, 9, 12, 15]
]

means = [np.mean(group) for group in data]
stds = [np.std(group) for group in data]

plt.figure(figsize=(10, 6))
plt.bar(categories, means, yerr=stds, capsize=7)

plt.title('Bar Plot with Standard Deviation as Error - how2matplotlib.com')
plt.xlabel('Groups')
plt.ylabel('Values')
plt.show()
Output:
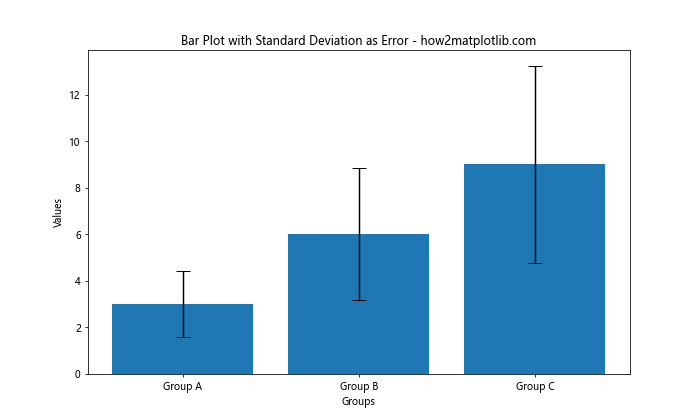
在这个例子中,我们使用NumPy的mean()和std()函数分别计算每组数据的平均值和标准差。
11. 添加误差线到多子图
当我们需要在一个图形中展示多个相关但独立的柱状图时,可以使用子图:
import matplotlib.pyplot as plt
import numpy as np

fig, (ax1, ax2) = plt.subplots(1, 2, figsize=(15, 6))

# 第一个子图
categories1 = ['A', 'B', 'C']
values1 = [4, 7, 3]
errors1 = [0.5, 1, 0.3]

ax1.bar(categories1, values1, yerr=errors1, capsize=5)
ax1.set_title('Subplot 1 - how2matplotlib.com')
ax1.set_xlabel('Categories')
ax1.set_ylabel('Values')

# 第二个子图
categories2 = ['X', 'Y', 'Z']
values2 = [6, 2, 8]
errors2 = [0.8, 0.4, 1.2]

ax2.bar(categories2, values2, yerr=errors2, capsize=5, color='orange')
ax2.set_title('Subplot 2 - how2matplotlib.com')
ax2.set_xlabel('Categories')
ax2.set_ylabel('Values')

plt.tight_layout()
plt.show()
Output:
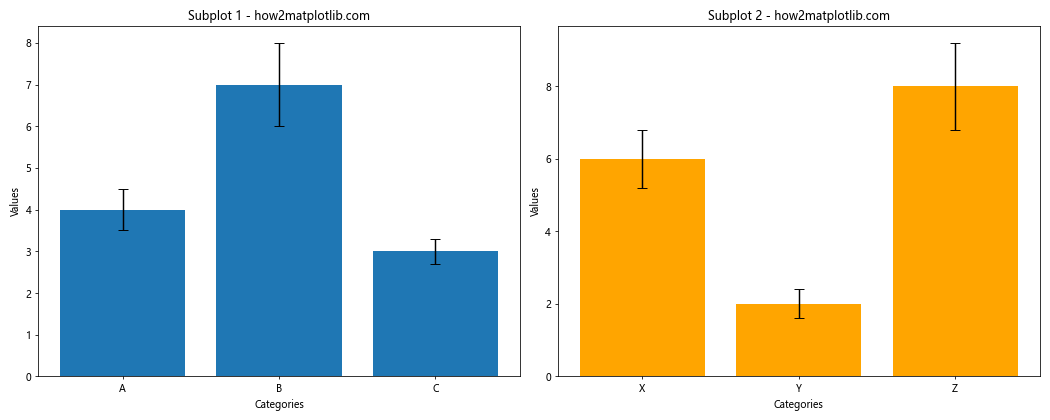
这个例子展示了如何在一个图形中创建两个带误差线的柱状图子图。
12. 结合箱线图和误差线
有时,我们可能想要同时展示误差线和其他统计信息,如箱线图:
import matplotlib.pyplot as plt
import numpy as np

np.random.seed(42)
data = [np.random.normal(loc, scale, 100) for loc, scale in [(5, 1), (7, 1.5), (3, 2)]]
labels = ['Group A', 'Group B', 'Group C']

fig, ax = plt.subplots(figsize=(12, 6))

# 绘制箱线图
bp = ax.boxplot(data, labels=labels, patch_artist=True)

# 计算均值和标准误差
means = [np.mean(d) for d in data]
std_errors = [np.std(d) / np.sqrt(len(d)) for d in data]

# 添加误差线
ax.errorbar(range(1, len(data) + 1), means, yerr=std_errors, fmt='ro', capsize=5)

plt.title('Box Plot with Error Bars - how2matplotlib.com')
plt.xlabel('Groups')
plt.ylabel('Values')
plt.show()
Output:
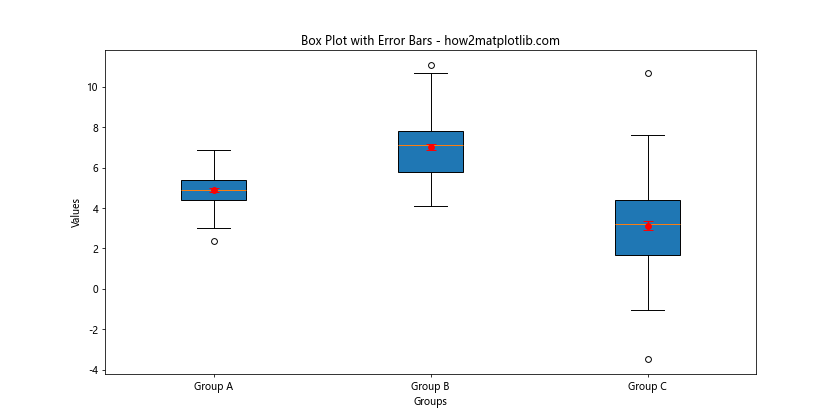
这个例子展示了如何将箱线图和误差线结合,提供更全面的数据分布信息。
13. 动态更新误差线
在某些应用中,我们可能需要动态更新误差线,例如在实时数据分析或交互式可视化中。以下是一个简单的动态更新误差线的示例:
import matplotlib.pyplot as plt
import numpy as np
from matplotlib.animation import FuncAnimation

fig, ax = plt.subplots(figsize=(10, 6))
x = ['A', 'B', 'C', 'D']
y = [3, 7, 2, 5]
yerr = [0.5, 1, 0.3, 0.8]

bars = ax.bar(x, y, yerr=yerr, capsize=5)
ax.set_ylim(0, 10)

def update(frame):
    new_y = [np.random.randint(1, 10) for _ in range(4)]
    new_yerr = [np.random.uniform(0.1, 1.5) for _ in range(4)]
    for bar, h, err in zip(bars, new_y, new_yerr):
        bar.set_height(h)
        new_error = [[err], [err]]
        bar.set_yerr(new_error)
    ax.set_title(f'Frame {frame} - how2matplotlib.com')
    return bars

ani = FuncAnimation(fig, update, frames=range(50), interval=200, blit=False)
plt.show()
Output:
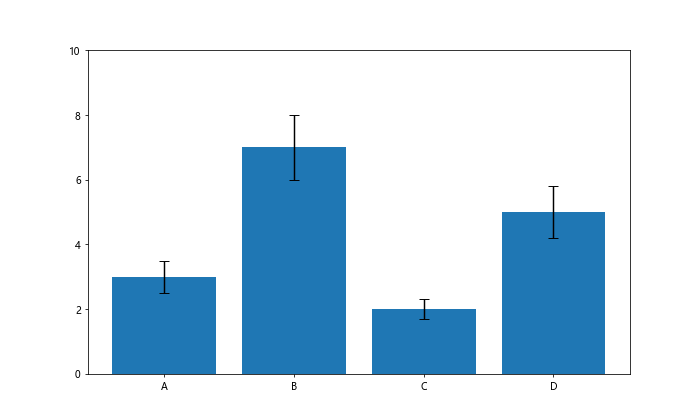
这个例子创建了一个动画,每200毫秒更新一次柱状图的高度和误差线。
14. 添加误差线到极坐标柱状图
极坐标柱状图在某些特定场景下非常有用,比如展示周期性数据。以下是如何为极坐标柱状图添加误差线:
import matplotlib.pyplot as plt
import numpy as np

# 数据
theta = np.linspace(0, 2*np.pi, 8, endpoint=False)
radii = np.array([4, 3, 6, 2, 5, 4, 3, 4])
width = np.pi/4
errors = np.array([0.5, 0.3, 0.7, 0.2, 0.6, 0.4, 0.3, 0.5])

# 创建极坐标图
fig, ax = plt.subplots(figsize=(10, 10), subplot_kw=dict(projection='polar'))

# 绘制柱状图
bars = ax.bar(theta, radii, width=width, bottom=0.0, alpha=0.5)

# 添加误差线
for theta, radius, error in zip(theta, radii, errors):
    ax.errorbar(theta, radius, yerr=error, capsize=5, color='red', linewidth=2)

ax.set_title('Polar Bar Plot with Error Bars - how2matplotlib.com')
plt.show()
Output:
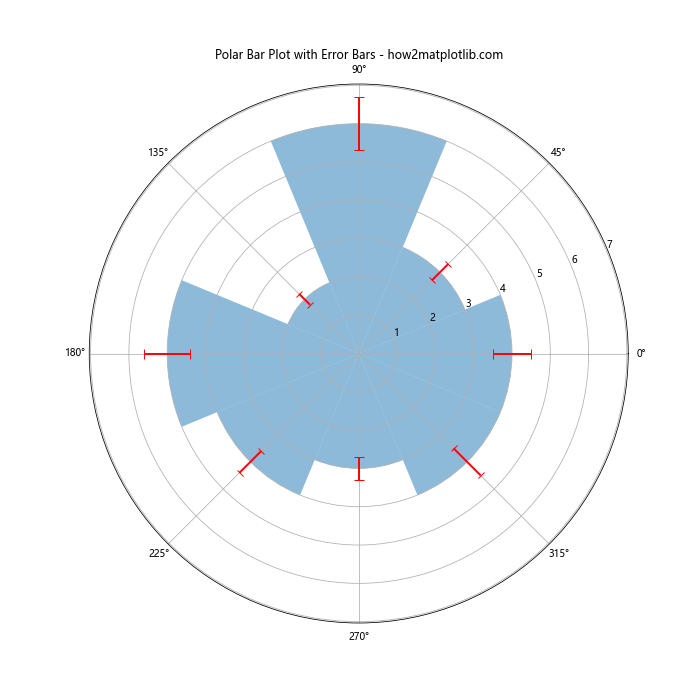
这个例子展示了如何在极坐标系中创建柱状图并添加误差线,适用于展示具有周期性或方向性的数据。
15. 使用颜色映射的误差线
当我们想要根据误差大小来区分不同的数据点时,可以使用颜色映射:
import matplotlib.pyplot as plt
import numpy as np

categories = ['A', 'B', 'C', 'D', 'E']
values = [4, 7, 2, 5, 3]
errors = [0.2, 1.5, 0.5, 1.0, 0.7]

fig, ax = plt.subplots(figsize=(10, 6))

# 使用误差值作为颜色映射的输入
scatter = ax.scatter(categories, values, s=1000, c=errors, cmap='viridis')

# 添加误差线
ax.errorbar(categories, values, yerr=errors, fmt='none', capsize=5, ecolor='black')

# 添加颜色条
plt.colorbar(scatter, label='Error Magnitude')

ax.set_title('Bar Plot with Color-mapped Error Bars - how2matplotlib.com')
ax.set_xlabel('Categories')
ax.set_ylabel('Values')

plt.show()
Output:
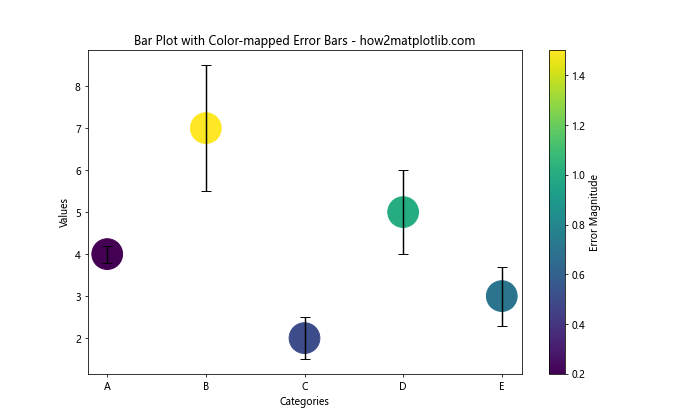
这个例子使用散点图和误差线的组合来模拟柱状图,并根据误差大小来设置点的颜色。
16. 3D柱状图的误差线
虽然在3D图中添加误差线不如2D图那么直观,但我们仍然可以通过创造性的方法来实现:
import matplotlib.pyplot as plt
import numpy as np

fig = plt.figure(figsize=(12, 8))
ax = fig.add_subplot(111, projection='3d')

x = np.array([0, 1, 2, 3])
y = np.array([0, 1, 2, 3])
z = np.array([3, 5, 2, 4])
dx = dy = 0.8
dz = np.array([0.5, 0.8, 0.3, 0.6])

ax.bar3d(x, y, np.zeros_like(z), dx, dy, z, shade=True)

for xi, yi, zi, dzi in zip(x, y, z, dz):
    ax.plot([xi+dx/2, xi+dx/2], [yi+dy/2, yi+dy/2], [zi, zi+dzi], color='red', linewidth=2)
    ax.plot([xi+dx/2-0.1, xi+dx/2+0.1], [yi+dy/2, yi+dy/2], [zi+dzi, zi+dzi], color='red', linewidth=2)

ax.set_title('3D Bar Plot with Error Lines - how2matplotlib.com')
ax.set_xlabel('X axis')
ax.set_ylabel('Y axis')
ax.set_zlabel('Z axis')

plt.show()
Output:
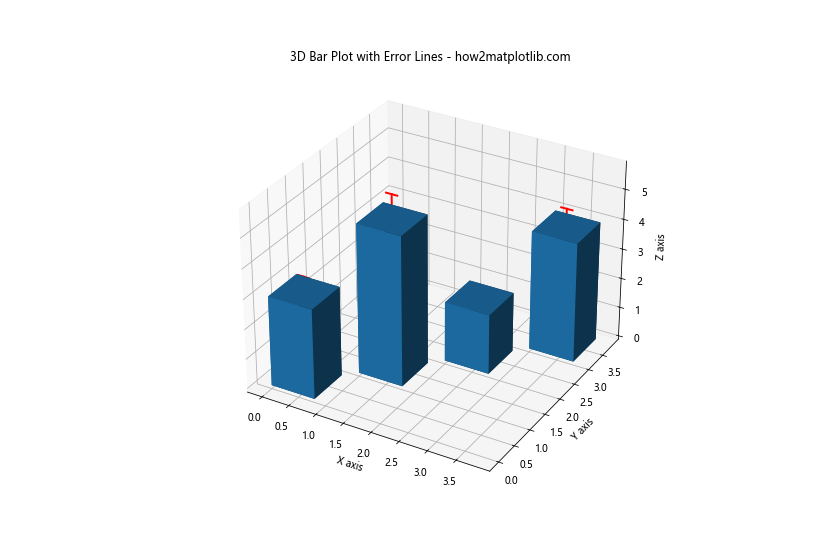
这个例子展示了如何在3D柱状图上添加简单的误差线。
17. 使用Bootstrap方法计算误差线
Bootstrap是一种常用的统计方法,用于估计统计量的不确定性。以下是如何使用Bootstrap方法计算误差并添加到柱状图:
import matplotlib.pyplot as plt
import numpy as np
from scipy import stats

np.random.seed(42)

# 生成示例数据
data = [np.random.normal(loc, scale, 100) for loc, scale in [(5, 1), (7, 1.5), (3, 2)]]
labels = ['Group A', 'Group B', 'Group C']

# 计算均值和Bootstrap置信区间
means = [np.mean(d) for d in data]
ci_lower = []
ci_upper = []

for d in data:
    bootstrap_means = [np.mean(np.random.choice(d, size=len(d), replace=True)) for _ in range(1000)]
    ci = np.percentile(bootstrap_means, [2.5, 97.5])
    ci_lower.append(means[data.index(d)] - ci[0])
    ci_upper.append(ci[1] - means[data.index(d)])

# 绘制柱状图和误差线
fig, ax = plt.subplots(figsize=(10, 6))
x = range(len(labels))
ax.bar(x, means, yerr=[ci_lower, ci_upper], capsize=7, alpha=0.7)

ax.set_xlabel('Groups')
ax.set_ylabel('Values')
ax.set_title('Bar Plot with Bootstrap Confidence Intervals - how2matplotlib.com')
ax.set_xticks(x)
ax.set_xticklabels(labels)

plt.show()
这个例子展示了如何使用Bootstrap方法计算置信区间,并将其作为误差线添加到柱状图中。
18. 结合误差线和数值标签
在某些情况下,我们可能希望在柱状图上同时显示误差线和具体的数值标签:
import matplotlib.pyplot as plt
import numpy as np

categories = ['A', 'B', 'C', 'D']
values = [4, 7, 2, 5]
errors = [0.5, 1, 0.3, 0.8]

fig, ax = plt.subplots(figsize=(10, 6))
bars = ax.bar(categories, values, yerr=errors, capsize=7)

# 添加数值标签
for bar in bars:
    height = bar.get_height()
    ax.text(bar.get_x() + bar.get_width()/2., height,
            f'{height:.1f}',
            ha='center', va='bottom')

ax.set_ylabel('Values')
ax.set_title('Bar Plot with Error Bars and Value Labels - how2matplotlib.com')

plt.show()
Output:
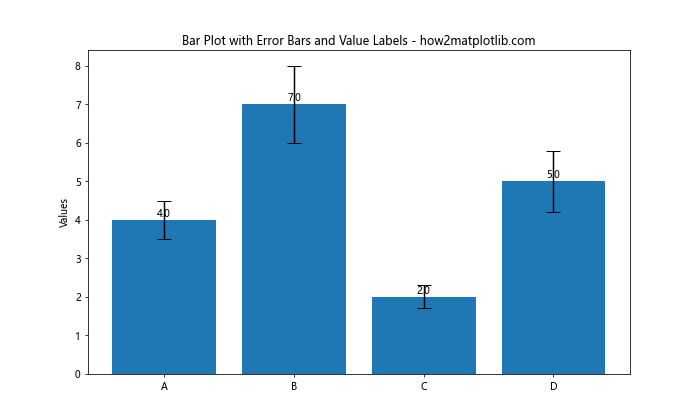
这个例子展示了如何在带有误差线的柱状图上添加数值标签,使图表更加信息丰富。
19. 使用不同形状的误差线
虽然传统的误差线通常是直线,但我们也可以尝试使用不同的形状来表示误差:
import matplotlib.pyplot as plt
import numpy as np

categories = ['A', 'B', 'C', 'D']
values = [4, 7, 2, 5]
errors = [0.5, 1, 0.3, 0.8]

fig, ax = plt.subplots(figsize=(12, 6))
x = range(len(categories))

# 绘制柱状图
bars = ax.bar(x, values, alpha=0.7)

# 添加自定义形状的误差线
for i, (value, error) in enumerate(zip(values, errors)):
    ax.add_patch(plt.Circle((i, value + error), 0.1, fill=False, color='red'))
    ax.add_patch(plt.Circle((i, value - error), 0.1, fill=False, color='red'))
    ax.plot([i, i], [value - error, value + error], color='red', linestyle='--')

ax.set_xticks(x)
ax.set_xticklabels(categories)
ax.set_ylabel('Values')
ax.set_title('Bar Plot with Custom Error Indicators - how2matplotlib.com')

plt.show()
Output:
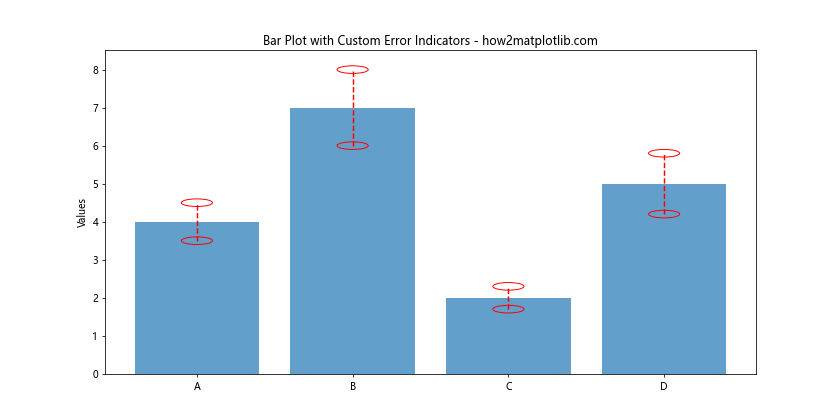
这个例子使用圆圈和虚线来表示误差范围,为误差表示提供了一种新的视觉方式。
20. 结合误差线和趋势线
在某些情况下,我们可能希望在柱状图上同时显示误差线和趋势线:
import matplotlib.pyplot as plt
import numpy as np

categories = ['2018', '2019', '2020', '2021', '2022']
values = [3, 4, 5, 7, 6]
errors = [0.5, 0.7, 0.6, 1, 0.8]

fig, ax = plt.subplots(figsize=(12, 6))
x = range(len(categories))

# 绘制柱状图和误差线
bars = ax.bar(x, values, yerr=errors, capsize=7, alpha=0.7)

# 添加趋势线
z = np.polyfit(x, values, 1)
p = np.poly1d(z)
ax.plot(x, p(x), "r--", linewidth=2)

ax.set_xticks(x)
ax.set_xticklabels(categories)
ax.set_ylabel('Values')
ax.set_title('Bar Plot with Error Bars and Trend Line - how2matplotlib.com')

plt.show()
Output:
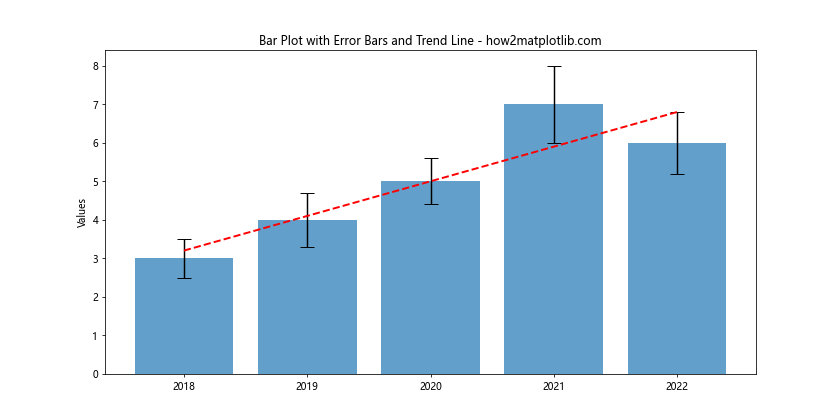
这个例子展示了如何在带有误差线的柱状图上添加趋势线,帮助观察数据的整体趋势。
总结
本文详细介绍了在Matplotlib中为柱状图添加误差线的多种方法和技巧。我们探讨了基本的误差线添加方法,自定义样式,处理不对称误差,以及在各种复杂场景下(如分组柱状图、堆叠柱状图、3D柱状图等)添加误差线的技巧。此外,我们还讨论了如何结合其他统计信息(如箱线图)、使用不同的误差计算方法(如Bootstrap),以及如何创建动态更新的误差线图表。
通过掌握这些技巧,你可以创建更加丰富、信息量更大的数据可视化,更好地传达数据的不确定性和变异性。在实际应用中,选择合适的误差表示方法对于准确传达数据信息至关重要。根据具体的数据特征和分析目的,灵活运用这些技巧,可以大大提升数据可视化的效果和价值。
最后,建议读者在实践中多尝试不同的方法,并根据具体的数据特征和展示需求选择最合适的误差线表示方式。同时,也要注意在添加误差线时保持图表的清晰度和可读性,避免信息过载导致的混乱。
 极客教程
极客教程