Matplotlib中为误差条添加垂直端点的全面指南
参考:Add perpendicular caps to error bars in Matplotlib
在数据可视化中,误差条是表示数据不确定性或变异性的重要工具。Matplotlib作为Python中强大的绘图库,提供了丰富的功能来创建和自定义误差条。本文将深入探讨如何在Matplotlib中为误差条添加垂直端点,这不仅能增强图表的可读性,还能使其在视觉上更加吸引人。我们将通过详细的解释和多个示例代码来展示这一技术的应用。
1. 误差条的基本概念
在开始讨论如何添加垂直端点之前,我们首先需要理解误差条的基本概念。误差条通常用于表示测量或估计的不确定性范围。在Matplotlib中,我们可以使用errorbar()函数来绘制误差条。
以下是一个基本的误差条示例:
import matplotlib.pyplot as plt
import numpy as np

x = np.linspace(0, 10, 50)
y = np.sin(x)
yerr = 0.1 + 0.2 * np.random.rand(len(x))

plt.figure(figsize=(10, 6))
plt.errorbar(x, y, yerr=yerr, fmt='o', label='Data with error bars')
plt.title('Basic Error Bars - how2matplotlib.com')
plt.xlabel('X-axis')
plt.ylabel('Y-axis')
plt.legend()
plt.show()
Output:
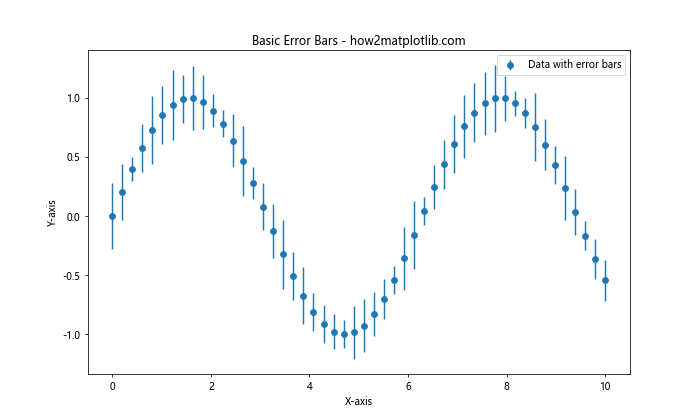
在这个例子中,我们创建了一个简单的正弦波数据集,并为每个数据点添加了随机的误差值。errorbar()函数的yerr参数用于指定Y轴方向的误差大小。
2. 为什么需要垂直端点?
垂直端点(也称为误差条帽子)是误差条两端的短横线。它们有几个重要的作用:
- 增强可读性:垂直端点清晰地标示了误差范围的边界,使读者更容易理解数据的不确定性。
- 美观性:端点可以使图表看起来更加完整和专业。
- 区分不同类型的误差:通过调整端点的样式,可以区分不同类型或来源的误差。
3. 使用capsize参数添加垂直端点
Matplotlib的errorbar()函数提供了一个简单的方法来添加垂直端点,那就是使用capsize参数。这个参数控制端点的长度(以点为单位)。
让我们看一个示例:
import matplotlib.pyplot as plt
import numpy as np

x = np.arange(1, 6)
y = [2, 4, 6, 8, 10]
yerr = [0.5, 1, 1.5, 2, 2.5]

plt.figure(figsize=(10, 6))
plt.errorbar(x, y, yerr=yerr, fmt='o', capsize=5, label='Data with caps')
plt.title('Error Bars with Caps - how2matplotlib.com')
plt.xlabel('X-axis')
plt.ylabel('Y-axis')
plt.legend()
plt.show()
Output:
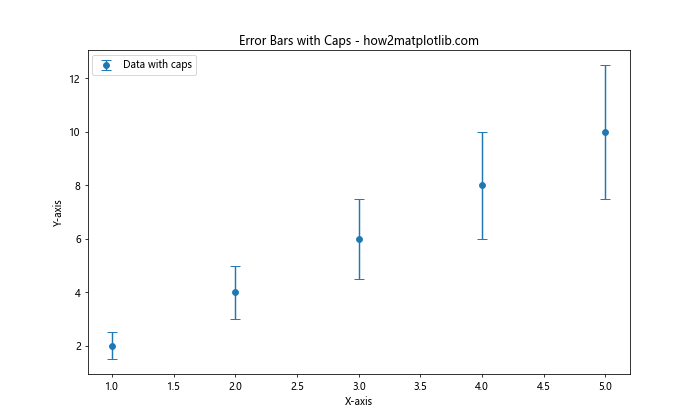
在这个例子中,我们设置capsize=5,这会在每个误差条的顶部和底部添加长度为5个点的垂直线段。
4. 自定义垂直端点的样式
除了简单地添加端点,我们还可以自定义它们的样式以满足特定的可视化需求。以下是一些常用的自定义选项:
4.1 调整端点颜色
我们可以使用ecolor参数来设置误差条和端点的颜色:
import matplotlib.pyplot as plt
import numpy as np

x = np.arange(1, 6)
y = [2, 4, 6, 8, 10]
yerr = [0.5, 1, 1.5, 2, 2.5]

plt.figure(figsize=(10, 6))
plt.errorbar(x, y, yerr=yerr, fmt='o', capsize=5, ecolor='red', label='Data with colored caps')
plt.title('Error Bars with Colored Caps - how2matplotlib.com')
plt.xlabel('X-axis')
plt.ylabel('Y-axis')
plt.legend()
plt.show()
Output:
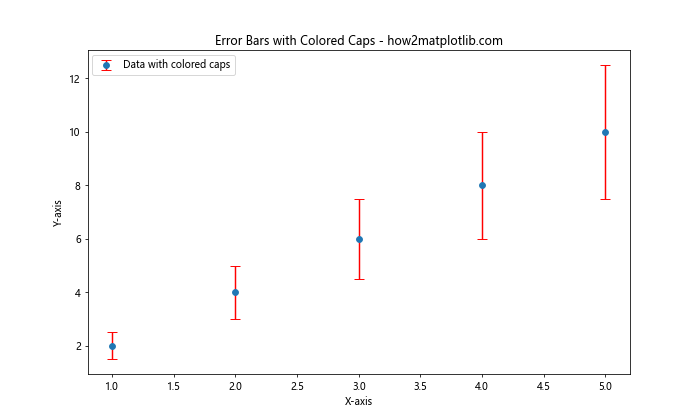
这个例子将误差条和端点的颜色设置为红色。
4.2 调整端点宽度
我们可以使用capthick参数来调整端点的宽度:
import matplotlib.pyplot as plt
import numpy as np

x = np.arange(1, 6)
y = [2, 4, 6, 8, 10]
yerr = [0.5, 1, 1.5, 2, 2.5]

plt.figure(figsize=(10, 6))
plt.errorbar(x, y, yerr=yerr, fmt='o', capsize=5, capthick=2, label='Data with thick caps')
plt.title('Error Bars with Thick Caps - how2matplotlib.com')
plt.xlabel('X-axis')
plt.ylabel('Y-axis')
plt.legend()
plt.show()
Output:
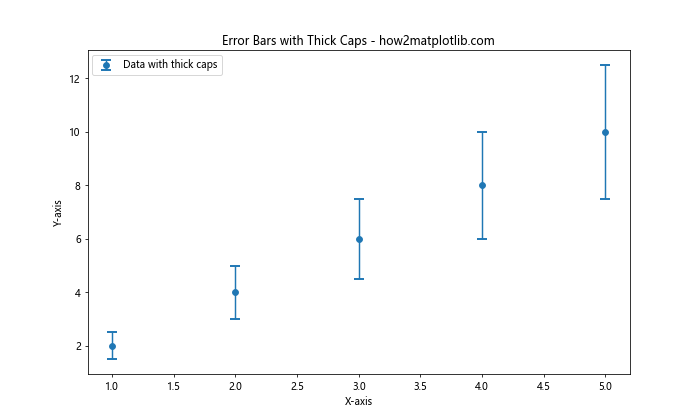
这个例子将端点的宽度设置为2,使其比默认值更粗。
5. 同时显示X轴和Y轴的误差条
在某些情况下,我们可能需要同时显示X轴和Y轴的误差。Matplotlib允许我们轻松地实现这一点:
import matplotlib.pyplot as plt
import numpy as np

x = np.arange(1, 6)
y = [2, 4, 6, 8, 10]
xerr = [0.2, 0.4, 0.6, 0.8, 1.0]
yerr = [0.5, 1, 1.5, 2, 2.5]

plt.figure(figsize=(10, 6))
plt.errorbar(x, y, xerr=xerr, yerr=yerr, fmt='o', capsize=5, label='Data with X and Y errors')
plt.title('Error Bars in Both Directions - how2matplotlib.com')
plt.xlabel('X-axis')
plt.ylabel('Y-axis')
plt.legend()
plt.show()
Output:
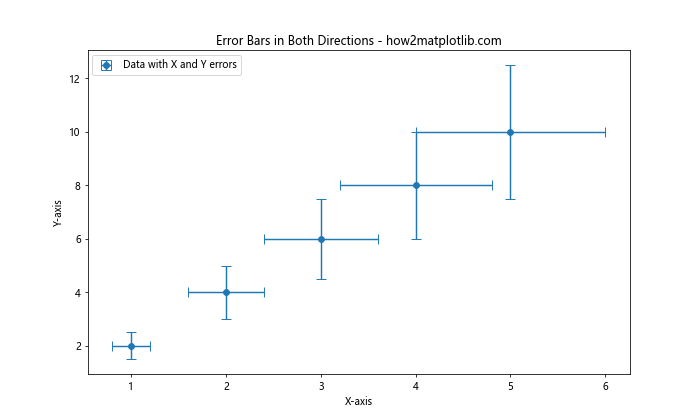
这个例子展示了如何同时为X轴和Y轴添加误差条,并为两个方向都添加了垂直端点。
6. 不对称误差条
有时,数据的上下误差可能不相等。Matplotlib允许我们为上下误差指定不同的值:
import matplotlib.pyplot as plt
import numpy as np

x = np.arange(1, 6)
y = [2, 4, 6, 8, 10]
yerr = np.array([[0.5, 1, 1.5, 2, 2.5], [1, 2, 3, 4, 5]])

plt.figure(figsize=(10, 6))
plt.errorbar(x, y, yerr=yerr, fmt='o', capsize=5, label='Data with asymmetric errors')
plt.title('Asymmetric Error Bars - how2matplotlib.com')
plt.xlabel('X-axis')
plt.ylabel('Y-axis')
plt.legend()
plt.show()
Output:
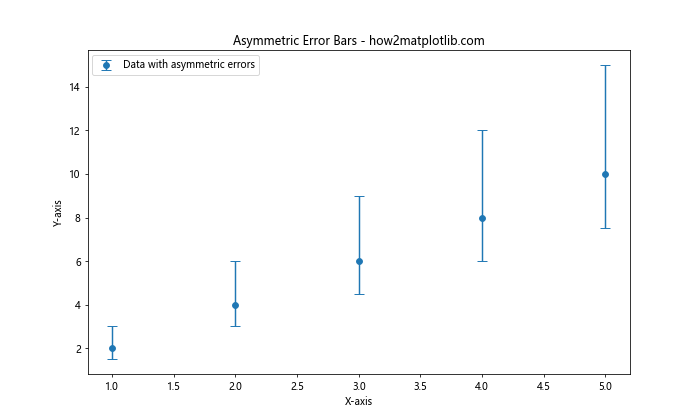
在这个例子中,yerr是一个2×5的数组,第一行表示下误差,第二行表示上误差。
7. 在条形图中添加误差条
误差条不仅可以用于散点图,还可以应用于条形图。以下是一个在条形图中添加带有垂直端点的误差条的例子:
import matplotlib.pyplot as plt
import numpy as np

categories = ['A', 'B', 'C', 'D']
values = [3, 7, 5, 9]
errors = [0.5, 1, 0.8, 1.2]

plt.figure(figsize=(10, 6))
bars = plt.bar(categories, values, yerr=errors, capsize=5, alpha=0.7, label='Data')
plt.title('Bar Chart with Error Bars - how2matplotlib.com')
plt.xlabel('Categories')
plt.ylabel('Values')
plt.legend()
plt.show()
Output:
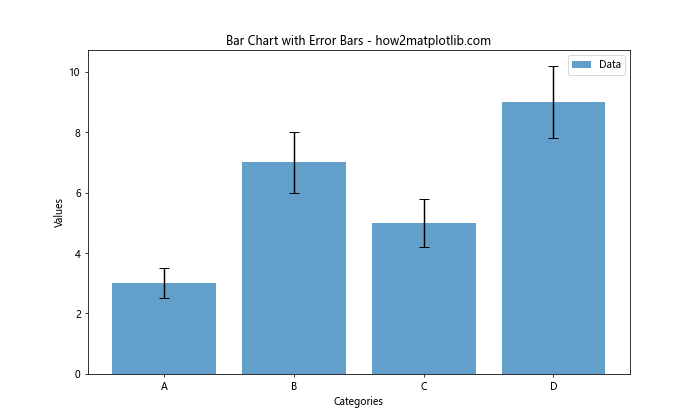
这个例子展示了如何在条形图中添加误差条,并为每个条形添加了垂直端点。
8. 自定义误差条的线型
除了调整颜色和宽度,我们还可以自定义误差条的线型:
import matplotlib.pyplot as plt
import numpy as np

x = np.arange(1, 6)
y = [2, 4, 6, 8, 10]
yerr = [0.5, 1, 1.5, 2, 2.5]

plt.figure(figsize=(10, 6))
plt.errorbar(x, y, yerr=yerr, fmt='o', capsize=5, linestyle='--', label='Data with dashed error bars')
plt.title('Error Bars with Custom Line Style - how2matplotlib.com')
plt.xlabel('X-axis')
plt.ylabel('Y-axis')
plt.legend()
plt.show()
Output:
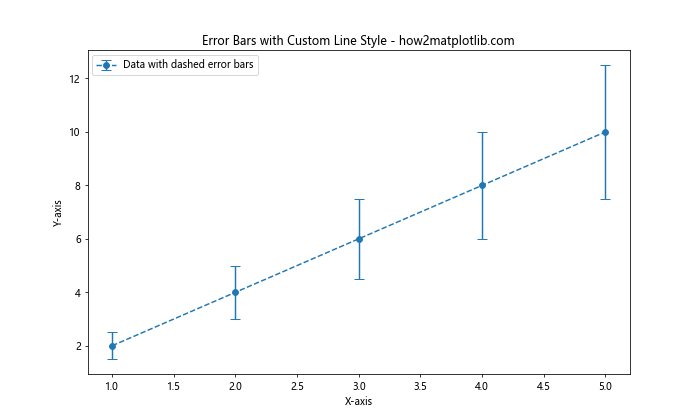
在这个例子中,我们使用linestyle='--'将误差条的线型设置为虚线。
9. 在3D图中添加误差条
虽然不太常见,但Matplotlib也支持在3D图中添加误差条:
import matplotlib.pyplot as plt
from mpl_toolkits.mplot3d import Axes3D
import numpy as np

fig = plt.figure(figsize=(10, 8))
ax = fig.add_subplot(111, projection='3d')

x = np.arange(1, 6)
y = np.arange(1, 6)
z = [2, 4, 6, 8, 10]
zerr = [0.5, 1, 1.5, 2, 2.5]

ax.errorbar(x, y, z, zerr=zerr, fmt='o', capsize=5, label='3D data with error bars')
ax.set_xlabel('X-axis')
ax.set_ylabel('Y-axis')
ax.set_zlabel('Z-axis')
ax.set_title('3D Error Bars - how2matplotlib.com')
plt.legend()
plt.show()
Output:
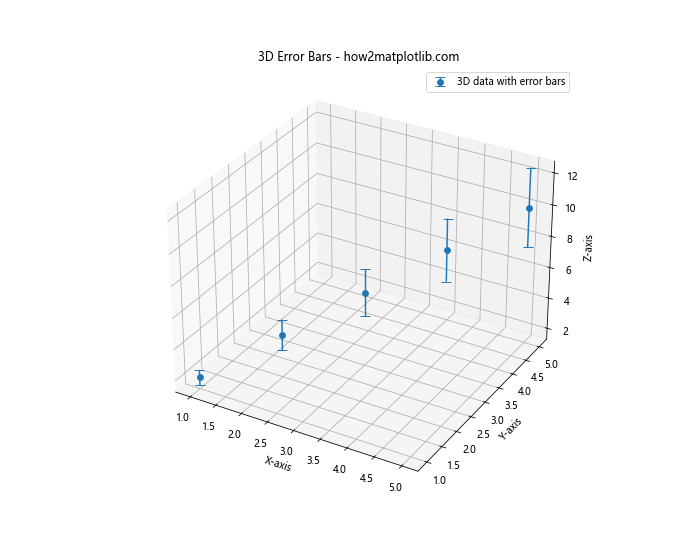
这个例子展示了如何在3D图中添加Z轴方向的误差条。
10. 使用填充区域代替误差条
有时,使用填充区域来表示误差范围可能比使用误差条更直观:
import matplotlib.pyplot as plt
import numpy as np

x = np.linspace(0, 10, 50)
y = np.sin(x)
error = 0.2 + 0.2 * np.random.rand(len(x))

plt.figure(figsize=(10, 6))
plt.plot(x, y, 'b-', label='Data')
plt.fill_between(x, y-error, y+error, alpha=0.2, label='Error range')
plt.title('Error Range as Filled Area - how2matplotlib.com')
plt.xlabel('X-axis')
plt.ylabel('Y-axis')
plt.legend()
plt.show()
Output:
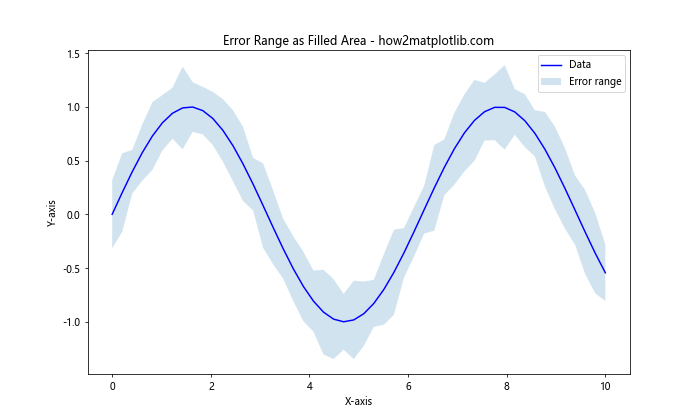
这个例子使用fill_between()函数创建了一个填充区域来表示误差范围,而不是使用传统的误差条。
11. 在箱线图中添加误差条
箱线图本身就包含了数据的分布信息,但有时我们可能想要添加额外的误差信息:
import matplotlib.pyplot as plt
import numpy as np

data = [np.random.normal(0, std, 100) for std in range(1, 4)]
errors = [0.2, 0.3, 0.4]

fig, ax = plt.subplots(figsize=(10, 6))
bplot = ax.boxplot(data, patch_artist=True, labels=['A', 'B', 'C'])

for i, (patch, error) in enumerate(zip(bplot['boxes'], errors)):
    y = patch.get_path().vertices[0, 1]
    ax.errorbar(i+1, y, yerr=error, fmt='none', capsize=5, color='red')

plt.title('Box Plot with Error Bars - how2matplotlib.com')
plt.ylabel('Values')
plt.show()
Output:
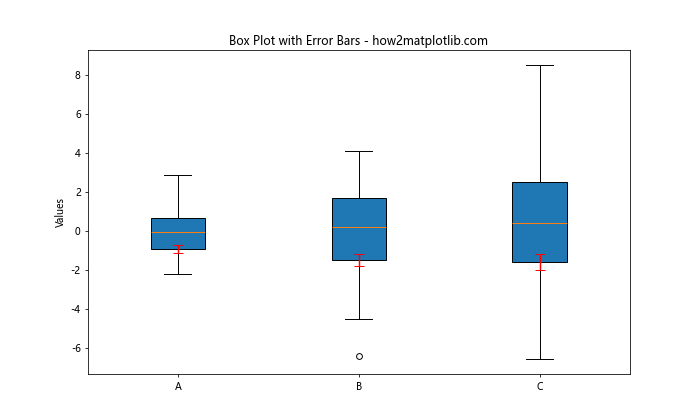
这个例子展示了如何在箱线图的中位数位置添加误差条。
12. 使用不同的标记样式
我们可以结合不同的标记样式来增强误差条图的可读性:
import matplotlib.pyplot as plt
import numpy as np

x = np.arange(1, 6)
y1 = [2, 4, 6, 8, 10]
y2 = [1, 3, 5, 7, 9]
yerr1 = [0.5, 1, 1.5, 2, 2.5]
yerr2 = [0.4, 0.8, 1.2, 1.6, 2.0]

plt.figure(figsize=(10, 6))
plt.errorbar(x, y1, yerr=yerr1, fmt='o', capsize=5, label='Data 1')
plt.errorbar(x, y2, yerr=yerr2, fmt='s', capsize=5, label='Data 2')
plt.title('Error Bars with Different Markers - how2matplotlib.com')
plt.xlabel('X-axis')
plt.ylabel('Y-axis')
plt.legend()
plt.show()
Output:
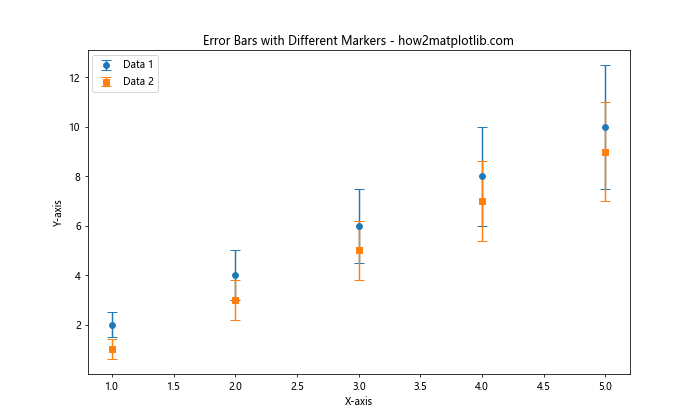
这个例子使用了圆形和方形标记来区分两组数据。
13. 在误差条上添加数据标签
有时,我们可能想要在误差条上直接显示数值:
import matplotlib.pyplot as plt
import numpy as np

x = np.arange(1, 6)
y = [2, 4, 6, 8, 10]
yerr = [0.5, 1, 1.5, 2, 2.5]

plt.figure(figsize=(10, 6))
plt.errorbar(x, y, yerr=yerr, fmt='o', capsize=5, label='Data')

for i, (xi, yi, yerri) in enumerate(zip(x, y, yerr)):
    plt.text(xi, yi+yerri, f'{yi:.1f}±{yerri:.1f}', ha='center', va='bottom')

plt.title('Error Barswith Data Labels - how2matplotlib.com')
plt.xlabel('X-axis')
plt.ylabel('Y-axis')
plt.legend()
plt.show()
Output:
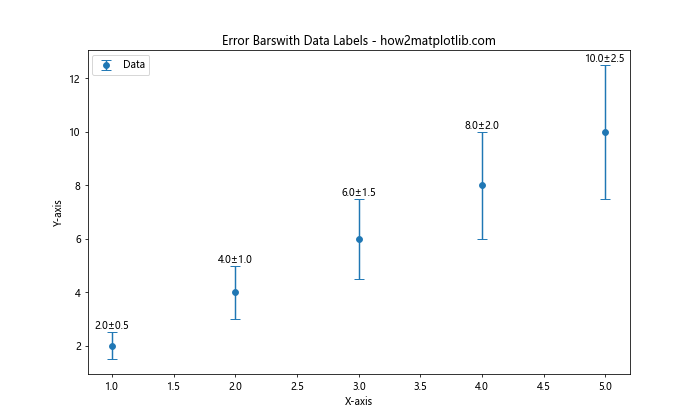
这个例子在每个数据点上方添加了数值标签,显示了数据值和误差范围。
14. 使用对数刻度
在某些情况下,我们可能需要在对数刻度上绘制误差条:
import matplotlib.pyplot as plt
import numpy as np

x = np.logspace(0, 2, 5)
y = np.exp(x)
yerr = y * 0.1

plt.figure(figsize=(10, 6))
plt.errorbar(x, y, yerr=yerr, fmt='o', capsize=5, label='Data')
plt.xscale('log')
plt.yscale('log')
plt.title('Error Bars on Log Scale - how2matplotlib.com')
plt.xlabel('X-axis (log scale)')
plt.ylabel('Y-axis (log scale)')
plt.legend()
plt.grid(True)
plt.show()
Output:
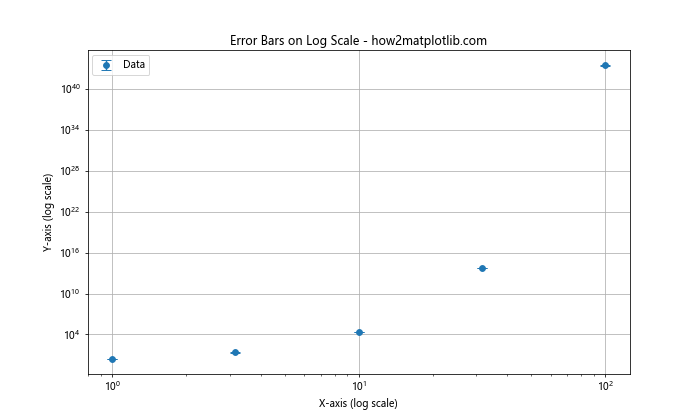
这个例子展示了如何在双对数坐标系中绘制带有误差条的数据。
15. 在极坐标系中添加误差条
Matplotlib也支持在极坐标系中添加误差条:
import matplotlib.pyplot as plt
import numpy as np

theta = np.linspace(0, 2*np.pi, 8, endpoint=False)
r = 10 * np.random.rand(8)
rerr = 0.5 * r

fig, ax = plt.subplots(figsize=(10, 10), subplot_kw=dict(projection='polar'))
ax.errorbar(theta, r, yerr=rerr, fmt='o', capsize=5)
ax.set_title('Error Bars in Polar Coordinates - how2matplotlib.com')
plt.show()
Output:
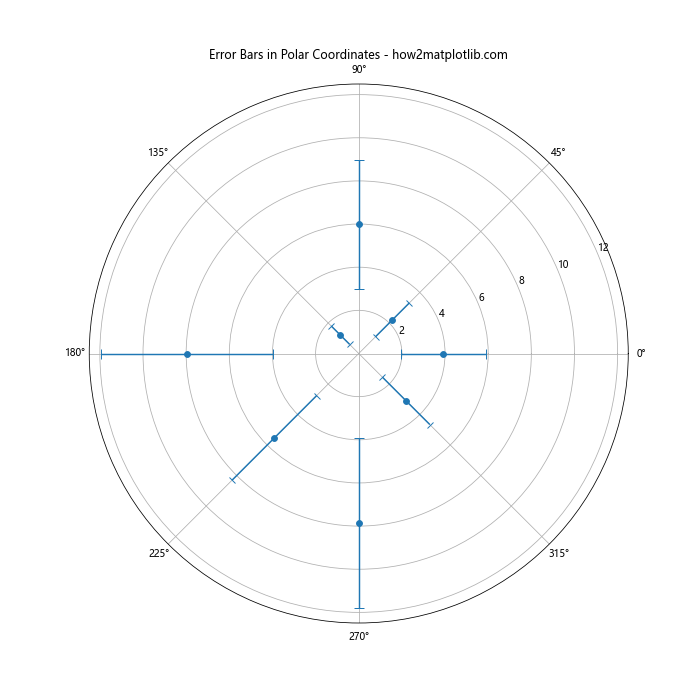
这个例子展示了如何在极坐标系中添加径向误差条。
16. 使用误差条比较多组数据
当我们需要比较多组数据时,误差条可以帮助我们更好地理解数据之间的差异:
import matplotlib.pyplot as plt
import numpy as np

categories = ['A', 'B', 'C', 'D']
group1 = [3, 7, 5, 9]
group2 = [2, 6, 4, 8]
errors1 = [0.5, 1, 0.8, 1.2]
errors2 = [0.4, 0.9, 0.7, 1.1]

x = np.arange(len(categories))
width = 0.35

fig, ax = plt.subplots(figsize=(12, 6))
rects1 = ax.bar(x - width/2, group1, width, yerr=errors1, capsize=5, label='Group 1')
rects2 = ax.bar(x + width/2, group2, width, yerr=errors2, capsize=5, label='Group 2')

ax.set_ylabel('Values')
ax.set_title('Comparison of Groups with Error Bars - how2matplotlib.com')
ax.set_xticks(x)
ax.set_xticklabels(categories)
ax.legend()

plt.show()
Output:
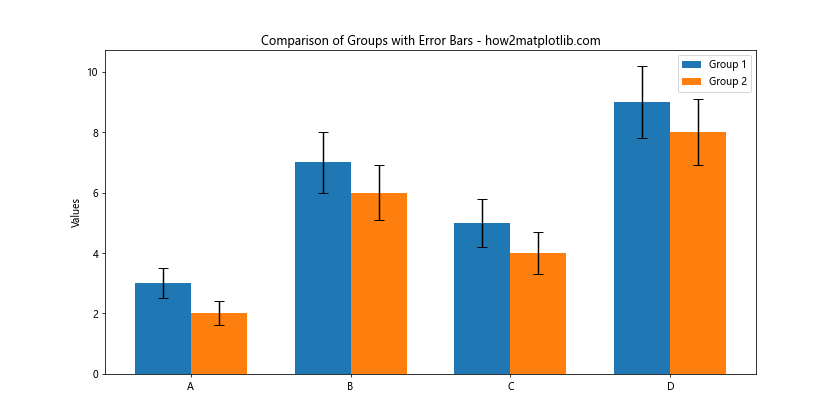
这个例子展示了如何使用并排的条形图和误差条来比较两组数据。
17. 自定义误差条的端点样式
除了使用简单的线段作为端点,我们还可以使用其他样式:
import matplotlib.pyplot as plt
import numpy as np

x = np.arange(1, 6)
y = [2, 4, 6, 8, 10]
yerr = [0.5, 1, 1.5, 2, 2.5]

plt.figure(figsize=(10, 6))
plt.errorbar(x, y, yerr=yerr, fmt='o', capsize=5, capthick=2,
             ecolor='red', markeredgecolor='blue', markerfacecolor='blue')
plt.title('Error Bars with Custom Cap Style - how2matplotlib.com')
plt.xlabel('X-axis')
plt.ylabel('Y-axis')
plt.show()
Output:
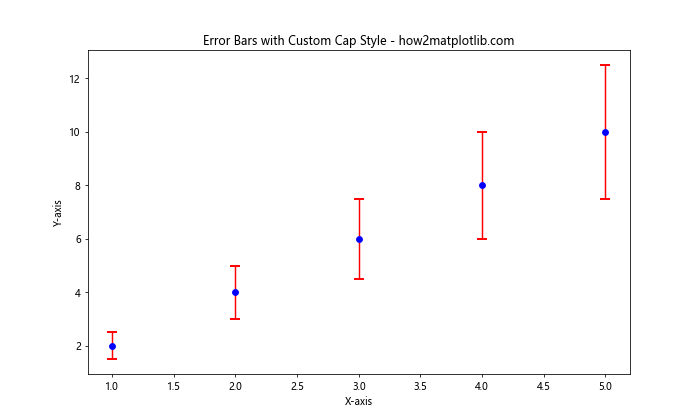
这个例子展示了如何自定义误差条的颜色、宽度以及数据点的样式。
18. 在时间序列数据中添加误差条
对于时间序列数据,我们可能需要在日期轴上添加误差条:
import matplotlib.pyplot as plt
import numpy as np
import pandas as pd

dates = pd.date_range(start='2023-01-01', periods=5, freq='D')
values = [10, 12, 15, 14, 16]
errors = [1, 1.5, 2, 1.8, 2.2]

plt.figure(figsize=(12, 6))
plt.errorbar(dates, values, yerr=errors, fmt='o', capsize=5)
plt.title('Time Series Data with Error Bars - how2matplotlib.com')
plt.xlabel('Date')
plt.ylabel('Value')
plt.gcf().autofmt_xdate()  # Rotate and align the tick labels
plt.show()
Output:
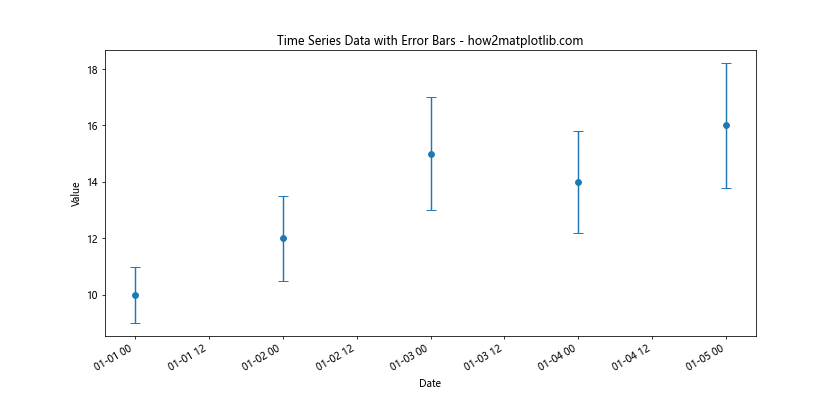
这个例子展示了如何在日期轴上添加误差条,并自动调整日期标签的格式。
结论
在Matplotlib中为误差条添加垂直端点是一种简单而有效的方法,可以增强数据可视化的清晰度和专业性。通过本文介绍的各种技巧和示例,你应该能够根据自己的需求灵活地使用和自定义误差条。
记住,虽然误差条是表示数据不确定性的有力工具,但它们也可能使图表变得复杂。因此,在使用时要权衡清晰度和信息量,确保你的可视化既准确又易于理解。
最后,不断实践和尝试不同的设置是掌握这一技能的关键。随着你对Matplotlib的深入了解,你将能够创建出更加精美和信息丰富的数据可视化作品。
 极客教程
极客教程